A BETTER TOKYO DOME January 2020 - Squarespace
←
→
Page content transcription
If your browser does not render page correctly, please read the page content below
A BETTER TOKYO DOME January 2020
Important Legal Disclaimer
This presentation is being made available to all shareholders of Tokyo Dome Corporation (9681:JP). Oasis Management Company Ltd. ("Oasis")
is the investment manager of private funds (the “Oasis Funds”) that own shares in Tokyo Dome Corporation. Oasis has created this presentation
to set out our Proposals to Tokyo Dome in order to increase the value of the Tokyo Dome Corporation shares in the best interest of all
shareholders.

Oasis is not and should not be regarded or deemed in any way whatsoever to be (i) soliciting or requesting other shareholders of Tokyo Dome
Corporation to exercise their shareholders’ rights (including, but not limited to, voting rights) jointly or together with Oasis, (ii) making an offer, a
solicitation of an offer, or any advice, invitation or inducement to enter into or conclude any transaction, or (iii) any advice, invitation or
inducement to take or refrain from taking any other course of action (whether on the terms shown therein or otherwise).

The presentation exclusively represents the beliefs, opinions, interpretations, and estimates of Oasis in relation to Tokyo Dome Corporation's
business and governance structure. Oasis is expressing such opinions solely in its capacity as an investment adviser to the Oasis Funds.

The information contained herein is derived from publicly available information deemed by Oasis to be reliable. The information herein may
contain forward-looking statements which can be identified by the fact that they do not relate strictly to historical or current facts and include,
without limitation, words such as “may,” “will,” “expects,” “believes,” “anticipates,” “plans,” “estimates,” “projects,” “targets,” “forecasts,”
“seeks,” “could” or the negative of such terms or other variations on such terms or comparable terminology. Similarly, statements that describe
Oasis’s objectives, plans or goals are forward-looking. Any forward-looking statements are based on Oasis’s current intent, belief, expectations,
estimates and projections. These statements are not guarantees of future performance and involve risks, uncertainties, assumptions and other
factors that are difficult to predict and that could cause actual results to differ materially. Accordingly, you should not rely upon forward-looking
statements as a prediction of actual results and actual results may vary materially from what is expressed in or indicated by the forward-looking
statements.

While Oasis believes that reasonable efforts have been made to ensure the accuracy of the information contained in this presentation, Oasis
makes no representation or warranty, expressed or implied, as to the accuracy, completeness or reliability of such information. Oasis expressly
disclaims any responsibility or liability for any loss howsoever arising from any use of or reliance on any of the information contained in the
presentation or any of their contents as a whole or in part by any person, or otherwise howsoever arising in connection with the same.

Oasis is not under any obligation to provide any updated or additional information or to correct any inaccuracies in the information contained
herein.

                                                                                                                                                      2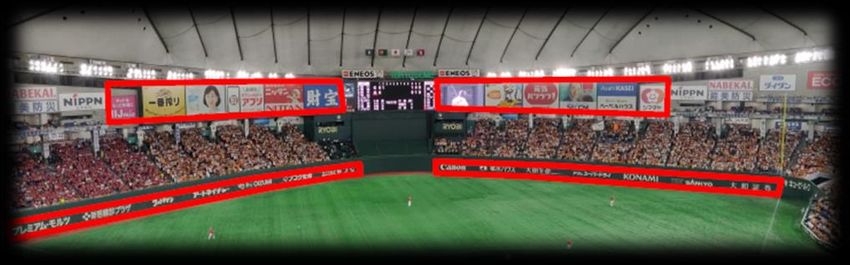
Executive Summary
Tokyo Dome Corporation sits on a treasure trove of assets that have been undermanaged:
1) Tokyo Dome, one of the largest stadiums in Tokyo has failed to meaningfully grow revenue or profitability. Revenue per guest
   has not changed in the past seven years. We believe this is due to a number of issues which have straightforward solutions:
       • The Dome’s lack of digital signage limits advertising revenue and leads to sponsor conflicts. This can be addressed by
         upgrading to LED signage.
       • The Dome loses out on revenue from not having a naming rights sponsor. This can be addressed by entering into a
         naming rights agreement.
       • The Dome has underinvested in technology which has resulted in an inferior offering versus peers. Tokyo Dome can
         invest in various technology offerings to improve the fan experience.
       • Tokyo Dome’s F&B strategy is problematic. This can be improved through a multi-faceted approach that aims to
         increase spend per head, increase dwell time at the venue, and reduce transaction time.
       • Tokyo Dome’s hospitality offerings are subpar. These can be improved by reconfiguring boxes to create a more
         premium product.
       • Tokyo Dome’s event mix does not maximize profitability. The Company should shift to events that have higher F&B,
         merchandise, hospitality, and advertising value.
2) While hotel revenues and ADRs in Tokyo have been increasing, Tokyo Dome Hotel has witnessed declining revenues and
   occupancy over the last two years, and its banquets business has been in decline. The hotel’s issues can be fixed by bringing in
   an external manager to improve its operations.
3) Tokyo Dome’s theme park has failed to capture Japan’s tourism growth due to underinvestment. As a result, revenue per
   attendee has sharply declined. To improve its park, Tokyo Dome should partner with a Japanese content creator.

In addition, Tokyo Dome Corporation has a number of non-core assets for which management should conduct a strategic review.

From a corporate governance perspective, the Company should improve the composition of its Board to include a more
independent and diverse director slate, revise its compensation policy to align management’s incentives with that of
shareholders, and change its governance structure to enhance the board’s monitoring function.

With these changes, we estimate that Tokyo Dome Corporation can increase estimated 2021 net income by 7.1Bn yen and
realize 121% upside to its share price.

                        Note: Upside based on 1/30/2020 close.                                                                    3
Table of Contents
I.     Tokyo Dome Corporation Overview
II.    Tokyo Dome
        A. Overview
        B. Upgrade to Digital Signage
        C. Enter into Naming Rights Agreement
        D. Invest in Technology
        E.    Overhaul F&B Strategy
        F.    Reconfigure Hospitality Offering
        G. Optimize Event Mix
III.    Hotel
        A. Overview
        B. Issues
        C. Bring in External Manager
IV.    Amusement Park
        A. Overview
        B. Issues
        C. Partner with Content Creator
V.     Non-core Assets
        A. Overview
        B. Conduct an Asset-by-Asset Review
VI.    Corporate Governance
        A. Management and Board of Directors
        B. Alter Board Composition
        C. Revise Compensation Plan
        D. Change Governance Structure
VII.   Tokyo Dome Corporation Upside and Value Creation

                                                          4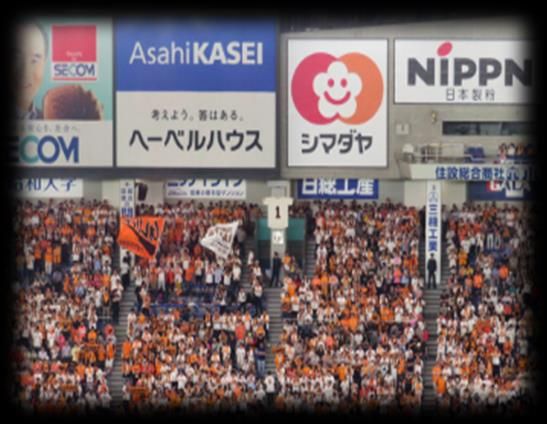
I. Tokyo Dome Corporation Overview

                                     5
Tokyo Dome Corporation Overview
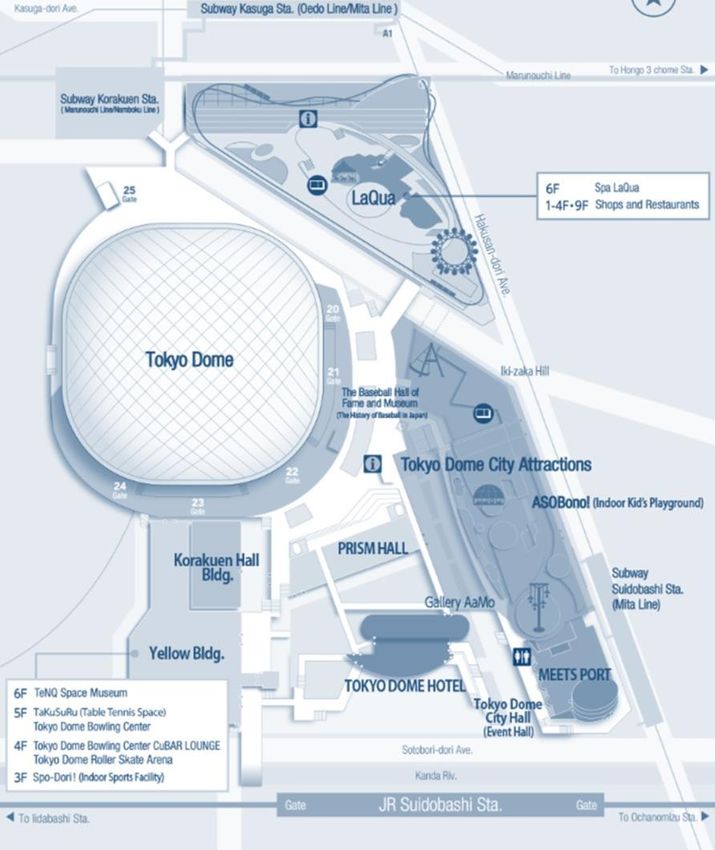
Tokyo Dome City’s stadium, theme park, and hotel occupy a ~140,000 square meter site in the heart of Central
Tokyo.
• Tokyo Dome Corporation owns and operates
attractions that are contained in a ~140,000 square
meter area in the Suidobashi district of Tokyo. Main
attractions include:
• Tokyo Dome: Indoor stadium that is home to
the Yomiuri Giants baseball team and also
hosts various concerts and events. Stadium
capacity is 57,000. The Tokyo Dome also
contains Japan’s Baseball Hall of Fame and
Museum.
• Tokyo Dome Hotel: 43 story hotel with 1,006
guest rooms.
• Tokyo Dome City Attractions: Theme park that
hosted nearly 6 million visitors in fiscal year
2019.
• The Company owns and operates a number of non-
core assets, including the Atami Korakuen Hotel, and
the Matsudo Keirin Velodrome.
6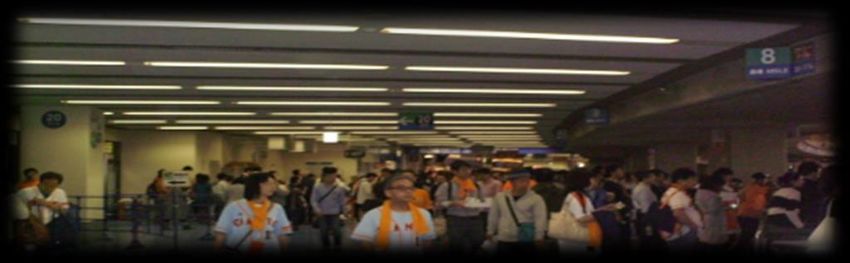
Tokyo Dome Corporation Overview cont’d…

         Tokyo Dome Corporation derives a majority of its revenue from the Tokyo Dome and the Tokyo Dome Hotel.

                         Financial Overview                                                         2019 Revenue Breakdown

(in ¥ B n)       2015       2016        2017        2018        2019
Revenue           83.2       85.9        87.8        83.7        87.0                            Other Businesses
                                                                                                       18%
 Growth         -0.5%       3.2%        2.2%       -4.7%        3.9%
Gross Profit      16.8         18        18.3        17.2        17.3
 Margin         20.2%      21.0%       20.8%       20.5%       19.9%                                                             Tokyo Dome
                                                                                             Amusement Park
EBITDA            18.6       20.3        19.3        18.1        18.4                                                                39%
                                                                                                  5%
 Margin         22.4%      23.6%       22.0%       21.6%       21.1%
Net Income         7.8        6.2         7.0         7.0         6.7
                                                                                              Other Dome City
 Margin          9.4%       7.2%        8.0%        8.4%        7.7%
                                                                                                 Revenue
                                                                                                    22%
(in ¥ mm)
Market Cap                97,103.6                                                                                  Tokyo Dome
                                                                                                                       Hotel
Net Debt                 125,668.0                                                                                      16%
Enterprise Value         222,771.6

LTM P/E                    11.57x
2020E P/E                  12.81x
2021E P/E                  12.14x

                            Note: Historical financials based on fiscal year ending 1/31. Pricing based on 1/30/2020 close.                   7
                            Source: Company filings, Bloomberg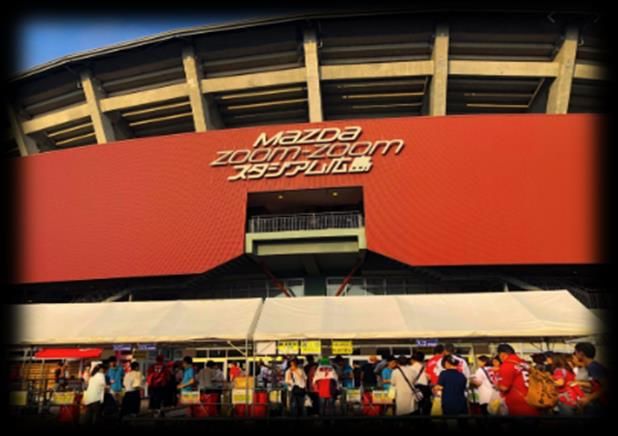
Tokyo Dome Corporation’s Financial Performance Has Lagged...
The Company’s revenue growth has been unimpressive, and its margins and free cash flow have deteriorated over the
                                              last five years.

                                       Revenue                                                                                    Operating Margin
                     89                                                                                            16%
                     88                                                                                            15%
                     87

                                                                                           Operating Margin
 Revenue (¥ Bn)

                                                                                                                   15%
                     86
                     85                                                                                            14%
                     84                                                                                            14%
                     83
                                                                                                                   13%
                     82
                     81                                                                                            13%
                     80                                                                                            12%
                           2015    2016        2017         2018        2019                                              2015    2016    2017       2018   2019

                                   Net Income Margin                                                                             Free Cash Flow
                     10%                                                                                           14
                                                                                                                   12
                     8%                                                                    Free Cash Flow (¥ Bn)
 Net Income Margin

                                                                                                                   10
                     6%                                                                                            8

                     4%                                                                                            6
                                                                                                                   4
                     2%
                                                                                                                   2
                     0%                                                                                            0
                            2015    2016        2017        2018        2019                                             2015    2016    2017        2018   2019
                                      Note: Financials based on fiscal year ending 1/31.
                                                                                                                                                                   8
                                      Source: Company filings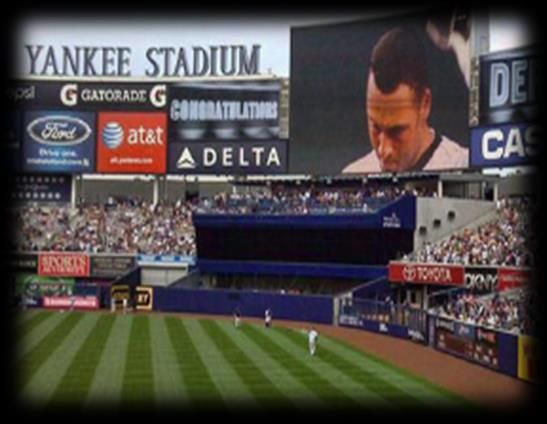
Despite Numerous Tailwinds

                                            Tokyo Dome Corporation has failed to capitalize on trends that are favorable for its business.

                                                 Increased Tourism to Japan                                                         Growth in Tokyo’s GDP

                                     35                                                                             112

                                     30

                                                                                                                    108
 Visits by Overseas Residents (mm)

                                     25

                                                                                                Tokyo GDP (¥ Trn)
                                     20
                                                                                                                    104

                                     15

                                     10                                                                             100

                                      5
                                                                                                                     0

                                                                                                                                                                       FY2017
                                                                                                                          FY2012

                                                                                                                                   FY2013

                                                                                                                                            FY2014

                                                                                                                                                     FY2015

                                                                                                                                                              FY2016

                                                                                                                                                                                FY2018
                                          2014       2015       2016        2017   2018

                                                                                                                                                                                         9
                                                        Source: NRI, JNTO
Despite Numerous Tailwinds cont’d

                                           Japanese consumers prefer to spend on experiences.

           Japanese Preferences for Experiences                                                                      Growing Baseball Attendance
                              0%    20% 40% 60% 80% 100%                                                     26

                                       69.2%

                                                                         Major League game attendance (mm)
I would rather spend money
   on experiences than on      14.6%        54.6%           27.8% 3.1%
      physical products
                                                                                                             25

                                   37.3%

Owning lots of things makes                                                                                  24
                               7.8% 29.5%           54.5%        8.3%
        me happy

      Strongly agree                       Somewhat agree
      Somewhat disagree                    Strongly disagree                                                 23
                                                                                                                  2015      2016        2017       2018

                                                                                                                                                          10
                          Source: Citi Research, NPB
Despite Numerous Tailwinds cont’d
Japan’s market for live music and corporate events is strong.
Strengthening Japanese Live Music Market Strength of MICE Events in Japan
4000 Total Output Total GDP Total Job
Rank Country Impact ($ Bn) Impact ($ Bn) Impact (000s)
3500 1 United States 787.0 446.1 5,905.0
Japanese live music event revenue (0.1 ¥ Bn )
2 China 372.8 247.3 5,215.0
3000
3 Germany 285.7 165.0 1,939.0
2500 4 United Kingdom 198.9 133.5 1,829.0
5 Japan 147.2 78.2 1,420.0
2000
6 Italy 70.2 38.3 569.0
1500 7 Canada 67.3 42.4 493.0
8 Australia 56.0 31.1 545.0
1000 9 France 53.6 27.4 456.0
10 Mexico 52.8 37.6 1,130.0
500
0
11
Source: All-Japan Concert and Live Entertainment Promoter’s Conference, Events Industry CouncilTokyo Dome Corporation’s Stock Has Underperformed
The Company’s stock has underperformed and is trading at historically low valuations.
Five-Year Stock Price Performance Five-Year BEst Forward P/E Valuations
300 22 100
90
20 9010: 80.6
80
4661: 232
70
200 18
9010: 197 60
4661: 57.2
16 50
TPX: 129 TPX: 14.7
9681: 14.2 40
100 9672: 119 14
9681: 118 30
20
12
9672: 20.7
10
0 10 0
12/17/14
12/17/15
12/17/16
12/17/17
12/17/18
12/17/19
6/17/16
6/17/15
6/17/17
6/17/18
6/17/19
12/17/14
12/17/15
12/17/16
12/17/17
12/17/18
12/17/19
Tokyo Dome (9681) Oriental Land (4661) Tokyo Dome (9681) Topix Index (TPX)
Topix Index (TPX) Tokyotokeiba (9672) Fuji Kyuko (9010) Oriental Land (4661)
Fuji Kyuko (9010) Tokyotokeiba (9672)
Note: Oasis’ involvement in Tokyo Dome Corporation became public on 12/17/2019.
Source: Bloomberg 12Why Has Tokyo Dome Corporation Underperformed?
Corporate
Tokyo Dome Hotel Amusement Park Non-core Assets
Governance
• No digital signage • Underinvestment • Dated attractions • Non-core assets • High fixed-pay ratio
pose a distraction
• No naming rights / • Lack of • Poor in-park • Board of Directors
sponsorships management spending • Atami Korakuen lacks independence
experience Hotel
• Underinvestment • No theme • Board of Directors
in technology • No clear strategy • Matsudo Keirin lacks diversity
for group business Racetrack
• Poor F&B strategy • Combined Chairman
and President
• Limited hospitality
positions
offerings
• Sub-optimal event
mix
13II. Tokyo Dome
14Tokyo Dome Overview
The Tokyo Dome is one of the largest stadiums in Tokyo. It is home of the Yomiuri Giants and hosts a range of other
entertainment acts.
Financial Overview
• The Tokyo Dome was opened in 1988 and replaced (in ¥ mm) 2015 2016 2017 2018 2019
Korakuen Stadium, which also hosted baseball.
Rent 13,518 13,977 14,069 14,555 14,838
• It is home of the major league baseball team – the F&B / Merchandise 14,314 14,440 16,898 15,831 17,988
Yomiuri Giants, who achieve the highest absolute level Total Revenue 27,832 28,417 30,967 30,386 32,826
of attendance among all of Japan’s major league Growth 2.1% 9.0% -1.9% 8.0%
baseball clubs. Operating Days 301 319 311.0 323.0 317
• It is the largest baseball stadium in Japan with 45,700 Utilization Rates 83% 87% 85% 89% 87%
capacity (with 42,000 all seated). Annual Visitors (000's) 8,124 8,464 8,681 8,883 9,321
• For non-baseball events, stadium capacity is 57,000.
• The Dome roof ensures that no events are postponed
due to weather.
• The Dome is located in Central Tokyo, north of the
Imperial Gardens, northwest of Tokyo’s main train
station and northeast of the ‘Heritage Zone’ of Olympic
venues which include the new Olympic Stadium.
Note: Financial overview as presented by Company. Company does not provide additional
breakdown of rent, F&B, merchandise categories.
15
Source: Company filingsThe Giants are Japan’s Most Popular Baseball Team
The Yomiuri Giants enjoy one of the highest attendance in the NPB.
2019 Season Attendance Figures of NPB
Average Attendees per Game (000's)
0 10 20 30 40 50
Chiba Lotte Marines
Chunichi Dragons
DeNA Baystars
Fukuoka Softbank Hawks
Hanshin Tigers
Hiroshoma Toyo Carp
Hokkaido Nippon-Ham Fighters
Orix Buffaloes
Saitama Seibu Lions
Tohoku Rakuten Golden Eagles
Yakult Swallows
Yomiuri Giants
1 2 3 4
Total Attendees (mm)
Total Attendees Average Attendees Per Game
Source: Nippon Professional Baseball Organization 16The Giants are Japan’s Most Popular Baseball Team cont’d
The Yomiuri Giants appear to sell more seats as season tickets and command premium ticket prices.
(in ¥)
Season Ticket:
Diamond Seat (best location) 2,200,000 N/A 432,000 - 648,000
Star / Bay Blue (next best location) 1,100,000 - 1,250,000 N/A 276,000 - 450,000
Excite / Exciting Seat 1,120,000 - 1,600,000 N/A 444,000 - 618,000
Beam Seat B / Marine Seat 399,000 - 570,000 N/A 132,000
Matchday Ticket:
Reserved Star / Best Infield 6,200 4,600 - 5,900 7,700 - 8,200
Outfield 2,200 2,000 - 2,900 3,400 - 3,900
Beam Seat B / Reserved Seat B / Marine Seat 4,000 3,200 - 4,400 5,700 - 6,200
Note: The Yomiuri Giants only offer one match day price, whereas the other teams have different
prices to reflect the category of game. 100% of ticket revenues are retained by the Giants.
17
Source: Club websites, BluerockYet, Tokyo Dome Has Failed to Capitalize
Total revenue per guest has not grown in the last seven years at Tokyo Dome.
Total Revenue Per Guest
3,600
3,500 CAGR= 0%
Total Revenue / Guest (¥)
3,400
3,300
3,200
3,100
3,000
2012 2013 2014 2015 2016 2017 2018 2019
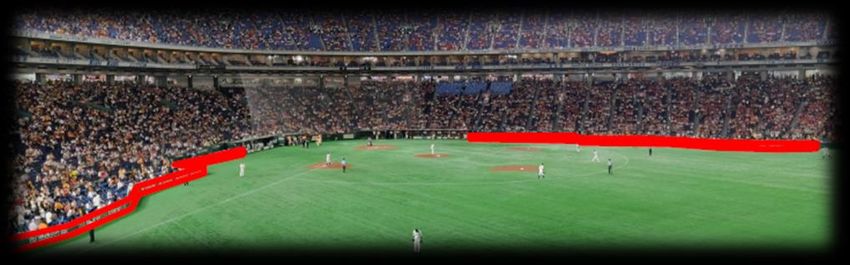
Source: Company filings 18Tokyo Dome’s Lack of Digital Signage Limits Advertising Revenue
The Tokyo Dome’s advertising strategy is based solely on static signage both inside and outside the Dome. Modern
venues have already moved from static signage to LED signage.
Interior static signage at Tokyo Dome Exterior static signage at Tokyo Dome Interior static signage at Tokyo Dome
LED screens at Fukuoka Yahuokul Home plate LED signage at Taoyuan LED screens at Yankee Stadium, New
Dome, Japan Stadium, Taiwan York, USA
19Tokyo Dome Should Upgrade to LED Signage
Moving from static signage to LED signage has numerous advantages for Tokyo Dome.
• LED signage provides a more immersive and engaging environment, improving customer experience.
• It enhances the message and content the advertisers can show and is more visible / noticeable, improving impact and
therefore value.
• It allows changes to the message to align with campaigns throughout a season, or to push specific messages at different
times.
• Dynamic displays allow more inventory to be sold in prime locations as advertisers can be rotated through one position.
• It allows a brand to ‘own’ advertising at a given moment, improving impact.
• It allows efficient and effective management of the advertising inventory.
• Advertising messages can be changed simply and cost effectively.
• According to our research, TOKYO DOME WAS EXCLUDED FROM THE 2019 RUGBY WORLD CUP AND THE TOKYO 2020
OLYMPICS due to sponsor conflicts. Digital signage would reduce the potential for sponsor conflict.
20LED Signage Upgrade Plan
Tokyo Dome should focus on five main areas when upgrading to LED signs.
1. LED Board on either side of the scoreboard. Each
measuring 40m x 6m.
2. LED pitch perimeter – scoreboard side. Two lines 1
of 90m x 1.8m each.
2
3.
4.
Ribbon boards at the lowest edge of each tier. Two
ribbons of 300m x 0.9m each.
LED pitch perimeter – home plate. Two lines of
3
90m x 1m each.
4
5. IPTV system installation with digital signage along
the concourses. GA concourses from 1F to 4F
(700 to 800 digital screens).
5
Source: Bluerock 21LED Signage ROIC Analysis
Assuming an estimated 1.4Bn yen increase to Tokyo Dome’s 2021 estimated profits1, upgrading to LED signage has
an ROIC of 68%.
Investment Dimensions / Area Cost / SQM Total Cost (¥ mm)
Specs Estimation (SQM) (¥ mm)
1
LED Board on either side of the scoreboard
Two boards 40m x 6m
Pixel Pitch 10mm
480 0.49 235
2 Two lines of 90m x
1.8m
324 0.49 159
LED pitch perimeter – scoreboard side
3 Two ribbons of 300 m
length 0.9m high
540 0.49 265
Ribbon boards at the lowest edge of each tier
4 Two lines of 90m x
1.0m
180 0.49 88
LED pitch perimeter – home plate
5
GA concourses from
1F to 4F (700 to 800 800 0.11 87
digital screens)
IPTV system with digital signage along concourses
TOTAL 2,324 834
(1) Profit lift based on Oasis’ estimates with input from Bluerock.
Source: Bluerock 22Tokyo Dome Does Not Have Sponsorship Agreements
Sponsorship agreements can bring additional revenue to venues and supplier agreement help reduce venue costs.
What are Sponsorship Agreements? Typical Naming / Sponsorship Structure
• In addition to a naming partner (discussed in following Naming
slides), venues may secure a number of exclusive sponsors Partner
for the venue.
Sponsor Sponsor Sponsor Sponsor
• Sponsorship agreements typically include cash payment A B C D
and supply of product / services to the venue.
• Many stadiums also receive top-up funding from sponsors Supplier A Supplier B Supplier C Supplier D
(e.g. catering contractors have provided one-off capital
contributions and / or have fitted out the kitchens and Supplier E Supplier F Supplier G Supplier H
dining areas in exchange for a long-term contract to
provide catering services).
• Offers can be creatively catered towards a variety of • Typically, below the naming partner, there are an exclusive
sponsors (e.g. an airline partner can sponsor a ‘Sky number of sponsors with extensive rights including
Lounge’ while a car company could sponsor a ‘valet branding, tickets, hospitality and certain marketing rights.
parking service’ for hospitality guests).
• Below them are various tiers of suppliers. Supplier deals are
• Sponsorship terms are also generally multi-year rather normally product and service related and have little to no
than annual and are therefore a more secure revenue cash component, but help reduce costs to the venue.
stream.
23Upside Potential from Upgrading to Digital Signage
Tokyo Dome should install LED signs and negotiate new advertising rates for the upgraded signage while looking for
future sponsorship opportunities. This would result in an estimated 1.4Bn yen increase in 2021 profits1.
Management Check List
❑ Management must engage with a third-party advertising agency to determine best practices for sign placement and pricing.
❑ Conversion to digital signage must occur during Giants’ off-season to minimize decline in advertising revenue.
❑ After completion of upgrade, Management must work with advertisers directly or through an agency to sell advertising in a
way that maximizes profit, keeping in mind potential opportunities from sponsorships and naming rights (discussed in the
following slides).
❑ The sponsorship market in Japan is relatively under-developed compared to advertising.
❑ If Tokyo Dome transitions too quickly to full sponsorship, it could lead to a reduction in revenue.
❑ Therefore, management should retain the advertising model but also look for future sponsorship opportunities as it negotiates
new advertising rates for its upgraded LED signage.
❑ Management needs to engage with consumer facing businesses to sell advertisements as many current ads are B2B (i.e Azbil
air conditioning, Fujitec elevators, Toyo Suisan fishery).
(1) Profit lift based on Oasis’ estimates with input from Bluerock. 24Tokyo Dome Does Not Have a Naming Rights Sponsor
Tokyo Dome forgoes billions of yen in revenue by not having a naming rights sponsor.
Naming Rights in Japan
• In Japan, most of the naming rights deals have been for
five or fewer years. However, there are exceptions:
• Kyocera Mita Corporation’s involvement in the Kyocera
Dome Osaka started in 2006.
• Mazda’s deal in Hiroshima started in 2009 and is due to
continue to 2024.
• ZoZo’s deal with the ZoZo Marine Stadium in Chiba is
due to last until 2026.
• The value of deals in Japan, where known, range from Mazda Zoom-Zoom Stadium in Hiroshima,
200m – 500m yen per season, comparable with US deals, home of the Hiroshima Toyo Carp
and we believe Tokyo naming rights would be a crown
jewel commanding a premium.
• Mazda ZoomZoom deal is 300mm yen per season.
• Yakuoku deal in Fukuoka is 500mm yen per season.
• Many Japanese companies already participate in stadium
naming and sponsorship abroad (e.g. Toyota, Ricoh) and
domestically (e.g. Mazda, Kyocera).
• The value of naming rights deals is largely related to the
quality of the content at the venue and the total audience
(in person and via television / other media). Kyocera Dome in Osaka, one of the homes of
the Orix Buffaloes
Source: Japan Times, Bluerock 25Tokyo Dome Should Enter Into A Naming Rights Agreement
Tokyo Dome should consider various factors to maximize the value of naming rights.
Factors Tokyo Dome Should Consider to Maximize Naming Rights Value
• Naming rights should be more than just a branding opportunity – the objective should be to create a true marketing
partnership where the venue, brand and customers all benefit from the relationship.
• Full naming rights – being able to call the venue ‘Mercedes-Benz Dome’ will have more value than ‘Tokyo Dome presented by
Mercedes-Benz.’
• Long-term deal – most naming rights are longer than typical sponsorships (many are 10 years or more). This has benefits of
securing income but the venue must also make sure there are escalators to the annual payments which could be triggered by
a certain number of visitors or events.
• Clear unique positioning – the venue must be able to articulate its USP to potential brands to extract maximum value for the
sponsorship. Brands want to sponsor properties that have similar brand values / attributes and the USP of the venue should
be articulated as part of the sales process.
• Integrated inventory – additional inventory in the package from tenant teams and / or contracted events (if possible) will
enhance the value.
• Execution – the investment made should be recognized by the implementation of high-quality branding and signage around
the venue and in all communications.
Note: Potential sponsor names used for illustrative purposes only. 26Tokyo Dome Should Enter Into A Naming Rights Agreement
cont’d…
Typically, a naming partner will have extensive rights including branding, tickets, hospitality and certain marketing
rights. Below is an example of a naming rights package Tokyo Dome can offer:
• Designation as ‘Official Naming Rights Partner’ of Tokyo Dome.
• Right to create a logo for the arena.
• Product / service category exclusivity.
• Extensive external and internal branding.
• Hospitality box and premium seating provided as part of package.
• Product showcasing zone within the Dome.
• Use of venue for a pre-agreed number of events for product launches or employee / client events.
• Use of conferencing and event space (for an agreed number of days a year).
• Additional ticketing for giveaways / competitions.
• Tailored rights according to naming partner category.
• Ability to provide a ‘clean’ sponsorship environment and cover up all sponsor branding as required by some events should
also be factored into a naming rights discussion. The ability to do this quickly will be facilitated by upgrading to digital
signage as previously discussed.
27Upside Potential from Tokyo Dome Naming Agreement
Tokyo Dome should pursue a naming rights agreement. This would result in an estimated 0.6Bn yen lift to 2021
profits1.
Management Check List
❑ Management must engage with a third-party advertising agency or consultant to tailor a naming agreement package that is in
line with Japanese corporate demands. This should serve as a starting point to negotiate specific terms with interested
parties.
❑ Management must entertain bids from multiple parties that are interested in entering into a naming agreement.
❑ Management must weigh all proposals and proceed with highest value agreement.
(1) Profit lift based on Oasis’ estimates with input from Bluerock. 28Tokyo Dome Has Underinvested in Technology
Tokyo Dome’s technology capital expenditures have been marginal which has resulted in an inferior offering versus
peers.
Tokyo Dome Technology Investment: Last 15 Years Tokyo Dome Vs. Peers
Date Technology Investment
2005 ● LED score board and screen
● LED lights for arena (outfield)
2016 ● New speakers (outfield)
● Hot water washing function for toilets
● LED lights for arena (infield) Access to the Tokyo Dome Wembley Stadium offers
2017
● New speakers (infield) involves temporary contactless ticketing, allowing
barricades and lots of staff guests to enter through
interactions. turnstiles by using their phone.
Tokyo Dome concourse Tottenham Hotspur Stadium
features fixed signage that concourse features modern
has to be set-up for specific fixtures, digital signage and an
events. updated appearance.
Source: Company website, Bluerock, sportsvenuebusiness.com 29Tokyo Dome Has Under Invested in Technology cont’d…
There are many areas where Tokyo Dome can invest in technology to enhance the fan experience and increase
profitability.
Technology Current Commentary Examples
Status at Tokyo Dome
Better Wi- A Wi-Fi system was advertised, • Mobile apps are the most efficient • Levi’s Stadium: 1 Wi-Fi access
Fi access but it is difficult to log-on and and profitable tool to engage and point to every 100 seats.
service is poor. activate fans at live events. • NTT setting up 1,300 Wi-Fi
• Many younger fans leave stadiums at points at New National
half time if they cannot connect to Stadium for Tokyo Olympics.
the internet.
Mobile app None. • Mobile apps are the most efficient
and profitable tool to engage and
activate fans at live events.
• Apps allow fans to:
• purchase premium seat
upgrades.
• check-in and locate seats.
• order food and beverages for
pick-up.
• find the closest restroom with
the shortest line.
• find concession stands with the
shortest line.
• see player statistics.
• watch re-play videos.
Source: Japan Times, Bluerock, Umbel 30Tokyo Dome Has Under Invested in Technology cont’d…
There are many areas where Tokyo Dome can invest in technology to enhance the fan experience and increase
profitability.
Technology Current Commentary Examples
Status at Tokyo Dome
Mobile point-of- • None. • Mobile POS systems allows
service • Recent AAA concert on 12/6/2019 vendors to sell food,
experience: beverages and merchandise
• Payment was cash, credit card, anywhere in the stadium,
Apple Pay and Suica/Pasmo even allowing for in-seat
(local equivalent of Oyster delivery.
Cards/Octopus Cards). • POS systems reduce wait
• QR code readers were not
times and increase spend
available for payment (PayPay/
per attendee.
Line/Alipay) apart from one As of 2018, more than 55% of all
stand that used an Avex group major league sports venues in the
QR code settlement app. U.S. use Appetize for mobile POS.
Beacons – None. • 93% of all MLB stadiums in
proximity US, 75% of all NFL
marketing stadiums, and 53% of all
devices that NBA arenas have deployed
communicate beacons in the US.
with • In its first season using
smartphones via beacons, the Golden State
MLB installed beacons at ballparks
Bluetooth based Warriors saw average
around the U.S. to offer spectators
on location transaction volume rise using iOS relevant information during
87%. the 2014 MLB season.
Source: Inc.com, Bluerock, Business Insider, blog.beaconstac.com 31Tokyo Dome Has Under Invested in Technology cont’d…
There are many areas where Tokyo Dome can invest in technology to enhance the fan experience and increase
profitability.
Technology Current Commentary Examples
Status at Tokyo Dome
E-ticketing None. • E-ticketing can reduce crowding at
Tokyo Dome’s revolving door.
entrances, thus reducing crowd control
staffing needs.
• E-ticketing can provide Tokyo Dome
with better data and customer insight
on attendees. Wembley Stadium offers contactless
• E-ticketing can reduce the number of ticketing, allowing guests to enter
staff needed to sell tickets at the through turnstiles by using their
phone.
counter and scan tickets upon entry.
Electronic menu None. • Electronic menu boards reflect product
boards and pricing changes.
• They also give venues the ability to
seamlessly change product offering by
event type (i.e. no alcohol at concerts
geared towards minors).
• Electronic menu boards can be used to
display information on queue times,
stadium facilities and bespoke in-
Example of menu board at Tokyo stadium content. Dual-displays at Bell Center,
Dome. Montreal, Canada.
Source: sportsvenuebusiness.com, navori.com 32Upside Potential from Investing in Technology
Tokyo Dome should upgrade its technology to improve the fan experience and increase profitability from F&B,
advertising, and hospitality.
Management Check List
❑ Management must engage with various technology providers and stadium consultants to learn more about offerings and
figure out the best partners for integrating the technology.
❑ Tokyo Dome’s management must engage with the Yomiuri Giants to develop a mobile app that includes e-ticketing and
mobile payment capabilities that will serve the mutual needs of the Giants and Tokyo Dome for non Giants events.
❑ Management should partner with a provider that can integrate data from access control and turnstiles, mobile apps and
cashless solutions that will provide information on customer demographics and their behavior and spending patterns.
❑ After implementing the technology, Management should create an internal data analytics team to analyze and use data
gathered from this technology upgrade.
33Tokyo Dome’s F&B Strategy Needs an Overhaul
Tokyo Dome’s average F&B revenue per head significantly lags that of top baseball stadiums due to a problematic
F&B strategy.
Fans may bring in their own beer which is poured into At a recent AAA concert, concessions closed once the event
paper cups by staff upon entry started and did not reopen for intermissions or at completion
Signs read: Items purchased can be
taken inside the Dome
Fans can bring their own food into the Dome The Dome’s concourse does not have areas for sitting /
standing
34Tokyo Dome’s F&B Strategy Needs an Overhaul cont’d…
Tokyo Dome’s average F&B revenue per head significantly lags that of top baseball stadiums due to a problematic
F&B strategy.
Food is pre-cooked and kept warm for the duration of the Cooking space available to food vendors is limited to kiosks
event, leading to poor quality and food safety issues in the outfield
The only items exclusive to Tokyo Dome and Giants are
There are 55 kiosks with very fragmented offerings
nachos and noodles served in a baseball cap bowl
35F&B Overhaul Case Study: Milwaukee Brewers Stadium
An improved F&B strategy at the Milwaukee Brewers Stadium led to a 25% increase in spending per head.
• A recent refit of the general admission offer at the
Milwaukee Brewers Stadium cost $20mm in 2017.
• Kiosk numbers were reduced to 11 larger kiosks.
• Central island units and two brand new Field-Level service
bars with a variety of MillerCoors offerings and field views
were added.
• The refit involved installing state-of-the-art equipment in the
permanent concession stands and portable locations to
enhance the quality of the offerings.
• 33% more point of sale terminals were installed to achieve Using the “Food Finder” or “Beverage Finder” feature
faster service. within the enhanced mobile app, fans can easily and
• Result: Spends per head increased by 25% following the conveniently search all of the new F&B offerings
refit.
Many of the concession offerings draw on Milwaukee’s Seating areas around kiosks encourage guests to linger
rich local food and drink traditions before and after events, leading to increased spend
Source: Bluerock, Ballparkdigest.com 36F&B Overhaul Case Study: Tottenham Hotspur Stadium
An revamped F&B offering at the new Tottenham Hotspur Stadium resulted in a 75% increase in spending per head.
• The new Tottenham Hotspur stadium invested significantly
in the general admission concourses and the F&B offering.
• THFC management diligenced other stadiums and arenas to
understand what was best in class and failures and
weaknesses of other venues.
• The venue incorporates a food atrium that is intended to be
used as a gathering place before and after matches and
opened up on non-game days.
• Result: Spends per head increased by 75% in the new The 65-meter Goal Line Bar is the longest bar in Europe.
stadium, the highest spend per head in Europe for a By making this a destination, fans are encouraged to
football stadium. The Spurs have been able to generate spend money before and after the event. All F&B
£800,000 in F&B revenue at each home game. outlets open 2.5 hours before kickoff and may remain
open for 2 hours after the final whistle
Cashless technology improves speed and hygiene as New technology allows beer to be poured hands-free by
catering staff doesn’t handle cash bar staff at a rate that is nine times faster than a
traditional tap
Source: Bluerock, shropshirestar.com, tottenhamhotspur.com 37Upside Potential from F&B Overhaul
Tokyo Dome’s management should focus on three key objectives to improve its F&B strategy. This would result in a
estimated 1.2Bn yen lift to 2021 profits1.
Objective Management Check List
1. Increase spend per ❑ Stop allowing outside food and drink into the Dome.
head ❑ Reduce the quantity of kiosks while expanding each kiosk to allow for cooking, improving quality
and food hygiene.
❑ Make F&B a destination before and after events.
❑ Improve signage to allow customers to get a better idea of what is available and make an informed
choice.
❑ Explore partnerships with known food brands (e.g. Shake Shack and Taco Bell) that seem popular
outside the Dome.
❑ Increase Giants / Dome co-branded F&B offerings.
2. Increase dwell time at ❑ Add seating areas around kiosks and standing areas throughout the concourse to create
the venue (both pre and destinations.
post-event) ❑ Ensure concession stands are open before, during, and after events.
❑ Explore partnerships with known food brands (e.g. Shake Shack and Taco Bell) that seem popular
outside the Dome.
3. Reduce queuing / ❑ Add electronic menu boards that display updated item availability, pricing, and queue time.
transaction time ❑ Reduce number of offerings to streamline food preparation.
❑ Implement mobile POS systems to prevent bottle necks at register.
❑ Introduce mobile app with food ordering capabilities.
(1) Profit lift based on Oasis’ estimates with input from Bluerock. 38Tokyo Dome’s Hospitality Offerings are Subpar
Tokyo Dome’s hospitality offerings are not consistent with a ‘premium’ stadium experience or world renowned
Japanese hospitality.
Tokyo Dome’s VIP entrance adorned Tokyo Dome’s suite level seats offer Tokyo Dome’s premium lounge
with temporary signs and barricades guests access to a 2,000 yen hot buffet reception desk filled with clutter and
dry erase boards
VIP Entrance Barclays Center The 72 Club at Hard Rock Stadium in AMG Lounge reception desk at the
Miami offers oversized reclining seats Mercedes Benz Stadium in Atlanta
and premium F&B
Source: Bluerock 39Tokyo Dome’s Hospitality Offerings are Subpar cont’d…
Tokyo Dome’s current premium seat offering does not maximize hospitality revenues.
• The Dome’s hospitality offering does not align with international best practice, probably because most of the income
generated from these seats flows to the Giants. It should be possible to invest in the facilities and increase revenue for both
parties.
• There are an estimated 4,400 seats that could be classified as ‘premium seats’. These seats include access to an exclusive
lounge or an F&B component.
• Nearly 50% of the Dome’s seats are classified as ‘premium general admission’ meaning they are well located seats at a higher
price point but only have access to a concourse.
• However, some seats which have access to a premium lounge (e.g. Super Wing seats vs. the Star Seats), are priced lower than
those that only have access to a seat, as their seat location is not considered as good for watching baseball.
• Hospitality offerings at concerts / non-Giants events are currently limited or nonexistent.
Source: Bluerock 40Tokyo Dome’s Hospitality Offerings Need to be Reconfigured
Tokyo Dome’s hospitality offerings would benefit from a number of key changes.
Current Hospitality Offering Suggested Hospitality Offering
Current New
Price Number Revenue Current Price Number Revenue New
Seat Name (¥ mm) of Seats (¥ mm) Offer Suggested Changes (¥ mm) of Seats (¥ mm) Offer
Boxes 2.20 350 770 Premium 2.70 350 945 Premium
Diamond 2.20 150 330 Premium A. Create top level premium lounge 3.00 150 450 Premium
Champions 1.50 300 450 Premium B. Create more lounge space 1.75 300 525 Premium
Star Seats A 1.25 3,000 3,750 Premium B. Create more lounge space 1.75 650 1,138 Premium
Excite 1.36 560 762 Premium GA C. Create party zone area 1.70 560 952 Premium
Royal Wing 1.25 1,000 1,250 Premium D. Update boxes 1.40 1,000 1,400 Premium
Grand Wing 0.99 1,000 985 Premium D. Update boxes 1.20 1,000 1,200 Premium
JCB B Screen 1.10 40 44 Premium 1.20 40 48 Premium
Star Seats B 1.10 2,000 2,200 Premium GA 1.15 4,350 5,003 Premium GA
Super Wing 0.66 1,000 657 Premium D. Update boxes 1.10 1,000 1,100 Premium GA
Aurora 0.95 8,000 7,584 Premium GA 1.04 8,000 8,342 Premium GA
Legends 0.91 100 91 Premium GA 1.00 100 100 Premium GA
Beam 0.48 10,000 4,845 Premium GA 0.50 10,000 4,990 Premium GA
Orange 0.40 200 80 GA 0.41 200 82 GA
Sky 0.37 15,000 5,580 GA 0.38 15,000 5,747 GA
Match Day 0.07 2,300 152 GA 0.07 2,300 156 GA
Standing 0.03 2,000 60 GA 0.03 2,000 62 GA
TOTAL 47,000 29,590 47,000 32,240
Source: Bluerock 41Tokyo Dome’s Hospitality Offerings Need to be Reconfigured
First, Tokyo Dome should carve out the Diamond Boxes and create a top-level premium lounge.
Current Hospitality Offering Suggested Hospitality Offering
Current New
Price Number Revenue Current Price Number Revenue New
Seat Name (¥ mm) of Seats (¥ mm) Offer Suggested Changes (¥ mm) of Seats (¥ mm) Offer
Boxes 2.20 350 770 Premium 2.70 350 945 Premium
Diamond 2.20 150 330 Premium A. Create top level premium lounge 3.00 150 450 Premium
Champions 1.50 300 450 Premium B. Create more lounge space 1.75 300 525 Premium
Star Seats A 1.25 3,000 3,750 Premium B. Create more lounge space 1.75 650 1,138 Premium
Current New
Excite 1.36 560 762 Premium GA C. Create party zone area 1.70 560 952 Premium
Price Number Revenue Current Price Number Revenue New
Royal Wing 1.25 1,000 1,250 Premium D. Update boxes 1.40 1,000 1,400 Premium
Seat Name
Grand Wing(¥ mm) 0.99of Seats
1,000(¥ mm)985 OfferPremium Suggested Changes
D. Update boxes 1.20(¥ mm)1,000of Seats
1,200(¥ mm)
PremiumOffer
Diamond
JCB B Screen 2.20 1.10 150 40 33044 Premium
Premium A. Create top level premium lounge 1.20 3.00 40 150 48 450
PremiumPremium
• Currently,
Star Seats Ball hospitality
1.10 inventory2,200
2,000 is soldPremium
by theGA
Giants. The Dome should negotiate with 1.15the Giants
4,350 to carve
5,003 out the Diamond
Premium GA
Boxes for itself and sell them for Giants matches and concerts / other entertainment events, retaining the associatedGA
Super Wing 0.66 1,000 657 Premium D. Update boxes 1.10 1,000 1,100 Premium revenue.
Aurora 0.95 8,000 7,584 Premium GA 1.04 8,000 8,342 Premium GA
• Tokyo Dome should create a top-level premium lounge using the Diamond Box seats for 150 guests, with private dining tables
Legends 0.91 100 91 Premium GA 1.00 100 100 Premium GA
and areas
Beam
that clients
0.48
can buy
10,000
annually.
4,845 Premium GA 0.50 10,000 4,990 Premium GA
• This should be sold
Orange 0.40 as an200
inclusive80packageGA with top quality, restaurant style dining inclusive
0.41 in the 200 price.82 GA
• This
Sky should be sold 0.37 as an annual 5,580
15,000 productGAto allow clients to use the invites strategically0.38as a business
15,000 tool.
5,747 GA
• This kind
Match Dayof package
0.07 in a2,300
US / UK venue
152 would be priced at around $28k per person per0.07
GA year (JPY 3mm)156
2,300 whichGAis about 35%
Standing 0.03 2,000 60 GA 0.03
more expensive than the current Diamond Box available for the Giants matches. This becomes the new top-tier 2,000 62 GA product and all
TOTAL 47,000 29,590
pricing and offers cascade from this point. 47,000 32,240
• A lounge of this size in a UK / US venue would cost around $1-2mm (100-200m JPY) to fit out.
• This will result in 450mm JPY of incremental annual revenue for Tokyo Dome, before considering additional revenue that could
be earned from catering (accounted for in the F&B increase).
Source: Bluerock 42Tokyo Dome’s Hospitality Offerings Need to be Reconfigured
Second, Tokyo Dome should create more lounge space for the current Champions and Star Seat A products.
Current Hospitality Offering Suggested Hospitality Offering
Current New
Price Number Revenue Current Price Number Revenue New
Seat Name (¥ mm) of Seats (¥ mm) Offer Suggested Changes (¥ mm) of Seats (¥ mm) Offer
Boxes 2.20 350 770 Premium 2.70 350 945 Premium
Diamond 2.20 150 330 Premium A. Create top level premium lounge 3.00 150 450 Premium
Champions 1.50 300 450 Premium B. Create more lounge space 1.75 300 525 Premium
Star Seats A 1.25 3,000 3,750 Premium B. Create more lounge space 1.75 650 1,138 Premium
Excite 1.36 560 762 Premium GA C. Create party zone area 1.70 560 952 Premium
Royal Wing Current 1.25 1,000 1,250 Premium D. Update boxes 1.40 New 1,000 1,400 Premium
Grand Wing Price 0.99Number 1,000Revenue
985 Current
Premium D. Update boxes 1.20 Price1,000 Number1,200Revenue
PremiumNew
Seat Name
JCB B Screen(¥ mm)1.10of Seats40 (¥ mm)44 Offer Premium Suggested Changes 1.20(¥ mm) 40of Seats48 (¥ mm)PremiumOffer
Champions
Star Seats B 1.50 1.10 3002,000 450
2,200 Premium
Premium GA B. Create more lounge space 1.15 1.75 4,350 3005,003 Premium
525 Premium
GA
Super
Star Seats A Wing 1.25 0.66 1,000
3,000 657 Premium
3,750 Premium D. Update boxes
B. Create more lounge space 1.10 1.75 1,000 6501,100 Premium GA
1,138 Premium
Aurora 0.95 8,000 7,584 Premium GA 1.04 8,000 8,342 Premium GA
• Tokyo
Legends
Dome should 0.91 create100for lounge
91 space
Premium
for GA
the current champions and Star Seat A 1.00products, 100for a capacity
100 Premium GA 950
of about
Beam 0.48 10,000 4,845 Premium GA 0.50 10,000 4,990 Premium GA
people.
Orange 0.40 200 80 GA 0.41 200 82 GA
• ThisSky
should include 0.37
some elements
15,000
of F&B and the ability to upgrade and add on elements
5,580 GA 0.38
– such
15,000
as sit-down
5,747 GA
dining.
• This would
Match Day be marketed
0.07 to smaller
2,300 152businesses
GA and wealthy individuals. 0.07 2,300 156 GA
• The remaining Star
Standing 0.03 Seats2,000
(Star Seats
60 B) could
GA then remain as Premium GA with access 0.03 to an improved
2,000 concourse.
62 GA
• Typically,
TOTAL a lounge of this size would
47,000 29,590cost around $2m (200mm JPY) to fit out. 47,000 32,240
• This will result in 266mm JPY of incremental annual revenue for the Tokyo Giants.
Source: Bluerock 43Tokyo Dome’s Hospitality Offerings Need to be Reconfigured
Third, Tokyo Dome should create a social zone where fans can enjoy food and drinks while watching the game.
Current Hospitality Offering Suggested Hospitality Offering
Current New
Price Number Revenue Current Price Number Revenue New
Seat Name (¥ mm) of Seats (¥ mm) Offer Suggested Changes (¥ mm) of Seats (¥ mm) Offer
Boxes 2.20 350 770 Premium 2.70 350 945 Premium
Diamond 2.20 150 330 Premium A. Create top level premium lounge 3.00 150 450 Premium
Champions 1.50 300 450 Premium B. Create more lounge space 1.75 300 525 Premium
Star Seats A 1.25 3,000 3,750 Premium B. Create more lounge space 1.75 650 1,138 Premium
Excite 1.36 560 762 Premium GA C. Create party zone area 1.70 560 952 Premium
Royal Wing 1.25 1,000 1,250 Premium D. Update boxes 1.40 1,000 1,400 Premium
Grand WingCurrent0.99 1,000 985 Premium D. Update boxes 1.20 New 1,000 1,200 Premium
JCB B ScreenPrice 1.10Number 40 Revenue 44 Current
Premium 1.20 Price 40Number48 Revenue
PremiumNew
Star Seats B 1.10 2,000 2,200 Premium GA 1.15 4,350 5,003 Premium GA
Seat Name (¥ mm) of Seats (¥ mm) Offer Suggested Changes (¥ mm) of Seats (¥ mm) Offer
Super Wing 0.66 1,000 657 Premium D. Update boxes 1.10 1,000 1,100 Premium GA
Excite Aurora 1.36 0.95 5608,000 762 Premium GA C. Create party zone area
7,584 Premium GA 1.04
1.70 8,000 5608,342 952 Premium
Premium GA
• A Legends
key trend in US0.91 baseball100is to create
91 social
Premium GA where fans can enjoy food and drinks
areas 1.00 100
while watching 100 Premium GA
the match.
BeamDome should
• Tokyo 0.48 create
10,000 4,845
a party zone Premium GA a view of the game for an entry level0.50
area with premium 10,000 4,990
product Premium
as an GA to the
upgrade
Orange 0.40 200 80 GA 0.41 200 82 GA
Excite seats.
Sky 0.37 15,000 5,580 GA 0.38 15,000 5,747 GA
• Typically,
Match Dayconstruction
0.07 of2,300
an area 152
like this
GAwould cost around $3m (300mm JPY). 0.07 2,300 156 GA
• This will result in0.03
Standing 190mm2,000JPY of incremental
60 GA annual revenue for the Tokyo Giants. 0.03 2,000 62 GA
TOTAL 47,000 29,590 47,000 32,240
Source: Bluerock 44Tokyo Dome’s Hospitality Offerings Need to be Reconfigured
Fourth, Tokyo Dome should update the boxes at the Royal, Grand, and Super Wing seats and look to create food
inclusive packages.
Current Hospitality Offering Suggested Hospitality Offering
Current New
Price Number Revenue Current Price Number Revenue New
Seat Name (¥ mm) of Seats (¥ mm) Offer Suggested Changes (¥ mm) of Seats (¥ mm) Offer
Boxes 2.20 350 770 Premium 2.70 350 945 Premium
Diamond 2.20 150 330 Premium A. Create top level premium lounge 3.00 150 450 Premium
Champions 1.50 300 450 Premium B. Create more lounge space 1.75 300 525 Premium
Star Seats A 1.25 3,000 3,750 Premium B. Create more lounge space 1.75 650 1,138 Premium
Excite 1.36 560 762 Premium GA C. Create party zone area 1.70 560 952 Premium
Royal Wing 1.25 1,000 1,250 Premium D. Update boxes 1.40 1,000 1,400 Premium
Grand Wing 0.99 1,000 985 Premium D. Update boxes 1.20 1,000 1,200 Premium
JCB B Screen 1.10 40 44 Premium 1.20 40 48 Premium
Current New
Star Seats B 1.10 2,000 2,200 Premium GA 1.15 4,350 5,003 Premium GA
Super Wing
Price0.66Number 1,000
Revenue
657
Current
Premium D. Update boxes 1.10
Price1,000
Number Revenue New
1,100 Premium GA
Seat Name
Aurora (¥ mm) 0.95of Seats
8,000 (¥ mm) Offer
7,584 Premium GA Suggested Changes (¥
1.04 mm) of
8,000 Seats
8,342(¥ mm)
PremiumOffer
GA
Royal Wing
Legends 1.25 0.91 1,000 100 1,250
91 Premium
Premium GA D. Update boxes 1.00 1.40 100 1,000100 1,400 PremiumPremium
GA
Grand Beam
Wing 0.99 0.48 1,000
10,000 985 Premium
4,845 Premium GA D. Update boxes 0.50 1.2010,000 1,000 1,200 Premium
4,990 Premium GA
Super Orange
Wing 0.66 0.40 1,000 200 65780 Premium
GA D. Update boxes 0.41 1.10 200 1,00082 GA
1,100 Premium GA
Sky 0.37 15,000 5,580 GA 0.38 15,000 5,747 GA
• Tokyo Dome should update the boxes at the Royal, Grand and Super Wing seats which have access to lounges and look to
Match Day 0.07 2,300 152 GA 0.07 2,300 156 GA
create food inclusive
Standing 0.03
packages
2,000
which
60
create
GA
guaranteed revenues for the catering partner.
0.03 2,000 62 GA
• The menus should change
TOTAL from 29,590
47,000 event to event in terms of the food and the choice of a sit-down meal,32,240
47,000 buffet, or finger food
according to the profile of the event and its guests.
• This will result it 808mm JPY of incremental annual revenue for the Tokyo Giants.
Source: Bluerock 45Upside Potential from Hospitality Reconfiguration
Tokyo Dome’s management should reconfigure its hospitality offering. This will result in an estimated 0.4Bn yen lift in
2021 profits1.
Management Check List
❑ Management should work together with the Giants to formulate a vision for the upgrade of its hospitality offerings.
❑ The upgrade should reflect the Giants top-tier image and be in line with offerings at world-class stadiums.
❑ Management must alter its premium mix and offerings:
❑ Carve out the Diamond Boxes and create a top-level premium lounge.
❑ Create more lounge space for the current Champions and Star Seat A products.
❑ Create a social zone where fans can enjoy food and drinks while watching the game.
❑ Update the boxes at the Royal, Grand, and Super Wing seats and look to create food inclusive packages.
❑ Management should create packages for sale at concerts and other events which currently have limited hospitality offerings.
(1) Profit lift based on Oasis’ estimates with input from Bluerock. 46Tokyo Dome’s Current Event Mix Does Not Maximize Profit
Despite having high usage rates, the Tokyo Dome misses out on revenue opportunities due to a suboptimal event
calendar.
Event Mix Considerations Current Event Mix (Year Ending January 2019)
Estimated
• The total number of events held at Tokyo Dome is high Event Total Average
for a ballpark and is similar to a successful indoor Type Events Attendance Attendance Comments
arena such as the O2 in London (211 events in 2018),
Professional Source: Nippon Baseball
or Madison Square Gardens in New York 64 2,829,152 44,206
baseball Association (NBA)
(approximately 320 events per year).
• For a venue with a full calendar like Tokyo Dome, the Source: NBA for 14 events.
type of event is an important consideration in Other Assumed average for Major
29 1,033,569 35,640
maximizing revenue. baseball League clubs at the Tokyo Dome
for the missing 15 events
• The level of secondary spend on F&B, merchandise, 2019 attendance data used for 4
and hospitality will vary across types of event due to Other events accounting for 33 days.
44 1,393,333 31,667
popularity, attendance and demographics of events Assumed average attendance
attendees. for the missing 11 events
Attendance calculated to match
• The profile of events can also help drive sponsorship
Concerts 76 4,064,000 53,474 total attendance declared by
and advertising values and improve the brand image of management
the venue.
Total 213 9,321,000 43,761
Source: NPB, Company filings, Bluerock 47Event Mix Should be Altered To Maximize Profit
Based on an analysis of value contribution by event type, ‘other events’ and ‘other baseball events’ should be
substituted with higher margin concerts or new events such as E-Sports to maximize profits.
Illustrative Value Contribution by Event Type
F&B / Merchandise Hospitality Advertising Costs
Event Type Attendance Spend Spend Value (i.e. Utilities)
Professional baseball 30.4% High Medium / High High Medium
Other baseball 11.1% Low Very Low Low Medium
Other events 14.9% Low Very Low Very Low Low
Concerts 43.6% Medium Low Low High
Source: Company filings, Bluerock 48Upside Potential from Event Calendar Optimization
Tokyo Dome should optimize its event calendar which will lead to increased profitability from advertising, F&B, and
hospitality.
Management Check List
❑ Management must understand which events are most profitable and consider this when developing their booking policy.
❑ Management must conduct a thorough historical analysis of secondary spend by event category and sub-category to
understand optimal F&B, merchandise, and hospitality offerings for future events.
❑ Management should incorporate the results of their findings into future event planning.
❑ The Dome must be operationally and commercially flexible enough to capture all income from secondary spend.
49III. Hotel
50Tokyo Dome Hotel Overview
The Tokyo Dome Hotel is a large hotel located in the Tokyo Dome City complex in central Tokyo.
Financial Overview
• The Tokyo Dome Hotel was opened in June 2000.
• The hotel is 43 stories tall and contains 978 guest (in ¥ mm) 2015 2016 2017 2018 2019
rooms and 28 suites. Total Sales 13,280 13,880 14,049 13,656 13,516
Growth 4.5% 1.2% -2.8% -1.0%
• The hotel is located in the Tokyo Dome City complex Occupancy 90.5% 91.6% 89.1% 86.0% 88.3%
(although its financial performance is not included in Total Number of Guests 528 539 528 501 528
Tokyo Dome City in the Company’s financials) with Banquets Hosted 2,182 2,236 2,190 2,188 2,120
easy access to a number of Tokyo Metro Lines. Growth 2.5% -2.1% -0.1% -3.1%
• The hotel offers ten different restaurants, a variety of
banquet rooms and an outdoor pool.
• The hotel is internally managed by Tokyo Dome
Corporation.
Note: Financial overview as presented by Company. Company does not provide additional
breakdown of sales.
51
Source: Company filingsTokyo Hotels Have Witnessed Growth
Based on STR data, Tokyo hotels have experienced solid growth over the last five years.
Tokyo Hotel Revenues Grew at a 7.8% CAGR Tokyo ADRs Grew at a 6.1% CAGR
110 22,000
100 20,000
Hotel Revenue (¥ Bn)
Average Daily Rate (¥)
90 18,000
80 16,000
70 14,000
2013 2014 2015 2016 2017 2018 2013 2014 2015 2016 2017 2018
Note: STR hotel data set includes Upscale and Upper Upscale Class hotels located in Tokyo that have 400 or more guest rooms.
Source: STR 52Yet, Tokyo Dome Hotel Has Failed to Capitalize
Tokyo Dome discloses very few metrics about its hotel to investors. Available metrics demonstrate that the hotel’s
performance has been stagnant.
Tokyo Dome Hotel’s Revenues Grew at a 0.2% CAGR Tokyo Dome Hotel’s Banquets Business is in Decline
14,100 2,350
14,000
2,300
13,900
Total Hotel Revenue (¥ mm)
13,800
Total Banquets Hosted
2,250
13,700
13,600
2,200
13,500
13,400
2,150
13,300
13,200 2,100
2014 2015 2016 2017 2018 2019 2014 2015 2016 2017 2018 2019
Note: Financials based on fiscal year ending 1/31.
53
Source: Company filingsYou can also read