A COMPARATIVE ANALYSIS OF THE E-GOVERNMENT DEVELOPMENT INDEX (EGDI)
←
→
Page content transcription
If your browser does not render page correctly, please read the page content below
International Conferences ICT, Society, and Human Beings 2021;
                                                                       Web Based Communities and Social Media 2021;
                                                                                                     and e-Health 2021

 A COMPARATIVE ANALYSIS OF THE E-GOVERNMENT
          DEVELOPMENT INDEX (EGDI)

                                                 Eltahir F. Kabbar
                                School of Computing, Electrical and Applied Technology
                                            Unitec Institute of Technology
                                               Auckland, New Zealand

ABSTRACT
During the past two decades, the United Nations Department of Economic and Social Affairs (UN DESA) published
series of reports. Each report presents global survey results that measure e-government development in the 193 UN
Member States. The surveys are intended to periodically assess e-government development progress in each of the UN
Member States. One of the critical e-government development indicators used in these reports is the E-Government
Development Index (EGDI). This quantitative study compares and contrasts the EGDI results (and its principal
components indicators) during the past ten years.
The study compares the recent two e-government survey results (2018 and 2020) with the (2008 and 2010) results using
correlations analysis and cluster analysis. The comparison is performed to achieve two main objectives: first, to measure
the degree of EGDI indicators association during the past ten years and detect any significant changes in the overall
Member States ranking during the same period. Second, to measure the degree of variation in cluster memberships. The
study results show that there is a strong correlation between EGDI scores during the study period. Also, the results show
minor changes in cluster membership, indicating that despite the apparent EGDI overall improvements for almost every
UN Member State, the situation remains as before. The finds of this study will be of interest to both e-government
academics and practitioners.

KEYWORDS
E-government, EGDI, United Nations, Online Government Services

1. INTRODUCTION
Internet technologies are used to provide a broad variety of online resources, ranging from simple educational
websites to advanced platforms for managing communications within government agencies and between
government agencies, individuals, and firms (Janowski, 2015; Sivarajah, Irani, & Weerakkody, 2015). The
World Bank (2006) states that the primary aim of e-government is to fundamentally alter government
relations with individuals, corporations, and other government entities. Many counties are working towards
achieving such a transformative relationship with their citizens by introducing new e-government initiatives
regularly (Eggers, W. D., & Bellman, J. (2015); OECD. (2016); Di Maio, A., & Howard, R. (2017);
Gil-Garcia, J. R., Helbig, N., & Ojo, A. (2014); Williams, M., & Valayer, C. (2018)). The United Nations
produces one of the well-publicized global periodical reports which monitor e-government development
progress worldwide. The report is based on measuring e-government developments using a UN
E-Government Development Index (EGDI) (UN 2016). The High-Level Panel on Digital Cooperation, which
the UN Secretary-General convened in July 2018 to advance proposals to improve digital cooperation among
governments, and other relevant stakeholders, has emphasized the importance of the EGDI. The panel
recognized the E-Government Survey as a key ranking, mapping, and measuring tool, supporting the digital
transformation of countries.
    The EGDI metric is made up of three different parts. First, the Online Service Index (OSI) assesses the
maturity of a country's e-government websites, including its national website and related portals, and related
websites from departments such as education, labor, social services, and health economy, and the
environment. Second, the Telecommunication Infrastructure Index (TII) assigns a ranking to a country's
telecommunications infrastructure based on five factors: Internet customers, fixed telephone lines,

                                                                                                                      23
ISBN: 978-989-8704-30-6 © 2021

smartphone subscribers, fixed Internet subscriptions, and fixed broadband services. Finally, the Human
Capital Index (HCI) is measured using adult literacy levels and education enrollment in a region. In addition,
the UN created an e-participation index (EPI) as a supplementary index to the UN E-Government Survey.
EPI broadens the scope of the survey by concentrating on the use of online resources to help governments
provide information to people. It focuses on three elements: (1) E-information: Enabling citizen engagement
by supplying public information and access to information on demand, (2) E-consultation: Involving people
in feedback to and deliberation on public policies and services, and (3) E-decision-making: Empowering
citizens by co-designing some policy options and co-producing services. Thus the EGDI and its main
components are geared not only to measure the maturity of a country's e-government services but also the
capacity of Member States to deliver online services both in terms of the telecommunications infrastructure
and the skills required by citizens to engage with the online services offered.
    This quantitative study investigates the level of changes that counties participated in the United Nations
e-government survey experienced during the last decade using correlation analysis and cluster analysis. The
EGDI score data (and its principal components) was used in this investigation.

2. THE EGDI IN THE LITERATURE
Different scholars and government officials increasingly use the EGDI and its three components in a variety
of contexts. The indices scores and ranking positions benchmark/compare and set ranking improvement
targets even in some cases. For example, the Ministry of Telecom and Mass Communication of the Russian
Federation used the UN EGDI to benchmark Russia's e-government development against other countries in
the region and beyond (Ministry of Communications of Russia, 2017; Sukhankin (2017. Further, in Greece,
the country's EGDI score and ranking position was used to show how Greece "lags" behind its neighboring
EU counterparts (Zafiropoulos et al., 2012). In addition, several Middle Eastern countries often quote their
ranking positions to demonstrate how they have improved from their previous lower ranking or aim at set
ranking positions to aspire to achieve a better ranking (KSA National Transformation Plan (2016); Ducass
(2017)).
    Another context in which EGDI was used is related to examining the impact of e-government
development on government corruption from an economic perspective Máchová; Volejníková; Lněnička,
(2018). In addition, the EGDI was also used to measure the impacts of e-government on the shadow economy
(Rohman and Veiga, 2017) and the impacts of national culture on e-government development (Zhao, 2011).
    Despite the EGDI's undeniable popularity and ranking systems, some academics have expressed
reservations about the methodology used to assess e-government growth using the EGDI. Whitmore (2012),
for example, argues that the EGDI's calculation should be modified and suggests that factor analysis be used
to ensure that the index accurately calculates what it is meant to measure. Kabbar and Dell (2013) proposed a
revised EGDI called E-Government Development by GDP (EGDGDP) that incorporates the Gross Domestic
Product (GDP). They argue that the adjusted EGDGDP provides a better assessment of the countries'
e-government development because it measures a country's performance relative to what would be expected
of that country according to its GDP rather than the absolute measure currently to each country.
    The EGDI's widespread usage and success, as well as its vocal detractors, prompted this investigation.
The aim of the study and the research methods used in this investigation are described in the following
section.

3. RESEARCH METHODS
To meet the research objectives, first, Pearson Product-Moment correlation analysis was conducted using
four datasets, 2008, 2010, 2018, and 2020 surveys dataset (UN, 2008; UN, 2010; UN, 2018; UN, 2020).
These four datasets were used to enable the researcher to gauge the level of EGDI correlation using two
intervals (2008-2010) and (2018-2020) with a ten-year duration. The correlation analysis was performed
using SPSS version 24 to detect and measure the association between the indices scores during the study
period. Second, to fully explain the correlation analysis results, the study used the Cluster Analytical method,

24
International Conferences ICT, Society, and Human Beings 2021;
Web Based Communities and Social Media 2021;
and e-Health 2021
which allowed the researcher to identify hidden patterns and natural groupings (segments) in the dataset that
would have otherwise not been identifiable (Punj and Stewart, 1983; IBM, 2017).
The results of both the correlation and cluster analysis are described in the next section.
4. ANALYSIS, RESULTS, AND DISCUSSION
Using 2008, 2010, 2018, and 2020 UN survey datasets, the Pearson Product-Moment correlation analysis
results showed a strong positive correlation between all corresponding e-government indices, as shown in
Table 1. The results show that correlating the 2008 EGDI with the related 2010, 2018, and 2020 EGDI scores
produces strong R2 (0.9680, 0.8670, and 0.8720, respectively). Similar results were obtained when the EGDI
principal components were correlated with each other during the same period (see Table 1 for the detailed
correlation scores).
Table 1. Correlation Results for E-Government Development Indices
EGDI Correlation Results
2008 2010 2018 2020
EGDI 2008 Pearson Correlation 1 .968** .867** .872**
N = 192 Sig. (2-tailed) .000 .000 .000
EGDI 2010 Pearson Correlation .968** 1 .876** .875**
N = 192 Sig. (2-tailed) .000 .000 .000
EGDI 2018 Pearson Correlation .867** .876** 1 .980**
N = 193 Sig. (2-tailed) .000 .000 .000
EGDI 2020 Pearson Correlation .872** .875** .980** 1
N = 193 Sig. (2-tailed) .000 .000 .000
OSI Correlation Results
OSI 2008 Pearson Correlation 1 .873** .826** .833**
N = 192 Sig. (2-tailed) .000 .000 .000
OSI 2010 Pearson Correlation .873** 1 .797** .790**
N = 192 Sig. (2-tailed) .000 .000 .000
OSI 2018 Pearson Correlation .826** .797** 1 .924**
N = 193 Sig. (2-tailed) .000 .000 .000
OSI 2020 Pearson Correlation .833** .790** .924** 1
N = 193 Sig. (2-tailed) .000 .000 .000
TII Correlation Results
TII 2008 Pearson Correlation 1 .971** .882** .824**
N = 191 Sig. (2-tailed) .000 .000 .000
TII 2010 Pearson Correlation .971** 1 .911** .851**
N = 189 Sig. (2-tailed) .000 .000 .000
TII 2018 Pearson Correlation .882** .911** 1 .958**
N = 193 Sig. (2-tailed) .000 .000 .000
TII 2020 Pearson Correlation .824** .851** .958** 1
N = 193 Sig. (2-tailed) .000 .000 .000
HCI Correlation Results
HCI 2008 Pearson Correlation 1 .994** .947** .940**
N = 182 Sig. (2-tailed) .000 .000 .000
HCI 2010 Pearson Correlation .994** 1 .946** .938**
N = 183 Sig. (2-tailed) .000 .000 .000
HCI 2018 Pearson Correlation .947** .946** 1 .990**
N = 193 Sig. (2-tailed) .000 .000 .000
HCI 2020 Pearson Correlation .940** .938** .990** 1
N = 193 Sig. (2-tailed) .000 .000 .000
25ISBN: 978-989-8704-30-6 © 2021
EPI Correlation Results
EPI 2008 Pearson Correlation 1 .744** .580** .578**
N = 192 Sig. (2-tailed) .000 .000 .000
EPI 2010 Pearson Correlation .744** 1 .677** .683**
N = 192 Sig. (2-tailed) .000 .000 .000
EPI 2018 Pearson Correlation .580** .677** 1 .906**
N = 193 Sig. (2-tailed) .000 .000 .000
EPI 2020 Pearson Correlation .578** .683** .906** 1
N = 193 Sig. (2-tailed) .000 .000 .000
**. Correlation is significant at the 0.01 level (2-tailed).
A two-step cluster analysis method was performed to understand the correlation analysis results better.
The researcher used SPSS 24.0 to segment the 2008-2010 and the 2018-2020 datasets. The clusters obtained
using these datasets were built using the EGDI index score for each country as the input variables. In
addition, all of the EGDI sub-components (OSI, TII, and HCI) and the EPI were used as the evaluation fields.
The model summary for both periods presented in Figure 1 and Figure 2 shows that the solutions obtained by
SPSS were adequate. The silhouette measure of cohesion and separation measure, the cluster size results, and
the ratio of sizes of the largest cluster to the smallest cluster are acceptable, and no single factor is
predominant.
The 2008-2010 and 2018-2020 cluster analysis results reveal that the datasets are naturally grouped into
four distinct segments. The countries with very high to high EGDI scores fall in cluster 3 and cluster 4,
representing 22.4% and 38.5% of the participating countries, followed by the middle and low EGDI
countries, which fall in cluster 2 and cluster 1 and represents 33.3% and 5.7% of the participating countries.
In comparison, the 2018-2020 cluster analysis results show that cluster 3 and 4 represents 31.3% and
26.0% while cluster 2 and cluster 1 represents 23.4% and 19.3%. The cluster comparison analysis shows that
cluster 1 membership has increased (from 5.7% to 19.3%) in 2018-2020 compared to the cluster size in
2008-2010. This increase in the cluster size indicates that despite the apparent improvement in the EGDI
score of counties in this cluster, these counties are still considered relatively low EGDI compared to other
countries. We argue that with the increased investment in telecommunication infrastructure and improved
online services, countries' EGDI scores are bound to improve continually. Eventually, most counties will be
classified as high to very high EGDI countries. Therefore, instead of relying on a cut-off score classification
system, perhaps a relative cluster-based classification approach is adequate.
Figure 1. Model Summary and Cluster Sizes 2008-2010
26International Conferences ICT, Society, and Human Beings 2021;
Web Based Communities and Social Media 2021;
and e-Health 2021
Figure 2. Model Summary and Cluster Sizes 2018-2020
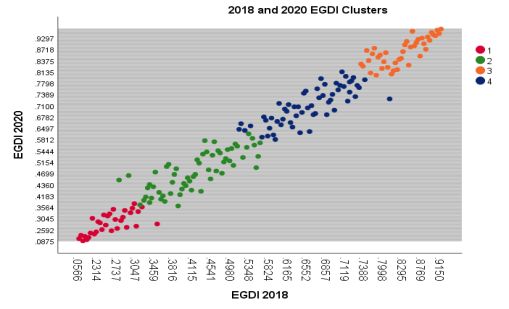
The cluster analysis results also showed that the four clusters' membership distribution in 2008-2010 and
2018-2020 are comparable, as shown in Figure 3. A closer look at the movement of countries between
clusters revealed that the vast majority of countries (66%) in 2018-2020 retained the remained in the same
cluster-group that they belonged to 2008-2010. Only 33% of the studied counties experienced a change in a
cluster in 2018-2020 compared to 2008-2010, and 1% of the countries studied had no cluster classification in
2008-2010.
Figure 3. Cluster Segmentation Using EGDI for 2008-2010 and 2018-2020
The recent United Nations 2020 report showed that Denmark, the Republic of Korea, and Estonia lead the
193 UN Member States regarding the scope and quality of online services, the status of telecommunication
infrastructure, and the existing human capacity. Finland, Australia, Sweden, the United Kingdom, New
Zealand, the United States of America, the Netherlands, Singapore, and Iceland round out the top ten. As
expected, all the top ten counties retained their cluster membership despite minor changes in their rank and
EGDI scores. In contrast, and among the least developed countries (Bhutan, Bangladesh, and Cambodia)
celebrated in the recent United Nations 2020 report as the counties that have become leaders in digital
government development, advancing from the middle to the high EGDI. The cluster analysis conducted in
this study shows that despite the improvement in these counties' ranks and EGDI scores, all three counties
remain in the same cluster they were part of previously, as shown in Table 2.
27ISBN: 978-989-8704-30-6 © 2021
Table 2. Cluster Membership Comparison of Selected Developed and Developing Countries
Country Rank and EGDI Score Cluster Membership
2008 2010 2018 2020 2008-2010 2018-2020
Denmark Rank 2 7 1 1
3 3
EGDI 0.9134 0.7872 0.9150 0.9758
Republic of Rank 6 1 3 2
3 3
Korea EGDI 0.8317 0.8785 0.9010 0.9560
Estonia Rank 7 20 16 3
3 3
EGDI 0.7600 0.6965 0.8486 0.9473
Rank 142 134 115 119
Bangladesh 2 2
EGDI 0.2936 0.3028 0.4862 0.5189
Rank 134 152 126 103
Bhutan 2 2
EGDI 0.3074 0.2598 0.4274 0.5777
Rank 139 140 145 124
Cambodia 2 2
EGDI 0.2989 0.2878 0.3753 0.5113
While the EGDI and its principal components are valuable indicators of how countries worldwide track
e-government development endeavors, the results obtained in this study suggest that the measure can be
tweaked. Perhaps incorporating indicators on the actual usage of e-government services, government
corruption measures, and economic indicators such as GDP into the EGDI provides a more accurate
measurement of e-government development.
5. CONCLUSION
This quantitative study compared the most recent two e-government survey data (2018 and 2020) with the
(2008 and 2010) datasets. The comparison is carried to measure the degree of correlation of the EGDI scores
over the past decade. In addition, the degree of variation in cluster memberships was measured. The findings
of this study suggest that there is a high association between EGDI scores. Furthermore, the results
demonstrate minor changes in cluster membership for most countries studied over the last decade. Despite
the popularity of the EGDI among practitioners, we argue incorporating actual online government services
usage, economic indicators, and government corruption index into each country's EGDI to produced an
adjusted EGDI provides a more accurate measure of e-government development.
REFERENCES
Di Maio, A., & Howard, R. (2017). Introducing the Gartner Digital Government Maturity Model 2.0. Gartner. [Online],
[Retrieved May 25, 2021], https://www.gartner.com/doc/3764382/introducing-gartner-digital-government-maturity
Ducass, A. (2017). 'E-Gov Development in Africa.' The Electronic Journal of e-Government15 (2) pp. 59-62.
Eggers, W. D., & Bellman, J. (2015). The journey to government's digital transformation. Deloitte.
Gil-Garcia, J. R., Helbig, N., & Ojo, A. (2014). Being smart: Emerging technologies and innovation in the public sector.
Government Information Quarterly, 31, I1-I8.
IBM. (2017). TwoStep Cluster Analysis. [Online], [Retrieved May 20,
2021],https://www.ibm.com/support/knowledgecenter/en/SSLVMB_21.0.0/com.ibm.spss.statistics.help/idh_twostep
_main.htm
Janowski, T. (2015). 'Digital government evolution: From transformation to contextualization,' Government Information
Quarterly, 32(3), 221-236.
Kabbar, E.F & Dell, P. (2103). Weaknesses of the E-Government Development Index. In Uesugi, S. (Ed.),IT Enabled
Services. Springer, ISBN: 978-3-7091-1424-7, pp. 111-124.
KSA National Transformation Plan. (2016). National Transformation Plan, [Online], [Retrieved December 07, 2017],
http://vision2030.gov.sa/en/goals
28International Conferences ICT, Society, and Human Beings 2021;
Web Based Communities and Social Media 2021;
and e-Health 2021
Máchová, Renáta; Volejníková, Jolana; Lněnička, Martin (2018): Impact of E-Government Development on the Level of
Corruption: Measuring the Effects of Related Indices in Time and Dimensions, Review of Economic Perspectives,
ISSN 1804-1663, De Gruyter, Warsaw, Vol. 18, Iss. 2, pp. 99-121, http://dx.doi.org/10.2478/revecp-2018-0006
Ministry of Communications of Russia. (2017). [Online] [Retrieved May 25, 2021],
http://minsvyaz.ru/en/activity/statistic/rating/index-razvitiya-elektronnogo-pravitelstva/#tabs|Compare:Place
OECD. (2016). Comparative Studies Report: Digital Government Strategies for Transforming Public Services in the
Welfare Areas. OECD Comparative Study.
Punj, G., & Stewart, D. W. (1983). 'Cluster Analysis in Marketing Research: Review and Suggestions for
Application,' Journal of Marketing Research, 20(2).
Rohman, I; & Veiga, L. (2017). Against the shadow. In: Proceedings of the 18th Annual International Conference on
Digital Government Research. Association for Computing Machinery, New York, NY, USA.
Sivarajah, U., Irani, Z., &Weerakkody, V. (2015). 'Evaluating the use and impact of Web 2.0 technologies in local
government,' Government Information Quarterly, 32(4), pp. 473-487.
Sukhankin, S. (2017). Russia Adopts New Strategy for Development of Information Society. [Online], [Retrieved
December 06, 2017], https://jamestown.org/program/russia-adopts-new-strategy-development-information-society/
UN, 2008. United Nations e-Government Survey 2008: From E-Government to Connected Governance. United Nations,
NY. ISBN 9789211561364. DOI: https://doi.org/10.18356/047afd3a-en
UN, 2010. United Nations e-government survey 2010: Leveraging E-Government at a Time of Financial and Economic
Crisis. United Nations, NY. ISBN 9789210544320. DOI: https://doi.org/10.18356/0e749d15-en
UN, 2018. United Nations e-Government Survey 2018: Gearing E-Government to Support Transformation Towards
Sustainable and Resilient Societies. United Nations, NY. ISBN 9789210472272.
DOI: https://doi.org/10.18356/d54b9179-en
UN, 2020. United Nations e-government survey 2020: Digital Government in the Decade of Action for Sustainable
Development (With addendum on COVID-19 Response). United Nations NY. ISBN 9789210051453.
DOI: https://doi.org/10.18356/8bdf045f-en
Whitmore A, 2012. A statistical analysis of the construction of the United Nations E-Government Development Index,
Government Information Quarterly 29 (1), pp. 68-75.
Williams, M., & Valayer, C. (2018). Digital Government Benchmark Study on Digital Government Transformation.
DG Joint Research Centre, European Commission.
World Bank, 2006. A Definition of E-Government,[Online], [Retrieved May 07, 2021],http://web.worldbank.org/
Zafiropoulos K et al., 2012. Assessing the Adoption of e-Government Services by Teachers in Greece, Future Internet,
Vol. 4, No. 4, pp 528-544.
Zhao, F. (2011). Impact of national culture on e‐government development: a global study, Internet Research, Vol. 21,
No. 3, pp. 362-380. https://doi.org/10.1108/10662241111139354.
29You can also read