A first estimation of tsunami hazard of the Pacific coast of Costa Rica from local and distant seismogenic sources
←
→
Page content transcription
If your browser does not render page correctly, please read the page content below
Ocean Dynamics (2021) 71:793–810
https://doi.org/10.1007/s10236-021-01467-8

A first estimation of tsunami hazard of the Pacific coast of Costa Rica
from local and distant seismogenic sources
Silvia Chacon-Barrantes 1          &   Isabel Arozarena-Llopis 2

Received: 9 November 2020 / Accepted: 24 May 2021 / Published online: 4 June 2021
# Springer-Verlag GmbH Germany, part of Springer Nature 2021

Abstract
Costa Rica has been affected by several local and distant tsunamis in the past, but the historical information is scarce and
incomplete. Its Pacific coast stretches for over a thousand kilometers, and tsunami hazard has never been evaluated for its full
extent. Numerical modeling of tsunami propagation and inundation is a useful tool to assess tsunami hazard, particularly in cases
with limited historical information available. Here, we perform a first estimation of tsunami hazard for the Pacific coast of Costa
Rica from seismogenic sources, by numerical propagation of 57 local and distant tsunamis to a depth of 20 m. The results of our
study identified tsunami sources that are particularly threatening for Costa Rica and determined locations with higher tsunami
hazard. For the analysis, the Pacific coast of Costa Rica was divided into segments and subsegments based on differences in
continental slope morphology. Subsegments with higher tsunami heights were Southwest Nicoya Peninsula and West Osa
Peninsula, and in a lesser extent North Guanacaste, North Nicoya Peninsula, and Central Pacific. Regions with long and gentle
slopes and narrow continental shelf were affected by higher tsunami waves, due to more efficient tsunami energy transmission to
the shelf and reduced energy loss while traveling through a narrow shelf. On the opposite, steeper continental slopes reflected
most of the tsunami energy, causing smaller tsunami heights nearshore, regardless of the shelf width. Nevertheless, other effects
played a major role, like curved coastlines that focused tsunami energy, wave refraction, interference, and trapped edge waves.
Distant tsunamis dominated the threat, with tsunamis coming from the Tonga-Kermadec and the Colombia-Ecuador Trenches
causing the greatest heights due to directivity, and arrival times of about 15 h and 75 min, respectively. Local tsunamis had short
arrival times but a localized impact, mainly at the shoreline in front of the generation region but were also affected by tsunami
focusing, wave refraction, and edge waves. Outer rise and Osa sources caused the lowest impact within local sources. These
results provide a guide for emergency planners to prioritize coastal locations and tsunami sources for tsunami preparedness
actions and warning protocols.

Keywords Tsunami . Tsunami hazard . Numerical modeling . ComMIT . Middle America Trench

1 Introduction                                                             2013). It has 1228 km of coastline, of which 1016 km is on
                                                                           the Pacific coast and about 200 km on the Caribbean coast
Costa Rica is a major international destination for sun-and-               (Arozarena Llopis et al. 2015).
sand, ecological, and medical tourism (Matarrita-Cascante                     The Middle America Trench (MAT) has narrow coupling
and Brennan 2010; Warf 2010; Van Noorloos 2011; Nost                       zones, fast subduction rates, and well-defined segmentation
                                                                           (Protti et al. 1994; Protti et al. 1995), making the simultaneous
                                                                           rupture of several segments unlikely. Goff et al. (2014) de-
                                                                           fined mega-tsunamis as those with “initial wave height/
Responsible Editor: Christoph Voelker                                      amplitude at source exceeding 100 m / 50 m respectively”.
                                                                           Such mega tsunamis were not regarded as likely to originate
* Silvia Chacon-Barrantes                                                  in Central America in the conclusions of the Experts Meeting
  silviach@una.ac.cr                                                       Tsunami Hazard in Central America: Historical Events and
                                                                           Potential Sources (UNESCO/IOC 2018).
1
    SINAMOT Program, Department of Physics, Universidad Nacional,             However, Costa Rica experiences frequent earthquakes,
    Heredia, Costa Rica                                                    some of which provoke tsunamis, as a consequence of the
2
    Present address: Guisando, Spain                                       interaction of three tectonic plates: the Cocos Plate, the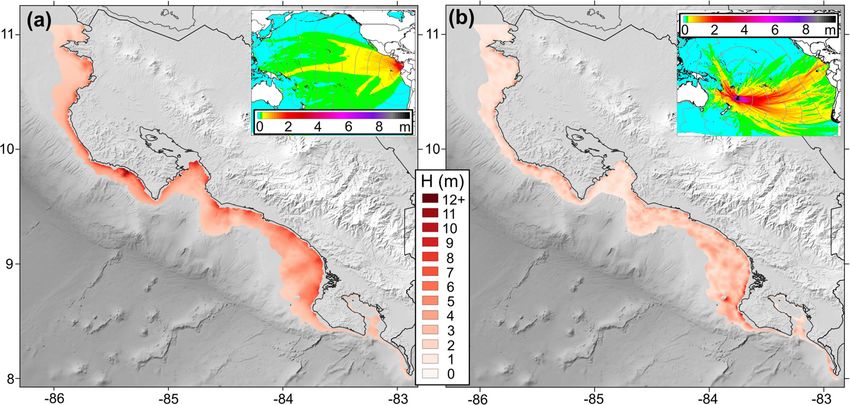
794                                                                                                             Ocean Dynamics (2021) 71:793–810

Caribbean Plate, and the Panama Block. From the 39 tsunamis                    1350 km2 (von Huene et al. 2004), which would imply a
recorded in Costa Rica since 1746, 17 were caused by local                     considerably high tsunami.
earthquakes at either shores, one of which led to at least three                   Along the Pacific coast of Costa Rica, there are 685
deaths on the Caribbean coast (Chacón-Barrantes et al. 2021).                  beaches and 273 towns or cities that are exposed to tsunamis,
There have been no deaths associated to tsunamis on the                        both from near and far field sources. The goal of this work is to
Pacific coast, but runups up to 7.3 m have been observed, with                 get a first estimation of locations with highest earthquake-
the highest occurring during the 1992 Nicaragua Mw = 7.7                       generated tsunami hazard along the Pacific Coast of Costa
and the 1950 Nicoya Mw = 7.8 tsunamis.                                         Rica. This will be done by a deterministic approach of aggre-
   Some tsunamis can cause damage far away from their                          gated scenarios like the one employed by Álvarez-Gómez
source, as happened in Japan and Hawaii with the 1960                          et al. (2013) or Tinti and Armigliato (2003). For this first
Chile tsunami, in Hawaii with the 1964 Alaska tsunami, and                     approach, the distant tsunami sources employed are a combi-
along the Indian Ocean basin with the 2004 Indonesia tsuna-                    nation of pre-calculated unit sources available in the numerical
mi, among others. Distant and local tsunamis have distinct                     model. Seismic sources at the Middle America Trench (MAT)
features such as wavelength and duration. Costa Rica has                       existing in literature are used to model local tsunamis. It will
records of the arrival of 22 distant tsunamis (Chacón-                         be analyzed the interaction of tsunamis with the continental
Barrantes and Gutiérrez-Echeverría 2017; Chacón-Barrantes                      slope and shelf offshore each location, in terms of the segmen-
2018; NOAA/NCEI 2021), whose epicenters are shown in                           tation defined by Harders et al. (2011). The definition of coast-
Fig. 1. Only two of them caused flooding and damages in                        al locations with highest hazard will allow local authorities to
Costa Rica, the 1906 Colombia and the 2011 Japan tsunamis.                     prioritize tsunami preparedness.
Four other tsunamis (2006 Kuriles, 2010 and 2015 Chile, and
2 0 2 1 K e r m a d e c ) c a us e d s t r o n g c oa s t a l c u r r en t s
(NOAA/NCEI 2021), and one more (2009 Samoa) caused                             2 Tsunami interaction with continental
perturbations on sea level witnessed at plain sight (Chacón-                   platform and shelf
Barrantes et al. 2021). The other 15 distant tsunamis were only
recorded by tide gauges.                                                       There are general relationships that can be established be-
   This paper presents a review of tsunami hazard for the                      tween continental platform, continental slope angle and
Costa Rican Pacific coast due to local and distant                             width, and tsunami shoaling. Levin and Nosov (2009) defined
earthquake-generated tsunamis. Analysis of the hazard de-                      the viscous linear dissipation length as “the distance, over
rived from landslide generated tsunamis is beyond the scope                    which the amplitude of a long wave in a viscous liquid be-
of this paper but will be considered in a future study. For                    comes e times smaller”, which is a function of wave frequency
example, von Huene et al. (2004) estimated maximum wave                        and 3/2 power of depth. They also defined the non-linear
height of 27 m above the prehistoric Nicoya Slump (Fig. 2b),                   dissipation length as "the distance along which the wave am-
in the case it slid all at once. Although this maximum wave                    plitude becomes two times smaller” (Levin and Nosov 2009).
height was estimated by equations rather than numerical                        They established this length as a function of depth square and
modeling, the estimated area of the Nicoya Slump is about                      wave amplitude. Once the tsunami reaches the continental

Fig. 1 Historical tsunamis
registered on the Pacific Coast of
Costa Rica (squares and triangles)
(NOAA/NCEI 2021) and hypo-
thetical distant tsunami scenarios
used here. The COMMIT propa-
gation grid at the Pacific Ocean is
shown with a magenta rectangle
Ocean Dynamics (2021) 71:793–810                                                                                                               795

Fig. 2 Study area and zonation. (a) Extent of modeling grids A, B, and C   Dulce Gulf, and 3.4 Punta Burica. Scars of landslides at the shelf break
for model configuration, together with the three segments considered       are included in (b) with dashed lines, as well as Nicoya Slump and other
here: 1. North Nicoya, 2. Seamounts-central, and 3. Cocos Ridge-Osa        possible tsunamigenic slumps according to von Huene et al. (2004).
peninsula. Grid C contains Quepos Tide Gauge (TG in inset). (b)            Reference points are PFZ: Panama Fracture Zone, CZ: Cabo Zapotal,
Subdivision of the study area based on geomorphology: 1.1 North            T: Tamarindo, PG: Punta Guiones, CB: Cabo Blanco, PC: Punta
Guanacaste, 1.2 North Nicoya Peninsula, 1.3 West Nicoya Peninsula,         Cuchillo, PT: Punta Torre, Sv: Savegre, Do: Dominical, To: Tortuga,
2.1 Southwest Nicoya Peninsula, 2.2 Southeast Nicoya Peninsula, 2.3        OP: Osa Peninsula, Ch: Punta Chancha, CM: Cabo Matapalo, PB:
Central Pacific, 3.1 West Osa Peninsula, 3.2 East Osa Peninsula, 3.3       Punta Banco

slope, it behaves non-linearly. Thus, continental shelves are              Caribbean Plate. Six different tectonic-style segments are de-
more efficient on tsunami dissipation than abyssal plains, not             fined for the entire MAT according to Harders et al. (2011).
only because of shallower depths increasing the dissipation                Those segments were defined based on different Cocos plate
length, but also because of the higher power dependency on                 morphologies and continental slope angles and widths
depth for non-linear processes. Consequently, tsunamis trav-               (Table 1), and are not the same as the segments defined by
eling over wider continental platforms will experience higher              Protti et al. (1994, 1995) based on tectonic coupling. The later
dissipation.                                                               was employed to define worst-case scenario seismic sources
   Siva and Behera (2016) performed numerical one-                         by a group of experts that met in 2016 under the leadership of
dimensional experiments of N-waves shoaling over different                 IOC/UNESCO (UNESCO/IOC 2018). These seismic sources
values of continental slope and depth of continental shelf.                are listed in Section 3.3.2.
They found that for continental slopes of less than 11°, a                    The first three tectonic-style segments are located offshore
decrease in slope drives to an increase on wave amplification.             Guatemala, El Salvador, and Nicaragua. For Costa Rica, there
The authors mentioned that “as the continental slope becomes               are three tectonic-style segments of MAT based on the geo-
flatter, more energy is transmitted to the shelf and higher                morphology of the continental slope (Table 1 and Fig. 2a):
tsunami height is observed”. For the two-dimensional prob-                 North Nicoya, Seamounts-Central, and Cocos Ridge-Osa
lem the relationship between continental slope angle and tsu-              Peninsula segments.
nami amplification might not be straightforward.                              This segmentation of the MAT, and thus of the coast,
   In the following Section, we describe the geomorphology                 is based on the evidence of massive landslides along the
of the study area, its segments and subsegments, which will be             continental slope. The presence of those landslide scars
used in the analysis of the tsunami response of each of them               and their characteristics are directly related to
discussed in Section 5.4.                                                  subducting floor roughness (von Huene et al. 2004).
                                                                           They are defined as tectonic erosion processes and dom-
                                                                           inate the convergent margin of the Middle America
3 Study area                                                               Trench (Harders et al. 2011). Evidence for tectonic ero-
                                                                           sion in the Neocene has been found in the Central
The Middle America Trench (MAT) extends from Mexico to                     Costa Rica segment (Ranero and von Huene 2000;
Costa Rica, where the Cocos Plate subducts beneath the                     Vannucchi et al. 2003).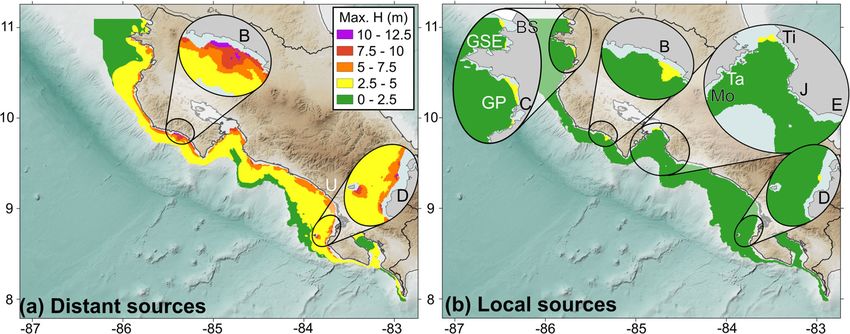
796                                                                                                             Ocean Dynamics (2021) 71:793–810

Table 1 Continental slope width
and dip angle according to         Segment                       Continental slope width (km)              Continental slope dip angle (°)
Harders et al. (2011)
                                                                 Minimum          Maximum       Average    Minimum        Maximum      Average

                                   1. North Nicoya                    52              55            53          4.5           4.7         4.6
                                   2. Seamounts-Central               44              73            56          2.5           4.5         3.5
                                   3. Cocos Ridge-Osa                 6.5             20            8            6            20           8
                                      Peninsula

   Here, we subdivide those three segments in terms of their                slumps, with an average 4–6° dip and a 53-km-wide (low
geomorphology, as detailed in Table 2.                                      variance) slope (Harders et al. 2011) (Table 2 North
   Nicoya Gulf is not in front of the continental slope neither             Guanacaste subsegment).
oriented to the trench. Nicoya Gulf mouth is 16 km wide, and                    It can be divided into three subsegments in terms of its
the gulf is 60 km long. About 14 km inside the Gulf is located              geomorphology. The first is North Guanacaste (1.1, yellow
the San Lucas Island at the western margin and Puntarenas                   in Fig. 2b), characterized by a highly indented coast, with
city in a sandbar at the eastern margin of the Gulf, the distance           peninsulas and bays of varying sizes showing no main orien-
between them is only 5 km. The maximum depth at Nicoya                      tation. The continental shelf in this area is wide, decreasing
Gulf is about 30 m, and its average depth is about 10 m. In this            from north to south, and ranges from 100 km in the northern-
work, the tsunami heights will be analyzed at 20-m depth, due               most end to 35 km in the south. In front of this subsegment,
to the absence of high-resolution coastal bathymetry along                  the Cocos Plate presents a smooth subducting surface, which
most of the coastline. Then, the hazard assessment for the                  is referred to as the Smooth Domain (Denyer and Kussmaul
Nicoya Gulf would require a different approach including                    2012).
the modeling with high-resolution bathymetry, which is not                      The second and smallest subsegment is the North Nicoya
currently available. Therefore, Nicoya Gulf was not included                Peninsula (1.2, light purple in Fig. 2b). It is also very indented,
in this study, but the authors strongly recommend the evalua-               but only at the meso-scale, and is generally clearly north-west
tion of its tsunami hazard particularly for its islands and cities,         oriented. The continental shelf becomes narrower in this area,
like Puntarenas.                                                            also decreasing from north to south, ranging from 35 km in the
                                                                            northern part of the segment to 20 km south of Tamarindo
3.1 North Nicoya segment                                                    bay.
                                                                                The third subsegment is the West Nicoya Peninsula (1.3,
The North Nicoya segment has the softest subducting oceanic                 light green in Fig. 2b), its coastline is the straightest of all
floor in the entire Middle America Trench (Harders et al.                   segments analyzed. The continental shelf in this area is ex-
2011). As a result, its continental slope is mainly straight                tremely narrow, with widths around 8–10 km, and the conti-
and steep and defined by mid and lower slope slides and                     nental slope is the steepest of the entire North Nicoya

Table 2 Continental shelf width of the Costa Rican segments of the Middle America Trench studied, based on Harders et al. (2011). Segments,
subsegments, and reference points are plotted in Fig. 2

Segment                      Subsegment                     Minimum and                    Begins                           Ends
                                                            maximum
                                                            shelf width (km)

1. North Nicoya              1.1 North Guanacaste           35–100                         Nicaragua border                 Cabo Zapotal (CZ)
                             1.2 North Nicoya Peninsula     20–35                          Cabo Zapotal (CZ)                Tamarindo Bay (T)
                             1.3 West Nicoya Peninsula      8–10                           Tamarindo Bay (T)                Punta Guiones (PG)
2. Seamounts-Central         2.1 Southwest Nicoya Peninsula 12–17                          Punta Guiones (PG)               Cabo Blanco (CB)
                             2.2 Southeast Nicoya Peninsula 10–30                          Cabo Blanco (CB)                 Punta Cuchillo (PC)
                             2.3 Central Pacific            20–60                          Punta Torre (PT)                  Playa Tortuga (To)
3. Cocos Ridge-Osa Peninsula 3.1 West Osa Peninsula         4–22                           Left margin of Terraba river (TR) Punta Chancha (Ch)
                             3.2 South Osa Peninsula        2–4                            Punta Chancha (Ch)               Cape Matapalo (CM)
                             3.2 Dulce Gulf                 4–37                           Cape Matapalo (CM)               Punta Banco (PB)
                             3.3 Punta Burica               7–25                           Punta Banco (PB)                 Panamá border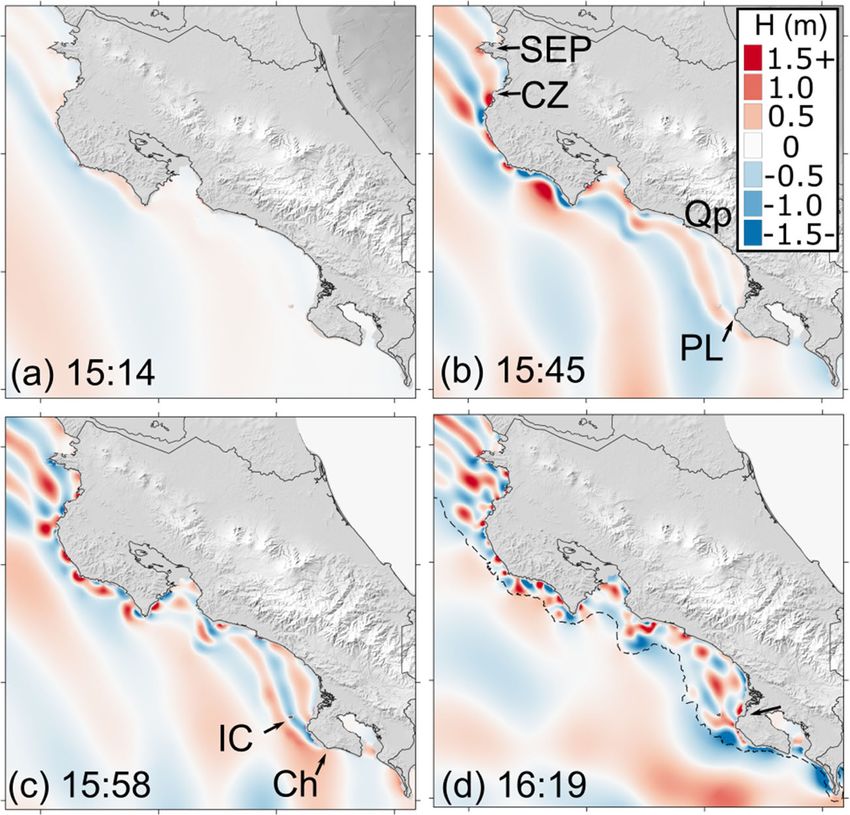
Ocean Dynamics (2021) 71:793–810                                                                                                 797

Segment. Coastal uplift in this area has been documented by         Induni 2007). There is a large landslide scar (von Huene
Fisher et al. (1998), Marshall et al. (2001), and Fisher et al.     et al. 2004) in the shelf break in front of this subsegment
(2004).                                                             (dashed line in Fig. 2b) which lowers its steepness greatly,
   Strong earthquakes (Mw > 7.5) in the Nicoya Peninsula            especially when compared with the North Nicoya segment
occur approximately every 50 years (Protti et al. 2001).            (von Huene et al. 2004; Harders et al. 2011). Coastal morphol-
During the interseismic period, the Caribbean and Cocos             ogy in this area reflects the semicircle of the landslide detach-
plates are coupled, and the failure occurs when the coupling        ment area (Fig. 2b). The northern part of this subsegment is
is overcome (Protti et al. 2010). During the approximately 50       WNW-ESE oriented, with scattered capes and bays, and
years of stress accumulation, the coast of the Nicoya peninsula     surrounded by steep terrains, even in some major bays (e.g.,
undergoes subsidence, and when an earthquake occurs a gen-          Samara Bay, Sa in Fig. 10). In general terms, the southern part
eral coastal uplift is observed (Protti et al. 2010). As a conse-   is open, straight, and NNW-SSE oriented. It is characterized
quence, the Peninsula has several marine terraces and raised        by long sandy beaches and wide coastal plains (B: Bejuco,
platforms (Marshall 2007) indented with large bays like             SM: San Miguel de Jabilla, Cy: Coyote, Ca: Caletas, Pe:
Papagayo and Tamarindo (T in Fig. 10) and pocket beaches            Pencal, M: Manzanillo, all in Fig. 10). Continental shelf width
like Playa Garza (Gr in Fig. 10) and Playa Samara (Sa in Fig.       in this subsegment ranges from 8 to 10 km in the northernmost
10). Uplifted beaches are very common in this segment, espe-        area to as much as 17 km in the south.
cially in the central area between playa Tamarindo and Playa            The Southeast Nicoya Peninsula subsegment (2.2, brown
Ostional (O-N in Fig. 10).                                          in Fig. 2b) is in the province of Puntarenas, which extends
                                                                    southward along the rest of the Costa Rican Pacific Coast. It is
3.2 Seamounts-Central segment                                       SW-NE oriented, as opposed to the general NW-SE trend of
                                                                    the Costa Rican Pacific Coast, alternating sedimentary and
The Seamounts-Central segment extends from Punta Guiones            oceanic volcanic rock outcrops (Denyer and Alvarado-
(PG) to Playa Tortuga (To, on the right margin of the mouth of      Induni 2007) which form very steep coastal slopes. Given
the Térraba river, Fig. 2b), excluding the Gulf of Nicoya.          the orientation of this segment, mostly perpendicular to the
Offshore, and especially from the southernmost part of the          trench, continental shelf width is variable, increasing from
Nicoya Peninsula to the Quepos promontory (Qp in Fig. 2),           south to north (from the outermost part of the peninsula, to
the Cocos plate becomes rough through the rough-smooth              the innermost part), ranging from 8 to 10 km in the south, to
limit in this segment (Lonsdale and Klitgord 1978;                  almost 40 km for the northernmost (innermost) part of this
Meschede and Frisch 1998; Denyer and Kussmaul 2012).                subsegment. Continental slope in this subsegment is also char-
This segment has rotational landslides in its upper slope           acterized by the presence of a massive landslide, which re-
(their scars in the shelf break are shown with dashed lines in      duces considerably the average angle of dip (dashed line in
Fig. 2), whereas rock avalanches and slumps are present in the      Fig. 2b).
mid- and lower slopes (Harders et al. 2011). These landslides           The Central Pacific subsegment (2.3 fuchsia in Fig. 2b)
and slumps were produced by subducting seamounts and de-            shows different combinations of continental slope and shelf
creased the steepness of the continental slope compared to the      morphologies. The continental slope in front of this subseg-
general trend in the Guanacaste area (von Huene et al. 2004).       ment is affected by two massive landslides offshore Herradura
Its average dip slope and width are 3.5° and 56 km, but the         and Quepos (dashed lines in Fig. 2b) that decrease the shelf
width varies from 44 to 73 km (Harders et al. 2011).                width in those places. One of these landslides also affected the
    The Seamounts-Central segment can be divided into three         previous subsegment (Southeast Nicoya Peninsula). The east-
zones: the Southwest Nicoya Peninsula (2.1, orange in Fig.          ern part of this subsegment (close to Playa Tortuga, To in Fig.
2b), the Southeast Nicoya Peninsula (2.2 brown in Fig. 2b),         2b) is characterized by a wide shelf, no landslides, and a very
and the Central Pacific (2.3, fuchsia in Fig. 2b). Since the        short and abrupt continental slope.
southern part of the Nicoya Peninsula is located over the               The Seamounts-Central segment is also geologically and
subducting seamounts of the “rough domain” (Marshall                geomorphologically different from the Nicoya and Cocos
2007), it was not included with the rest of the Peninsula in        Ridge-Osa Peninsula regions. While uplifting in the Nicoya
the first segment. The different Quaternary uplift rates be-        and Osa Peninsula is infrequent but involves large displace-
tween the North and South Nicoya peninsula may be linked            ments, uplifting between those peninsulas involves small but
to differences in subducting plate roughness, dip, and thick-       frequent earthquakes (Von Huene et al. 1995). The coast is
ness (Marshall 2007).                                               characterized by differential Quaternary uplift rates due to
    The Southwest Nicoya Peninsula is morphologically het-          faults perpendicular to the coastline that divide the coast into
erogeneous because of the presence of two geological pat-           several blocks with fluvial and marine terraces (Fisher et al.
terns: one formed by sedimentary rocks, and the other charac-       1994; Fisher et al. 1998; Marshall 2007). As a result, there are
terized by oceanic basalt outcrops (Denyer and Alvarado-            relatively extensive beach systems broken by only two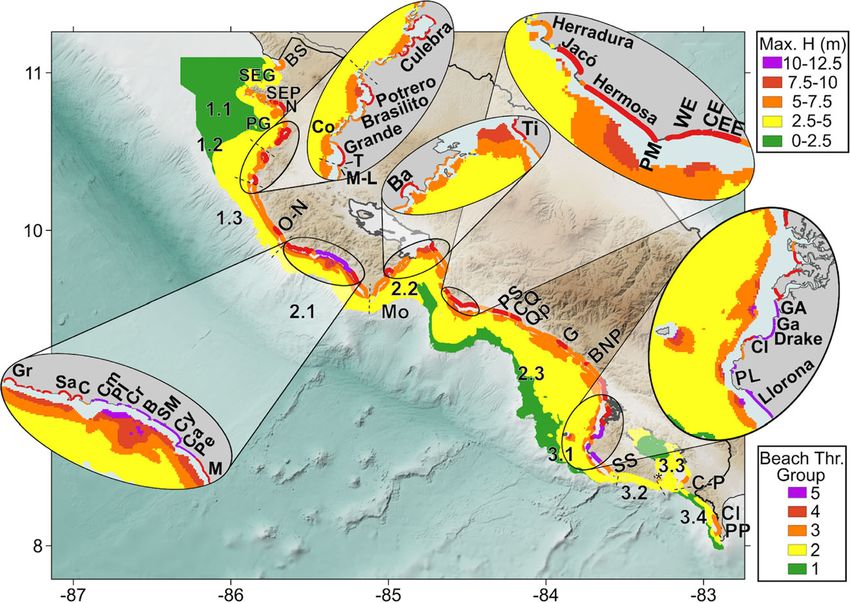
798                                                                                                 Ocean Dynamics (2021) 71:793–810

remarkable rocky promontories (Herradura and Quepos),               4 Methodology
where several small pocket beaches can be found. Wide coast-
al plains flank the shores between Esterillos (WE in Fig. 10)       4.1 Numerical model
and Quepos (Fig. 2b), while steep slopes come closer to the
coast from playa Savegre (Sv in Fig. 2) to the south end of the     ComMIT (PMEL/NOAA 2016) model was used, which is a
segment. Except for the two promontories, no notable rocky          graphical user interface (GUI) for MOST numerical model
outcrops are present in the coastal segment to the south of         (Titov and González 1997). It performs offline nesting be-
Playa Hermosa and the north of Playa Dominical (Do in Fig.          tween three user-defined inundation grids (A, B, and C), and
2). This subsegment extends NW-SE, with very few excep-             its incorporated 4 arc-minute propagation grid covering the
tions such as the Quepos and Herradura (Fig. 2) promontories.       entire Pacific Ocean. ComMIT employs linear shallow water
                                                                    equations in the propagation grid, and non-linear shallow wa-
3.3 Coco’s Ridge-Osa Peninsula                                      ter equations in the inundation grids, which are nested online
                                                                    between them. The seismic source can be defined by a linear
This segment is associated with different continental slope         combination of pre-calculated unit seismic sources or by the
characteristics which have led to the division in four subseg-      simulation of user-defined seismic sources.
ments. The first one, the West Osa Peninsula (3.1, dark red in
Fig. 2b), is associated with a relatively wide continental shelf,   4.2 Model setup
and the absence of major landslides on the continental slope. It
represents a transition area between the Central Costa Rica         The model setup performed by the authors consisted of three
landslides, and the extremely narrow continental slope in front     online nested grids of 60, 12, and 4 arcsec resolutions (Grid A,
of the Osa Peninsula, which is also characterized by landslides     Grid B, and Grid C respectively in Fig. 2a). Grid C covers
(Fig. 2b). The width of the continental shelf decreases from        Quepos bay, which tide gauge has recorded 15 tsunamis (TG
NW to SE, reaching a width of 4 km near to Punta Chancha            in Fig. 2a). The records of the following tsunamis were used
(Ch in Fig. 10), where the next subsegment begins.                  for model verification in Chacón-Barrantes and Gutiérrez-
    The South Osa Peninsula (3.2, dark blue in Fig. 2b) is          Echeverría (2017): 1985 México Mw = 8.0, 1985 México
characterized by the narrowest continental shelf of the whole       Mw = 7.6, 1990 Cóbano (Costa Rica) Mw = 7.0, 2006
Costa Rican Pacific coast, where it hardly reaches 2 km wide        Tonga Mw = 8.0, 2007 Kuriles Mw = 8.1, 2010 Chile Mw
in some points (near Matapalo Cape, * in Fig. 10). This nar-        = 8.8, 2011 Japan Mw = 9.1, 2013 Solomon Islands Mw =
rowness is due in part to the existence of slumps and rock          7.9, 2014 Chile Mw = 8.1, and 2015 Chile Mw = 8.3. In all
avalanches in the lower-middle slope, mainly due to the sub-        cases, the same model setup and grids were employed.
duction of crests owing to the Coco’s Ridge (Harders et al.             The bathymetry of the grids was obtained combining
2011), which have made the shelf break to retreat backwards.        GEBCO-08 data up to a depth of 200 m and digitized nautical
The continental slope of this segment is one of the steepest of     charts for depths less than 200 m. The lack of high-resolution
the entire study area.                                              and updated coastal bathymetry is a major handicap for Costa
    Dulce Gulf mouth is 14 km wide, and the gulf is                 Rica; nonetheless, nautical charts are reliable enough to permit
54 km long divided in 23 and 31-km sections oriented                characterization of hazard nearshore. Local effects, like the
south-north and southeast-northwest, respectively; it is            response of small bays to tsunamis, cannot be analyzed with
characterized by high depths, reaching 100 m in some                this resolution; however, the model allows the inundation of
points. For the Dulce Gulf subsegment (3.3, dark purple             dry land in all grids.
in Fig. 2b), the continental slope is also affected by                  The topography was constructed based on GEBCO-08 da-
massive slumps and avalanches, as the previous subseg-              ta. While coastal LIDAR topographic data up to 1-m resolu-
ment. The slope is narrow and steep with an average                 tion are available, the low resolution of the bathymetric data
width of 8 km and angles of 6–20° (Harders et al.                   available did not justify the use of this data. The LIDAR
2011). The continental shelf is practically inexistent,             topographic data will be used in future work to set up high-
given that the shelf break is almost placed at the gulf             resolution inundation models for selected locations where
mouth.                                                              higher-resolution bathymetric data will be measured directly.
    The last subsegment, Punta Burica (3.4, cyan in Fig. 2b), is        The simulations were carried on for 12 h after tsunamis’
associated with a very narrow continental shelf (almost inex-       first arrivals to account for shelf resonance and trapped waves.
istent) together with steeper continental slope, where no major     The maximum tsunami height was chosen between all the
landslides have been described. Its coastline is mostly straight    seismic scenarios modeled at each node of grid B. These joint
with exception of a cape and a bay south of Puesto La Playa         maximum tsunami heights were used to analyze tsunami in-
(PLP in Fig. 10) This subsegment ends in correspondence to          teraction with the continental slope and platform; only grid
the Panama Fracture Zone, PFZ in Fig. 2 (Denyer et al. 2009).       nodes with depths larger than 20 m were considered due to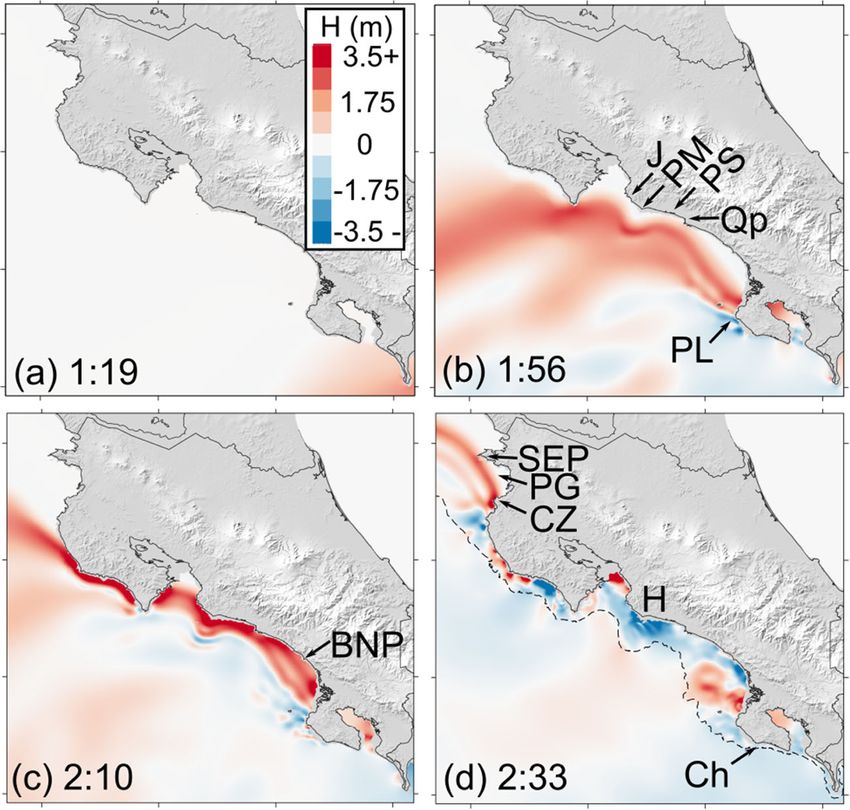
Ocean Dynamics (2021) 71:793–810                                                                                               799

the lack of reliable high-resolution coastal bathymetry. Then,    planning and exercises”. As an outcome of this meeting, four
for each beach, a maximum tsunami height value was                tsunami sources were identified along the Middle America
assigned from the closest nodes.                                  Trench (Fig. 3b) which were considered worst-case scenarios
                                                                  for tsunami sources along the Pacific coast of Central America
4.3 Tsunami sources                                               by over 20 national and international experts attending the
                                                                  meeting. The seismic parameters of the sources are listed in
In this study, we used 57 worst-case scenarios, aggregating       Table 3. More detailed information on the definition of the
them to obtain maximum nearshore tsunami heights like per-        sources can be found in the Experts Meeting’s Report
formed by Álvarez-Gómez et al. (2013) or Tinti and                (UNESCO/IOC 2018). Although the use of such simplified
Armigliato (2003). Worst-case scenarios consist of simplified     sources might seem unrealistic, they were selected to simplify
tsunami sources, characterized by one or more rupture planes      the modeling process and the hazard assessment.
with homogeneous slip, instantaneous and simultaneous rup-           Also, the 16 largest tsunami sources considered in Zamora
tures. Probabilistic or hybrid probabilistic-deterministic ap-    and Babeyko (2015) with Mw ≥ 7.3 and the worst-case sce-
proaches such as Brizuela et al. (2014) and Zamora and            nario given by Álvarez-Gómez et al. (2012) with Mw = 7.9
Babeyko (2020) were not considered here but might be              were simulated here (Table 3 and Fig. 3a) for a total of 21 local
employed in future work.                                          sources. Some of the authors of the mentioned studies partic-
                                                                  ipated in the Experts Meeting or were consulted for the defi-
4.3.1 Distant tsunamis                                            nition of those sources (UNESCO/IOC 2018).

The Pacific Ocean has experienced more tsunamis than any
other ocean basin throughout the period for which data is         5 Results and discussion
available. Around this basin, five regions have generated
earthquakes with Mw≥ 9.0, four of which were recorded by          The values of the maximum tsunami heights given here are
gauges in Costa Rica: 1952 Kamchatka, 1960 Chile, 1964            used only for comparative purposes, as they were calculated at
Alaska, and 2011 Japan (gray triangles in Fig. 1)                 a depth of 20 m. Coastal tsunami heights were not estimated
(NOAA/NCEI 2021). There are not records of effects of the         using Green’s Law, since it is not valid for all the locations
Cascadia tsunami (1700) in Costa Rica, probably due to ener-      along the studied coastline. Each coastal location would re-
gy directivity.                                                   spond differently to the tsunami wave, depending on local
   Therefore, 36 hypothetical earthquakes were used as tsu-       bathymetry and geomorphology, which effects were not con-
nami sources from all around the Pacific Basin with a standard    sidered here.
magnitude of Mw = 9.3 (red and blue fault planes in Fig. 1),
identified as the worst-case scenario, in a similar way as done   5.1 Distant tsunami scenarios and directivity
by Borrero et al. (2015). These hypothetical earthquakes were
originated at the following trenches: Mx: Middle America          Tsunamis from two regions posed the highest hazard for Costa
(offshore Mexico), JF: Juan de Fuca (Cascadia), GA: Gulf          Rica due to the direction of their maximum energy: the Tonga-
of Alaska, Al: Aleutian, Ku: Kuril, Jp: Japan, Nk: Nankai,        Kermadec Trench and South America Trench (Figs. S8, S9,
Bo: Bonin, Ma: Marianas, NH: New Hebrids, TK: Tonga-              and S11). The maximum nearshore tsunami heights for Costa
Kermadec, Ch: Chile, PC: Peru-Chile, and SA: South                Rica were of 12.5 and 12.3 m and were caused respectively by
American. The initial tsunami conditions for all hypothetical     one scenario offshore Colombia (SA2) and one scenario at
scenarios were obtained by linear combinations of pre-            Kermadec Trench (TK4) about 1000 km north-east from
computed unit sources, with homogeneous slip distribution.        New Zealand. These scenarios are shown in Fig. 4a,b together
                                                                  with deep ocean amplitude plots (insets) showing the direc-
4.3.2 Local tsunamis                                              tions of maximum energy. Other sources at Tonga-Kermadec
                                                                  trench, TK1, TK2, TK3, TK5, and TK6, caused maximum
For local tsunami sources were considered only sources            offshore tsunami heights of 4.0, 3.1, 4.6, 1.3, and 2.9 m re-
existing in literature, as the definition of sources was beyond   spectively (Figs. S8 and S9). The other source at the South
the scope of this paper. In June 2016, UNESCO/IOC orga-           American Trench (SA1) caused a maximum offshore tsunami
nized the Experts Meeting “Tsunami Hazards in Central             height of 3.3 m (Fig. S11).
America: Historical Events and Potential Sources”                    These results agreed with historical records of three tsu-
(UNESCO/IOC 2018), with the objective “Identification of          namis originated at the Colombia-Ecuador Trench and three
credible sources of tsunamis that could significantly impact      tsunamis originated at the Tonga-Kermadec Trench that were
the Pacific and Caribbean coasts of Central America and that      recorded in Costa Rica; particularly, the 1906 Colombia tsu-
can be used for tsunami modelling, evacuation mapping,            nami was widely witnessed in the country. On the opposite,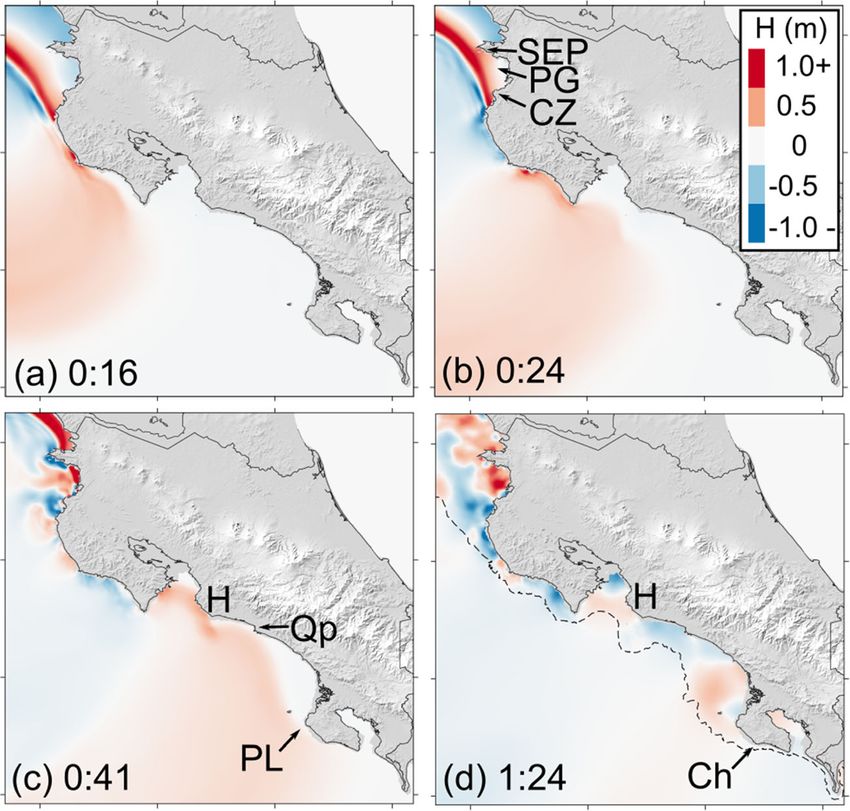
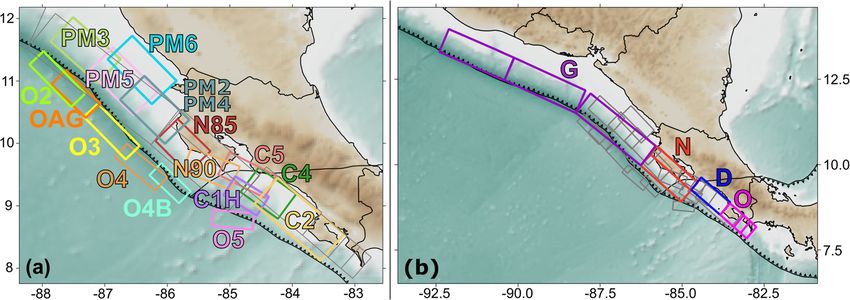
800                                                                                                 Ocean Dynamics (2021) 71:793–810

Table 3   Seismic parameters of the local tsunami sources used

Name          Mw Mo (N*m) Total length (km) Total width (km) Mean slip (m) Rigidity (GPa) Reference

GUANICA       8.6   1.08 × 10²²   769                 80           5.0           35             UNESCO/IOC Experts Meeting (2018)
NICOBANO      8.0   1.46 × 10²¹   180                 83           2.8           35
DOM           7.5   1.92 × 10²⁰   100                 40           1.6           30
OSA           7.6   3.51 × 10²⁰   117                 50           2.0           30
PM2           7.7   4.47 × 10²⁰   111                 61           4.4           15             Zamora and Babeyko (2015)
PM3           7.7   4.49 × 10²⁰   111                 61           2.65          25
PM4           7.7   4.47 × 10²⁰   111                 61           2.2           30
PM5           7.7   4.49 × 10²⁰   111                 61           2.65          25
PM6           7.7   4.49 × 10²⁰   111                 61           2.65          25
C1H           7.3   1.13 × 10²⁰   69                  40           2.05          20
C2            8     1.25 × 10²¹   154                 66           4.1           30
C4            7.5  2.27 × 10²⁰ 81                     56           2.0           25
C5            7.7 4.44 × 10²⁰ 92                      46           2.1           50
N85           7.56 2.72 × 10²⁰ 81                     56           3.0           20
N90           7.5 2.26 × 10²⁰ 91                      46           2.7           20
O2            7.7 4.54 × 10²⁰ 105                     40           2.4           45
O3            7.7 4.54 × 10²⁰ 105                     40           2.4           45
O4            7.6 3.15 × 10²⁰ 92                      38           2.0           45
O4B           7.4 1.59 × 10²⁰ 72                      35           1.4           45
O5            7.4 1.54 × 10²⁰ 72                      34           1.4           45
OAG           7.9 8.15 × 10²⁰ 85                      42           4.5           50             Álvarez-Gómez et al. (2012)

large tsunamis originated in Chile (1960, 2010, 2014,                  The Colombia scenario implied the shortest arrival time for
and 2015), Japan (2011), Kamchatka (1952 and 2007),                 distant tsunamis, of about 1 h and 15 min, posing the highest
and the Aleutian Arc (1964 and 1957) did not flood                  hazard of all the scenarios considered here. The tsunami came
Costa Rican shores, except for Cocos Island.                        from the south and was refracted to the Central Pacific and
Nonetheless, some of these tsunamis caused important                Nicoya Peninsula (Fig. 5). Historically, three tsunamis from
coastal currents that resulted in damaged ships and                 that region have arrived at Costa Rica: 1906 Colombia Mw =
coastal erosion.                                                    8.8, 1979 Colombia Mw = 7.9, and 2016 Ecuador Mw = 7.8.

Fig. 3 Middle America Trench tsunami sources. (a) Sources from      southeast: G: GUANICA Mw = 8.6, N: NICOBANO Mw = 8.0, D:
Zamora and Babeyko (2015) and Álvarez-Gómez et al. (2012) (OAG).    DOM Mw = 7.5, and O: OSA Mw = 7.6. In gray are shown the sources
UNESCO/IOC Experts Meeting (2018) sources are shown in gray. (b)    from Álvarez-Gómez et al. (2012) and Zamora and Babeyko (2015),
UNESCO/IOC Experts Meeting (2018) sources, from northwest to        detailed in (a)
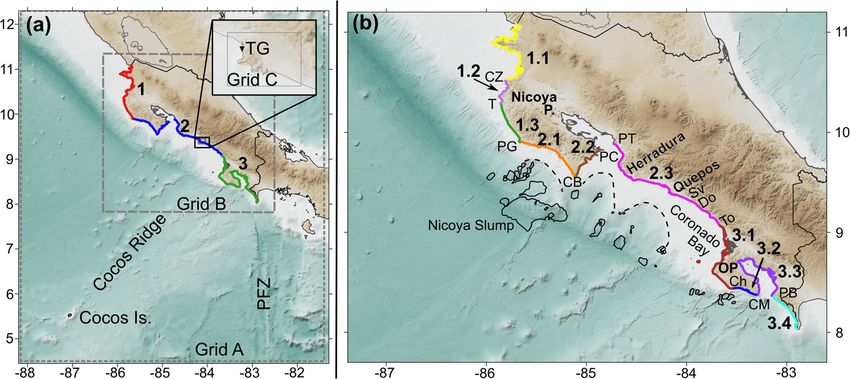
Ocean Dynamics (2021) 71:793–810                                                                                                              801

Fig. 4 Maximum tsunami heights in meters obtained for (a) SA2 Colombia scenario and (b) TK4 Tonga scenario, both Mw = 9.3. In the insets are shown
deep ocean amplitudes and travel time contours every 2 h for both scenarios

In 1906, the flooding of a beach 2 km long in Potrero Bay was              In 2016, the marigram recorded in Quepos showed a maxi-
reported (Soloviev and Go 1984) together with abnormal sea                 mum height of 8.8 cm (Chacón-Barrantes et al. 2021).
behavior at least at three places in the Central Pacific coast                For one Kermadec scenario, the strongest energy beam was
(Chacón-Barrantes et al. in press). In 1979, a partial marigram            focused directly on Costa Rica, arriving from the southwest
recorded in Puntarenas showed maximum heights of over                      and first hitting the Northwest Nicoya Peninsula subsegment.
13 cm (Chacón-Barrantes and Gutiérrez-Echeverría 2017).                    The wave was then refracted to the Southwest Nicoya

Fig. 5 Snapshots of the arrival at
Costa Rica of the SA2 Colombia
scenario depicted in Fig. 4a.
Times of snapshots are given in
hours and minutes after the
earthquake, tsunami heights are in
meters. Gray dashed line in (d)
shows the continental edge,
approximately at 200-m depth.
Reference points are J: Jaco, PM:
Punta Mala, PS: Palo Seco, Qp:
Quepos, PL: Punta Llorona, BNP:
Ballena National Park, SEP:
Santa Elena Peninsula, PG:
Papagayo Gulf, CZ: Cabo
Zapotal, H: Herradura promonto-
ry, and Ch: Punta Chancha
802                                                                                                  Ocean Dynamics (2021) 71:793–810

Peninsula (Fig. 6) and the rest of the coastline. The long travel   possible to include those sources in this work. The experts
time of more than 15 h would allow timely evacuation but still      considered that the Colombia-Ecuador subduction zone can
would pose an important hazard. There are three records of          generate earthquakes up to Mw = 8.7 with high probability,
tsunamis originated at the Tonga-Kermadec subduction zone           and Mw = 8.9 with an intermediate probability (IOC/
that arrived in Costa Rica: 7.9 cm registered in Quepos after a     UNESCO 2021). The experts considered that Tonga-
Mw = 8.0 earthquake in Tonga in 2006 and sea level pertur-          Kermadec subduction zone could generate earthquakes up to
bations at Wafer Bay, Coco’s Island, after the 2009 Samoa           Mw = 9.3 with high probability, and up to Mw = 9.7 with
earthquake, Mw = 8.1. While this manuscript was under re-           intermediate probability (IOC/UNESCO 2020). The sources
view, a tsunami was originated at Kermadec Islands on 4             identified at both experts’ meetings will be modeled in future
March 2021 after a Mw = 8.1 earthquake; the tsunami was             work, as some of the sources identified for Tonga-Kermadec
registered at the tide gauges in Chattam Bay (Coco’s Island)        seem to direct their energy towards Costa Rica: high proba-
and Quepos with maximum wave heights of 5.8 and 17.6 cm,            bility source C (Mw = 8.9), intermediate probability sources
respectively (Chacón-Barrantes et al. 2021). It was also            ABC (Mw = 9.3), ABCD (Mw = 9.5), ABCDE (Mw = 9.6),
witnessed as sea level perturbations and strong currents at         BCD (Mw = 9.4), CD (Mw = 9.2), CDE (Mw = 9.3), and
Wafer Bay, Coco’s Island, lasting for about 3 h with wave           HABCDE (Mw = 9.7) (IOC/UNESCO 2020). Emergency
periods of about 7 min; a video was posted in YouTube at            planners should consider tsunamis originated at both regions
https://youtu.be/cLqGJIE1glo (in Spanish). The modeling of          as special cases in evacuation plans and tsunami warning
this tsunami also reproduced correctly the tsunami records at       procedures.
Quepos and Coco’s Island tide gauges, and a separated                   In the supplementary material are shown the maximum
manuscript is being prepared with these results and records.        tsunami heights nearshore (left panels) and in deep ocean
   Historically, there are no records of mega-earthquakes           (right panels) for all the distant sources simulated. Also, there
(Mw ≥ 9.0) generated at those subduction zones. IOC/                is a table with maximum heights for each source. Sources
UNESCO organized experts’ meetings in 2018 and 2019, to             from México (Fig. S1) caused maximum offshore tsunami
define tsunami worst-case scenarios originated at the Tonga-        heights up to 3.3 m, Juan de Fuca and Gulf of Alaska sources
Kermadec and Colombia-Ecuador subduction zones, respec-             (Fig. S2) up to 0.46 m, Aleutian Arc (Fig. S3), Kuril (Fig. S4),
tively. The reports of both meetings were published while this      Nankai, and Bonin (Fig. S5) sources up to 1.93 m, Marianas
manuscript was on its final phase, and therefore it was not         (Fig. S6) and New Hebrides (Fig. S7) sources up to 2.69 m,

Fig. 6 Snapshots of the arrival at
Costa Rica of the TK4 Tonga-
Kermadec scenario depicted in
Fig. 4b. Times of snapshots are
given in hours after the earth-
quake, tsunami heights are in
meters. Gray dashed line in (d)
shows the continental edge, ap-
proximately at 200-m depth.
Reference points are SEP: Santa
Elena Peninsula, CZ: Cabo
Zapotal, Qp: Quepos, PL: Punta
Llorona, IC: Caño Island, and Ch:
Punta Chancha
Ocean Dynamics (2021) 71:793–810                                                                                                  803

Chile (Fig. S10) and Perú-Chile (Fig. S11) sources up to 3.94        subsegment that is located within the deformation region, also
m. All those sources do not pose a large hazard for Costa Rica       due to energy focusing over the concave shape of the conti-
mainland due to their directivity. However, Coco’s Island is         nental slope. As the edge of the deeper rupture plane is aligned
more exposed to tsunamis from those sources, as was seen             with Punta Mala (PM in Fig. 7), the tsunami energy focused
during the 2010 Chile and 2011 Japan tsunamis (Chacón-               there, causing also higher tsunami heights.
Barrantes and Gutiérrez-Echeverría 2017). Fortunately, vul-             Despite its oblique incidence, the tsunami caused by the
nerability is much lower there due to its low population and         GUANICA scenario got refracted by the concave shape of
high relief; thus, it was not included in the study area.            the shelf break (Fig. 8a), focusing the energy on the
                                                                     Southwest Nicoya Peninsula subsegment as well. This scenar-
5.2 Local tsunami scenarios                                          io also caused wave refraction and interference at Papagayo
                                                                     Gulf (Fig. 8b) and Central Pacific subsegment (Fig. 8c).
Maximum tsunami heights in meters for six of the 21 local            However, tsunami heights were much smaller south of Punta
scenarios are shown in Fig. 7, together with their rupture areas,    Chancha.
when possible. Modeling results from all the 21 local sources           C2 scenario caused the higher tsunami heights in the
can be seen in Figs. S12 to S15 and Table S2.                        Central Pacific subsegment as it was the closest to the gener-
   Local tsunamis produced much lower nearshore heights              ation region. Moreover, the location of this fault plane mostly
than distant tsunamis, because of the moderate earthquake            over the shelf encourages trapped waves, which will be
potential of the Middle America Trench. For all local scenar-        discussed in Section 5.4.2.
ios simulated, the impact was localized and not a single sce-           Seismic faults with uniform slip underestimate tsunami
nario caused tsunami heights over 1 m for the entire coastline.      heights particularly for local tsunamis (Geist 2002; Ruiz
Only four local scenarios had maximum offshore heights over          et al. 2015). However, it was beyond the scope of this paper
3 m: GUANICA and NICOBANO from the 2016 Central                      the definition of local seismic sources. As mentioned before,
America Experts Meeting (UNESCO/IOC 2018), Fig. 7a,b                 the purpose was to get a first approach of the tsunami threat
respectively, and PM2 and C2 from Zamora and Babeyko                 from already identified sources in the literature. As local tsu-
(2015), Fig. 7c,e respectively.                                      namis did not dominate the hazard for Costa Rica, this ap-
   The maximum height was 3.48 m corresponding to                    proach is sufficient at this stage. In the future, the authors
NICOBANO scenario, at the Southwest Nicoya Peninsula                 might consider the use of several methods of slip distribution,

Fig. 7 Maximum tsunami heights in meters for local scenarios: (a) GUANICA and (b) NICOBANO from IOC/UNESCO Experts Meeting (2018), (c)
PM2, (d) N90 and (e) C2 from Zamora and Babeyko (2015), and (f) outer rise from Álvarez-Gómez et al. (2012). PM: Punta Mala
804 Ocean Dynamics (2021) 71:793–810
Fig. 8 Snapshots of the arrival at
Costa Rica of the GUANICA
scenario depicted in Fig. 7a.
Times of snapshots are given in
hours after the earthquake,
tsunami heights are in meters.
Gray dashed line in (d) shows the
continental edge, approximately
at 200-m depth. Reference points
are SEP: Santa Elena Peninsula,
PG: Papagayo Gulf, CZ: Cabo
Zapotal, H: Herradura promonto-
ry, Qp: Quepos, PL: Punta
Llorona, and Ch: Punta Chancha
to get a better characterization of the local seismic-originated Gulf mouth and West Osa Peninsula (Fig. 9b). The moderate
tsunami hazard. maximum tsunami heights for local scenarios are good news
considering the arrival times of between 10 and 30 min.
5.3 Regions with higher joint maximum tsunami The hazard specific to each segment considering all the 57
heights for distant and local tsunamis modeled scenarios will be analyzed in the following section.
To determine the joint maximum tsunami height, it was cho-
sen the maximum value among all the scenarios simulated 5.4 Hazard analysis by region
here, for each cell in grid B with depths larger than 20 m.
The results for distant and local tsunamis are shown in Fig. The beaches were classified in five groups based on the joint
9a,b, respectively. The joint maximum tsunami height for all maximum nearshore tsunami height offshore of each beach.
scenarios is shown in Fig. 10. The ranges of these groups were defined arbitrarily to facilitate
Two subsegments presented the highest joint maximum the prioritization of the community preparedness work at the
tsunami heights within the Pacific coast of Costa Rica: communities nearby or at those beaches.
Southwest Nicoya Peninsula and West Osa Peninsula (Fig. Beaches on the lower groups are not exempt from tsunami
10). Those subsegments also presented higher tsunami heights hazard. According with IOC/UNESCO (2014), tsunami
both for distant and local tsunamis (Fig. 9). heights over 0.30 m represent a marine threat, tsunami heights
For distant tsunamis, most of the coastline had nearshore over 1 m coastal flooding threat, and tsunami heights over 3 m
maximum tsunami heights of less than 10 m, except for are a major tsunami threat.
Southwest Nicoya Peninsula and West Osa Peninsula that This study classifies beaches and not coastal towns and
had maximum tsunami heights up to 12.5 m (Fig. 9a). Other cities as it does not consider vulnerability. Also, beaches pro-
locations with tsunami heights over 7.5 m were Salinas Bay, vide a more static framework than towns and cities, that might
Papagayo Gulf, and close to the mouth of Nicoya Gulf. expand, be relocated or established in the future.
Nearshore maximum tsunami heights for local tsunamis The groups were defined as:
were lower than 2.5 m for most of the coastline. Nearshore
tsunami heights up to 3.5 m were obtained at Salinas Bay and & Group 5, purple, maximum nearshore tsunami height larg-
Papagayo Gulf, Southwest Nicoya Peninsula, close to Nicoya er than 10 m,Ocean Dynamics (2021) 71:793–810 805
Fig. 9 Maximum tsunami heights in meters for Costa Rica for (a) distant Papagayo, C: Bahía Culebra, Mo: Montezuma, Ta: Tambor, Ti: Tivives,
and (b) local sources. Reference points are B: Bejuco (Nandayure), U: J: Jacó, and E: Esterillos
Uvita, D: Drake, BS: Bahía Salinas, GSE: Golfo Santa Elena, GP: Golfo
& Group 4, red, maximum nearshore tsunami height be- The beaches are plotted in Fig. 10 with the color of their
tween 7.5 and 10 m, respective group and maximum nearshore tsunami height in
& Group 3, orange, maximum nearshore tsunami height be- meters. Their vulnerability still needs to be assessed to define
tween 5 and 7.5 m, their tsunami risk.
& Group 2, yellow, maximum nearshore tsunami height be- Due to the low resolution of the model setup, local effects
tween 2.5 and 5 m, were not fully considered. Therefore, higher resolution inun-
& Group 1, green, maximum nearshore tsunami height less dation modeling is strongly recommended at locations show-
than 2.5 m. ing larger near-shore tsunami heights to assess their geophys-
ical responses and tsunami hazard levels.
Fig. 10 Joint maximum tsunami heights obtained considering all the Pencal, M: Manzanillo, Ba: Ballena Bay (Tambor and Pochote), Ti:
scenarios and categorization of tsunami hazard for beaches. Names are Tivives, WE: West Esterillos, CE: Center Esterillos, EE: East Esterillos,
BS: Bahía Salinas, SEG: Santa Elena Gulf, SEP: Santa Elena Peninsula, PS: Palo Seco, CQ: Cocal at Quepos, G: Guapil, BNP: Ballena National
N: Naranjo, PG: Papagayo Gulf, Co: Conejo, T: Tamarindo, M-L: Park, GA: Ganado, Ga: Ganadito, Cl: Colorada, PL: Punta Llorona, SS:
Madero and Langosta, O-N: Ostional-Nosara, Gr: Garza, Sa: Samara, Salsipuedes, *: Sombrero and Carbonera, C-P: Cocal Amarillo and Río
C: Carrillo, Cm: Camaronal, PI: Punta Islita, Cm: Camaronal, B: Claro de Pavones, Cl: Clarita, and PP: Puesto La Playa
Bejuco (Nandayure), SM: San Miguel, Cy: Coyote, Ca: Caletas, Pe:806 Ocean Dynamics (2021) 71:793–810
5.4.1 North Nicoya segment Peninsula. This subsegment has the straightest coastline and
the steepest continental slope of the segment; both factors
The region with smaller maximum tsunami heights was the contributed to the smaller tsunami heights compared to the
northern part of North Guanacaste subsegment (1.1), mostly forementioned subsegments, agreeing with theoretical predic-
because Santa Elena Peninsula (SEP in Fig. 10) shadowed the tions detailed in Section 2.
tsunami energy. This, together with the wider continental Beaches with higher heights at the West Nicoya Peninsula
shelf, caused smaller heights at Santa Elena Gulf (SEG in subsegment were Ostional and Nosara (O-N in Fig. 10), in
Fig. 10), where all beaches were classified in group 2. group 4. These beaches are open and sandy shores near to
However, at the entrance of Salinas Bay (BS in Fig. 10), main river mouths and have smoother underwater landscapes,
nearshore tsunami heights were larger than 5 m due to reflec- which might amplify the tsunami even more once it ap-
tion at the Nicaraguan coast; then, all beaches within this bay proaches to the shore.
were classified in group 3.
On the other hand, wave interference caused larger tsunami 5.4.2 Seamounts-Central segment
heights at Papagayo Gulf (PG in Fig. 10 and Fig. 5d), at the
southern part of North Guanacaste subsegment (1.1). Due to The Southwest Nicoya Peninsula (2.1) together with the West
refraction on the continental slope, tsunami waves reached the Osa Peninsula (3.1) subsegments had the highest concentra-
end of Santa Elena Peninsula and Cabo Zapotal at the same tion of beaches assigned to hazard groups 5 and 4. For the
time (SEP and CZ in Fig. 5d). Then, both sides of the wave Southwest Nicoya Peninsula, this is due to the combination of
traveling along the coast from the north and the south arrived two factors: the wider and less steep continental slope that
at the same time to Naranjo (N in Fig. 10) beach and interfered increase the tsunami energy transmitted to the shelf (Siva
positively with each other, causing higher tsunami heights. and Behera 2016), together with the concave shape of the
Naranjo and other few beaches belonging to Santa Elena continental slope that focuses tsunami energy to beaches in
National Park were classified in group 4; fortunately, most the central part of the curved slope (Saloor et al. 2020).
of these beaches are not open to the public. The rest of the Beaches in group 5 in this subsegment are shown in Fig. 10:
beaches in the southern side of Santa Elena Peninsula were Camaronal (Cm), Punta Islita (PI), Corozalito (Cr), Bejuco
classified in group 3. (B), San Miguel (SM), Coyote (Cy), Caletas (Ca), and
The smaller shelf width and irregular coastline of the south- Pencal (Pe). Beaches in group 3 are located between Punta
ern part of North Guanacaste subsegment and of North Nicoya Guiones (PG in Fig. 2b) and Carrillo (C), and between Santa
Peninsula subsegment contributed to larger tsunami heights at Teresa (M) and Cabo Blanco (CB in Fig. 2b).
both places, due to interactions of the tsunami with the coastal The Central Pacific subsegment (2.3) had beaches in
bathymetry. At the entrance of Culebra Bay, at the southern groups 4 and 3 and only a couple of very small non-visited
part of North Guanacaste subsegment (Fig. 10), nearshore beaches in group 2. Within beaches in group 4, the most
tsunami heights were more than 8 m; then, all beaches within visited are Jacó, Hermosa, West Esterillos (WE in Fig. 10)
this bay were classified in group 4. and the beaches of the Ballena National Park (BNP).
All the beaches at the subsegment 1.2, the North Nicoya Tsunami heights caused by the Colombia SA2 scenario
Peninsula, were categorized as being in hazard groups 4 and 3, were extracted along the 25-m isobath offshore subsegments
except for Conejo (Co in Fig. 10) on group 2, which currently 2.2, 2.3, and 3.1, and their time evolution is shown in Fig. 11b.
can only be accessed by boat. Beaches in hazard group 4 are Most of the tsunamis simulated here had similar behavior.
within Potrero Bay and Grande and Tamarindo. Potrero is a 2- Tsunamis reached both Cabo Blanco (CB) and Punta
km-wide pocket beach located in a bay where several other Llorona (PL) almost at the same time due to refraction
pocket beaches are present and has registered several tsu- (dashed horizontal line in Fig. 11b). This section of the conti-
namis, which might suggest additional local effects not con- nental platform between Nicoya and Osa Peninsulas is very
sidered here. Landward, the terrain is characterized by low particular. The very narrow continental shelf offshore Cabo
steepness, especially in its northern part. Beaches in the neigh- Blanco and Punta Chancha (Ch in Fig. 11a), together with
bor Brasilito, Grande, and Tamarindo bays (T in Fig. 10) were Tortuga Island (IT) and the scars from rotational slides off-
in group 3. shore Nicoya Gulf and Quepos (Qp), caused four sets of
The beaches in the West Nicoya Peninsula subsegment trapped edge waves.
(1.3) were classified mostly in group 3. This subsegment The first set almost covered the Southeast Nicoya
had moderated tsunami heights; on one hand, these heights Peninsula subsegment (2.2). It extended from Cabo Blanco
are higher than the northern part of North Guanacaste, as it to Tortuga Island (CB and IT in Fig. 11a) having wave heights
faces the trench and then is more exposed to tsunamis than the over 2 m for up to 10 h. Most tsunamis arrived obliquely to
latter. On the other hand, this subsegment had smaller heights this subsegment (Fig. 5c and Fig. 6d), which increased the
than the southern part of North Guanacaste and North Nicoya apparent width of the continental shelf decreasing the waveOcean Dynamics (2021) 71:793–810 807
trapped waves at Coronado Bay had the largest periods of up
to 1:56 h.
These edge waves caused larger joint maximum tsunami
heights at Punta Mala and Marino Ballena National Park (PM
and BNP in Fig. 10 and Fig. 11) and caused Hermosa, West,
Center and East Esterillos, Palo Seco, Cocal, Guapil (WE, CE,
EE, PS, CQ, G in Fig. 10) and beaches within the National
Park to be classified in group 4.
The geomorphology of Coronado Bay is similar to that of
Tehuantepec shelf, México, where the 2017 tsunami caused
trapped waves that lasted for 3 days (Adriano et al. 2018;
Chacón-Barrantes 2018; Melgar and Ruiz-Angulo 2018). A
comprehensive study of these edge waves in Coronado Bay
shelf, like the one performed by Melgar and Ruiz-Angulo
(2018), is beyond the scope of this paper, but it should be done
to have a more accurate threat estimate. These trapped waves
might be dangerous not only for the coastal towns but also for
the many fishermen and touristic boats that offer whale
watching tours, snorkeling, and visits to Caño Island.
5.4.3 Coco’s Ridge-Osa Peninsula segment
The West Osa Peninsula subsegment (3.1) presented the
highest tsunami heights of the segment and the highest of
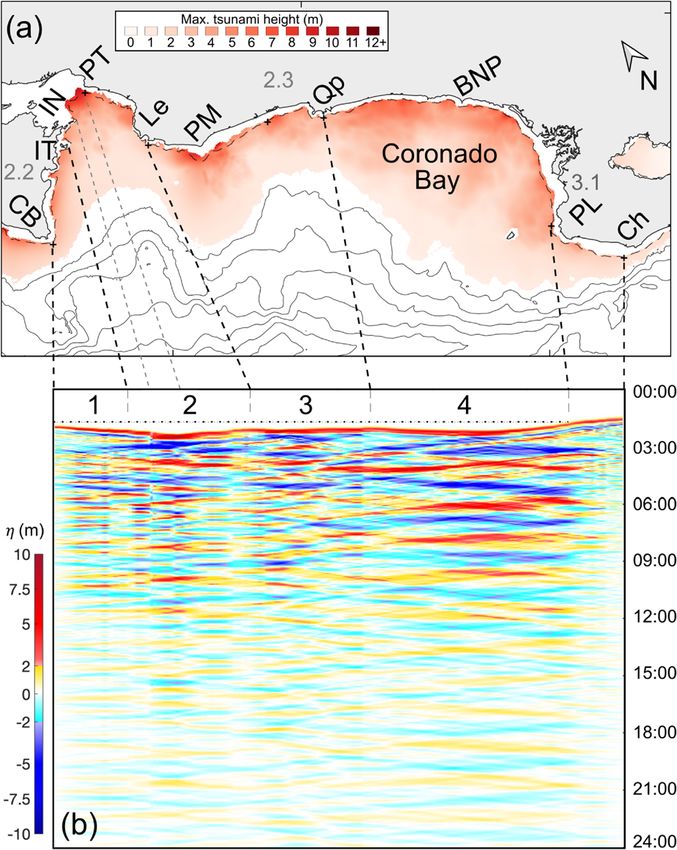
Fig. 11 Colombia SA2 scenario. (a) Maximum tsunami heights in the entire coastline together with the Southwest Nicoya
meters. Dashed contour corresponds to 25 m isobath and solid lines are
Peninsula subsegment (2.1). Subsegment 3.1 had all beaches
isobaths every 500 m. (b) Time evolution in hours after the earthquake of
tsunami heights obtained at 25-m depth along the subsegments 2.2 in groups 5 to 3; beaches in group 5 are Ganado (GA),
(Southeast Nicoya Peninsula), 2.3 (Central Pacific), and 3.1 (West Osa Ganadito (Ga), Drake, Colorada (Cl), and Llorona (Fig. 10),
Peninsula). Tsunami waves get trapped between Nicoya and Osa and the only beach in group 2 is Salsipuedes (SS), at
Peninsula, having wave heights of over 2 m, up to 13.5 h after the first
Corcovado National Park. The trapped waves mentioned
arrival. Geomorphological features are CB: Cabo Blanco, IT: Tortuga
Island, IN: Negritos Islands, PT: Punta Torre, Le: Punta Leona, PM: above at Coronado Bay caused these larger tsunami heights.
Punta Mala, Qp: Quepos, BNP: Marino Ballena National Park, PL: Also, these waves got refracted around Caño Island (IC in Fig.
Punta Llorona, and Ch: Punta Chancha 6c) interfering positively behind it, causing larger tsunami
heights for its eastern side and for mainland beaches eastern
height, despite the low steepness wide continental slope. Most from the island (arrow in Fig. 6d). This effect was stronger for
of the beaches in this subsegment (2.2) were assigned to group tsunamis arriving from the east, like those originated at the
3. The only two beaches in group 4 are Tambor and Pochote in Tonga-Kermadec Trench (Fig. 4b) or the C2 scenario (Fig. 7e)
Ballena Bay (Ba), in Fig. 10, due to local effects that were not from Zamora and Babeyko (2015). However, it was also pres-
fully modeled here. ent for tsunamis arriving from the south-southeast and north-
The second set of trapped edge waves extended from northwest, like the Colombia-Ecuador scenarios (Fig. 4a and
Tortuga Island to Punta Leona (IT and Le in Fig. 11a) and Fig. 5d) or scenarios close to Nicoya Peninsula (Fig. 7a, b, or d
had wave heights over 2 m for up to 13.5 h. The largest wave and Fig. 8d), respectively.
heights and over the longest timespan offshore this section of Subsegments 3.2, 3.3, and 3.4 had beaches mostly in group
the coastline were located at Nicoya Gulf mouth (between 2 due to the very steep continental slope that reflected most of
Negritos Islands and Punta Torre, IN and PT, delimited by the tsunami energy, despite their extremely narrow continental
gray dashed lines at Fig. 11). Further studies are needed to shelf. Directivity of the most threatening distant tsunamis
determine if these waves are transmitted inside the Gulf; as (Colombia and Tonga Kermadec trenches) may be also in-
mentioned before, Nicoya Gulf is very shallow, which re- volved in these low to moderate heights. For both scenarios,
quires higher resolution bathymetry, not available now. tsunamis arrived almost perpendicularly to the coastline of
The third set of trapped edge waves extended from Punta subsegments 3.2 and 3.4 (Colombia scenarios from the east
Leona (Le) to Quepos (Qp), and the fourth set covered and Tonga scenarios from the west, Fig. 4a and Fig. 5b,
Coronado Bay, from Quepos to Punta Llorona (PL, Fig. respectively), hindering wave shoaling, like happened for sub-
11a). Both had wave heights over 2 m for up to 10 h. The segment 2.1.You can also read