A First Look at Results from the Toronto 2015 Environment Canada Pan Am Science Showcase (ECPASS) - David Sills
←
→
Page content transcription
If your browser does not render page correctly, please read the page content below
A First Look at Results from the
 Toronto 2015 Environment Canada
Pan Am Science Showcase (ECPASS)

                    David Sills
       Science and Technology Branch, Toronto, ON

            GLOMW 2018, May 1-3, Cleveland OH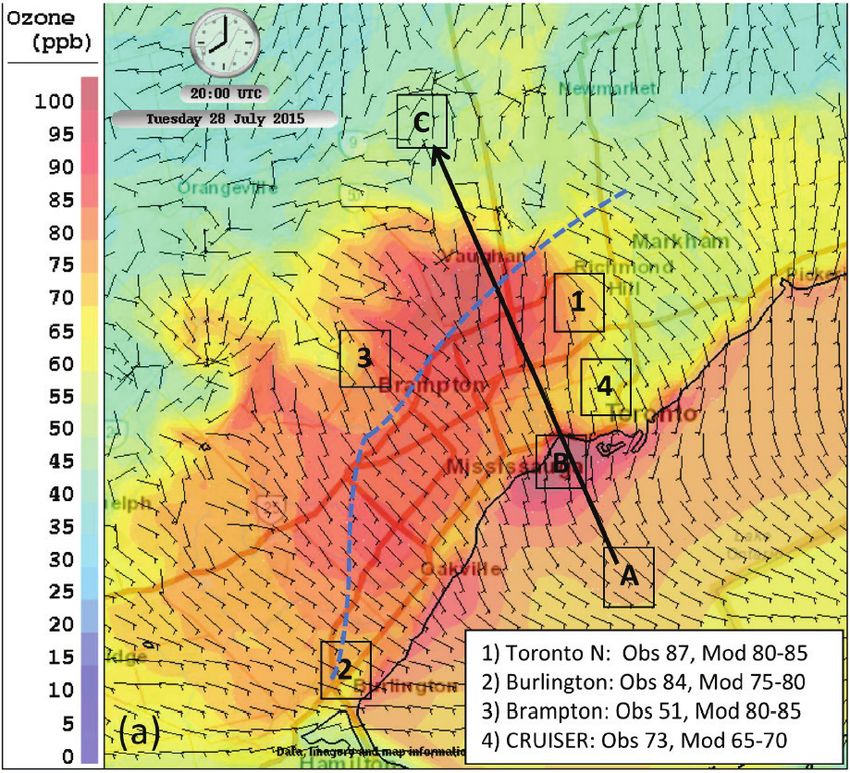
Outline
    • ECCC and the Games
    • ECPASS Experimental Design
    • Results
      • Mesoscale analyses
      • LiDAR
      • NWP
      • Thunderstorm prediction
      • Air Quality
    • Summary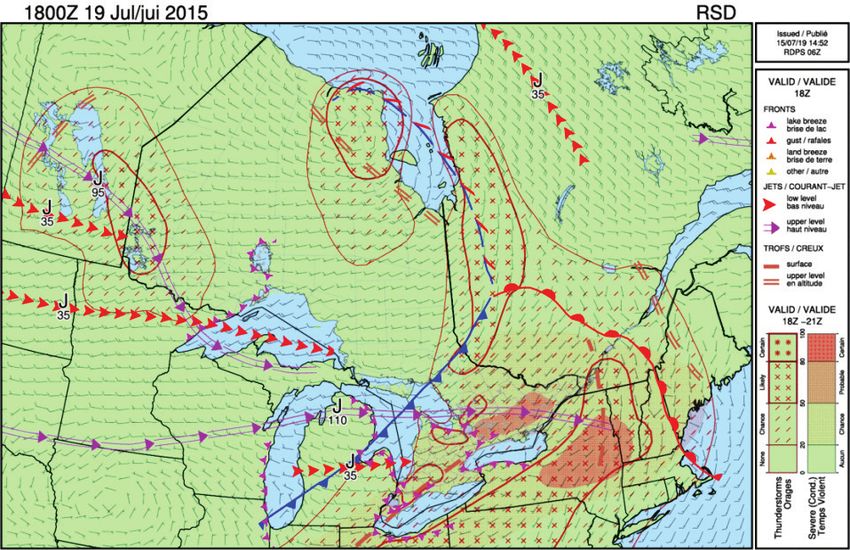
Pan Am / Parapan Am Games
 • Large regional international summer sporting event,
   staged every four years somewhere in the Americas
 • In Toronto July 10-26 and August 7-15, 2015
                        2010 Vancouver             2015 Pan and Parapan
     SCOPE:
                           Olympics                     Am Games
 Countries                       80                            42

 Athletes and                   2600                     8000 – Pan Am
 Coaches                                               2000 – Parapan Am

 Volunteers                    20,000                        23,000
 Number of Sports    16 – Olympics (10 outdoors)    40 – Pan Am (18 outdoors)
                           4 – Paralympics               10 – Parapan Am

 Range of                  1,500 to 18,000         1,500 to 20,000 (potentially
 Spectator Seating                                 70,000 for Opening/Closing)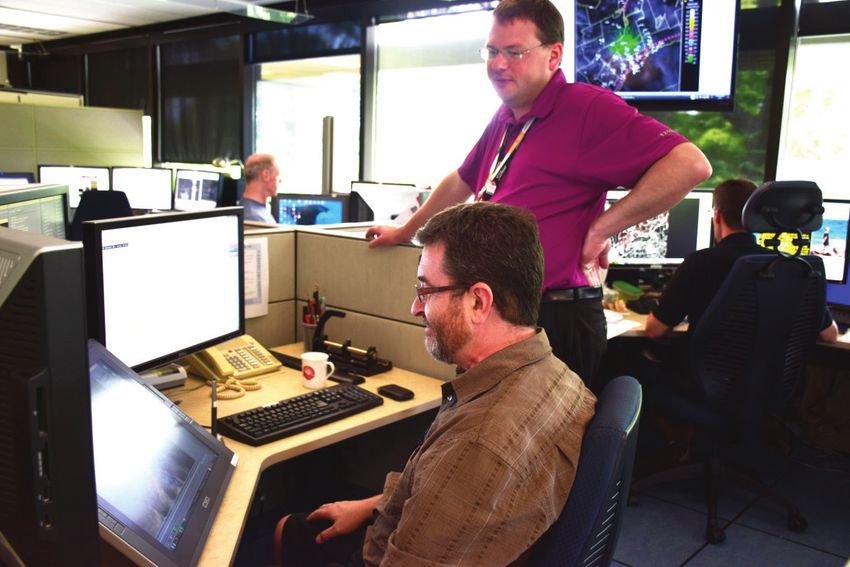
ECCC Role / Mandate
                      ECCC

         Operations          Science
          (MSC)               (S&T)
                                                            20 Venue Locations

• Enhanced Weather         • Monitoring Science
  Monitoring                 and Design
• Venue Warnings           • Cutting Edge NWP
• 24/7 Forecast            • Integration and
  Support Treasury Board     Nowcasting

              Operations / Science
                   Synergies           Page 4 – June-8-18
ECPASS Objectives - Science
• Lake breeze focus –
  significant influence
  on thunderstorms and
  air pollution
• Legacy data sets for
  process studies and
  NWP validation

                          NASA Aqua satellite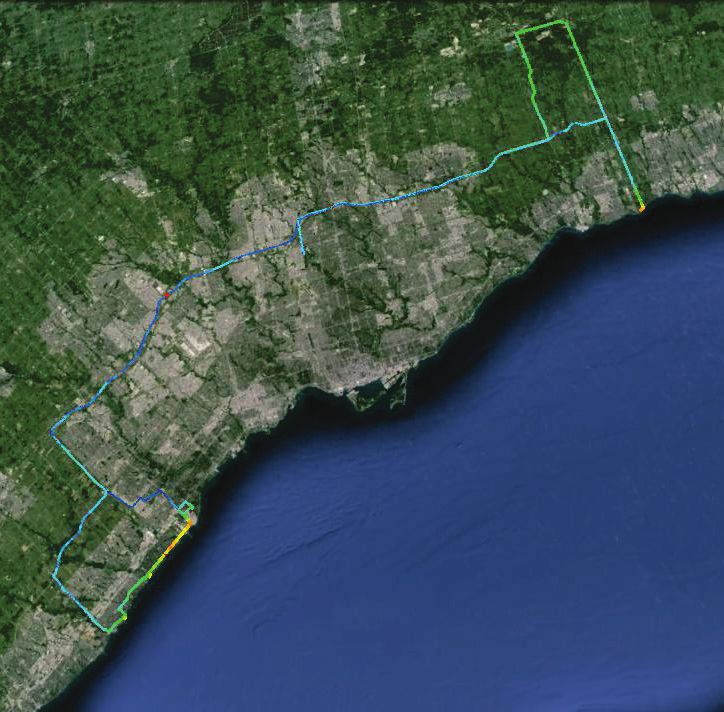
Experimental Design
o 55 new surface stations
• 1-min data
• Including 10 S&T 10 m
ATMOS stations
o 2 meteorology ‘supersites’
• Oshawa (PUMS)
• Pearson Airport
o 14-stn total lightning system
• SOLMA
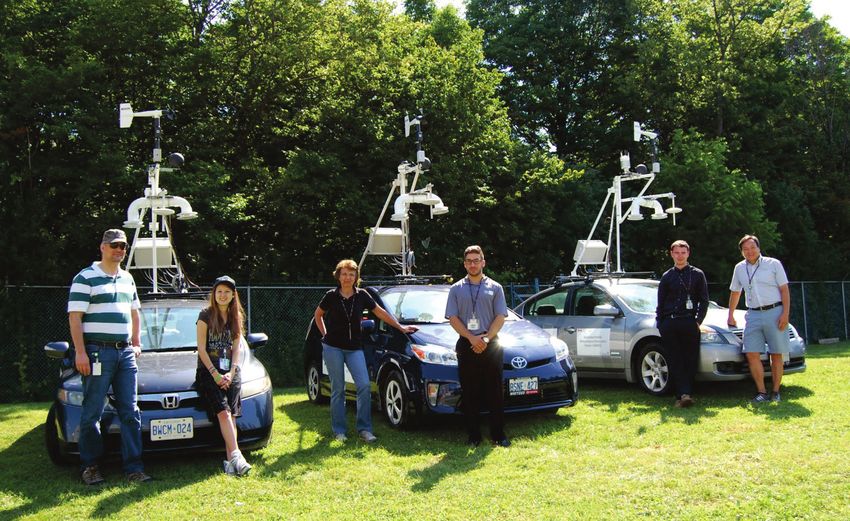
o 1 mobile AQ lab
• CRUISER
o 3 mobile met/AQ vehicles
• AMMOS
o 2 Doppler LiDARs
• 1 mobile, 1 fixed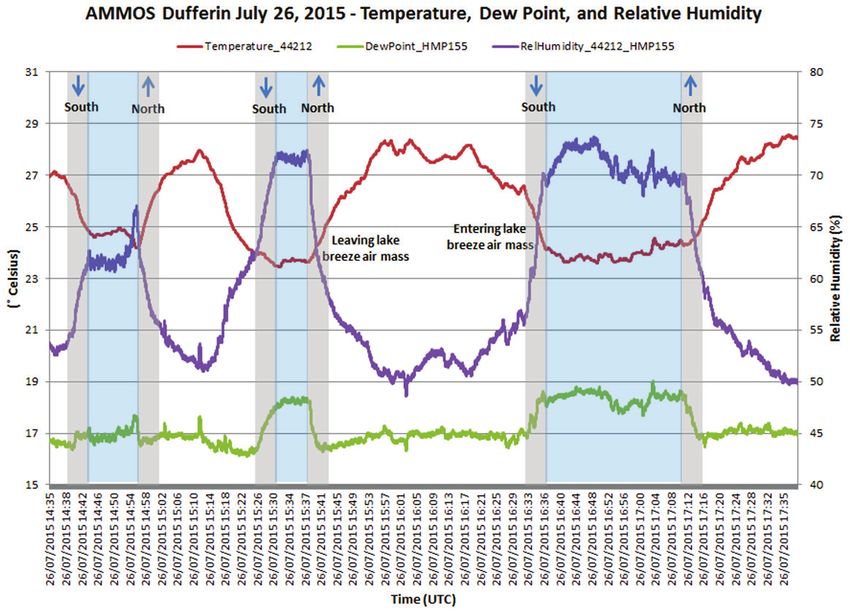
Experimental Design
                                    Surface winds / temps
o 1 Waverider buoy and
  2 instrumented boats
   • Sailing venue
o Rawinsonde launches
   • 4 per day during Pan Am only
o 4 UV sensors
o 250 m urban HRDPS model
   • Cascade from 2.5 / 1 km
o 2.5 km GEM-MACH AQ Model
   • Online coupled met/chem                                Surface winds / PM2.5

o Lake and wave modelling
o Website for real-time data
  access / blogging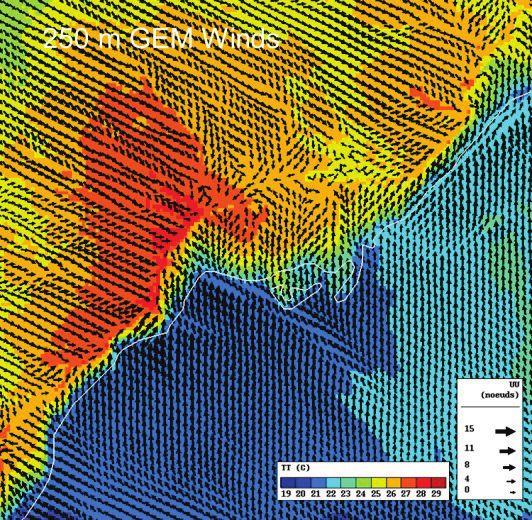
0   km   50
PA2015
Mesonet

                   Existing Sfc Stn

                   Existing Buoy
                   AMMOS Mobile Stn
                       Auto8 Stn
                   New Auto8

                   New Buoy

                   ATMOS 10m Sfc Stn
                   Compact Compact
                           Sfc Stn
                   Existing Radar

                   Supersite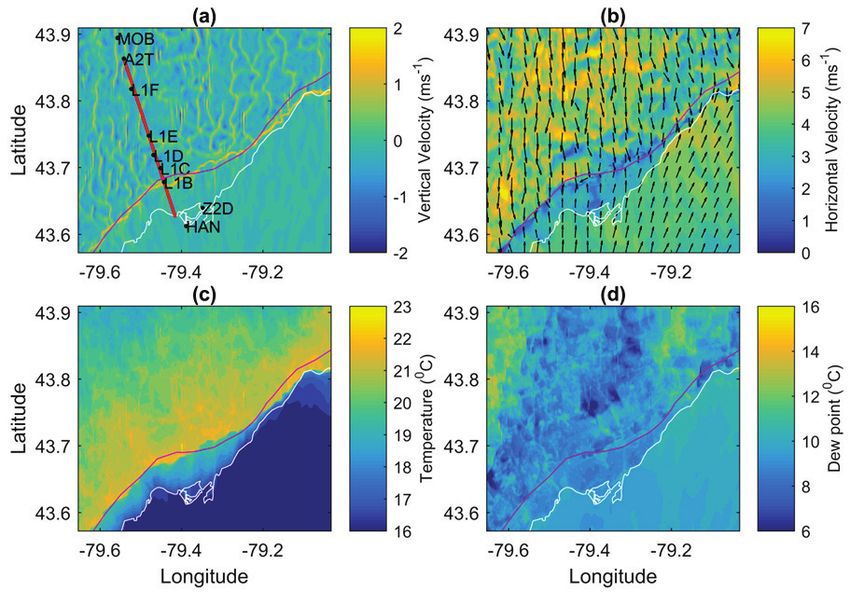
AMMOS Mobile Measurements

• Automated Mobile Meteorological
  Observing System (AMMOS) x 3
• Met (@ 1 sec) + AQ
• Sampling lake-breeze fronts, gust
  fronts, heat stress, air quality and
  urban heat island effects
ECPASS Stats Summary

 • Fairly typical summer weather climatologically
 • Near-shore lake temps ranged from 12C to 24C
 • An impressive 21-day episode from July 18 to
   August 7 where lake breezes were recorded on
   both Lake Ontario and Lake Erie!
Hourly Mesoanalyses
Realtime 5-min Mesoanalyses
AMMOS Mobile Measurements
Mariani, Z., A. Dehghan, P. Joe and D. Sills,
                                                2017: Observations of lake-breeze events

LiDAR Measurements
                                                during the Toronto 2015 Pan-American
                                                Games. Boundary-Layer Meteorol., DOI
                                                10.1007/s10546-017-0289-3.

 1357Z                         1417Z

 1437Z                         1547Z

         Jul 15th – Offshore synoptic flow case
LiDAR Measurements
1806Z 1417Z
Aug 9th – Onshore synoptic Jul 15th – Offshore
flow case (inland) synoptic flow caseLiDAR Measurements
1806Z 1417Z
Aug 9th – Onshore synoptic Jul 15th – Offshore
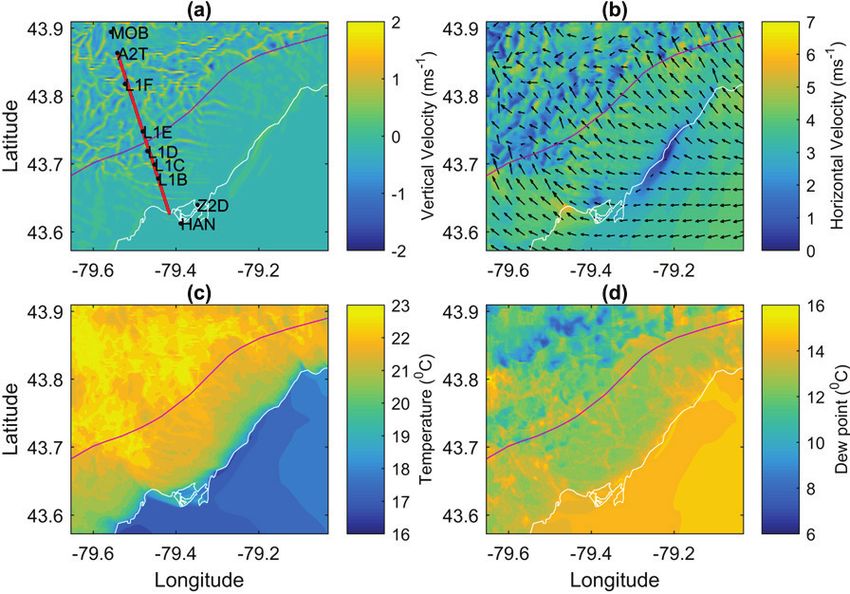
flow case (inland) synoptic flow caseDehghan, A., Z. Mariani, S. Leroyer, P. Joe, D.
Sills and S. Bélair, 2017: Evaluation of modeled
HRDPS Performance
lake breezes using an enhanced observational
network in southern Ontario: case studies.
Submitted to J. Applied Meteorol. Climatol.
250m
Jul 15th – Offshore synoptic flow caseHRDPS Performance
Retreating lake-breeze front
250m
Jul 15th – Offshore synoptic flow caseHRDPS Performance
250m
Aug 9th – Onshore synoptic flow caseHRDPS Performance
250m
No front?
Aug 9th – Onshore synoptic flow case‘Next Gen’ Demonstration • The 2015 Toronto Pan / ParaPan Am Games presented a unique opportunity to demonstrate and evaluate a MetObject- based prediction system prototype • Integrated and employed enhanced monitoring and NWP data focused on lake-breeze front influence on severe weather / AQ • Generated experimental products to help support Pan Am and OSPC forecasters during the Games • At a ‘Research Support Desk’ in the OSPC operations / Pan Am Desk area
‘Next Gen’ Demonstration
 CHALLENGE: find the best way to combine human
 skills with automated prediction techniques for better
 forecasting, nowcasting and alerting
 • Make most effective use of latest observational and
 NWP advances + algorithm developments
 • Exploit, maintain and build forecaster expertise with
 area-based ADP via MetObject approach
 • Use iCAST (Sills et al. 2009) MetObject prototype
 to integrate forecasting, nowcasting and alerting
 functions into one multiscale semi-automated system
 with advanced verification
RSD1 Synoptic Space / Time Scale

                                                         Mix of
                                                         ‘ADP’ MetObjects
                                                         and
                                                         ‘Weather Element’
                                                         MetObjects

MetObject prognoses at ‘key frames’ for T0+3 hr to T0+72hr:
• Synoptic-scale and mesoscale features important for convection based on
observations, det/ens/pp NWP guidance, conceptual models, etc.
• Probabilistic areas for thunderstorm likelihood and severity
• Derived outlooks, interpolated animations, time series, verification products
Real-Time Verification
Chance
Likely
BSS – relative skill
over climatology ROC Score = 0.6885Post-Project Verification
Thunderstorm
Burrows
Initiation
Statistical
(Δx=15 km)
Ingredients
(Δx=10 km)
Model KF
Convection
REPS
Param. (Δx=15 km)
(Δx=10 km)Post-Project Verification
Pierce Skill Scores by Forecast Lead Time
“Chance” category
ROC-AUC / PSS
for 6-hr lead time
From Brunet, Driedger and Sills, 2018 (in preparation)
• Post-processing by optimal smoothing / dilation results in improved skill
and better discriminative power for all NWP forecasts – KF even gets
slightly better than REPS(!)AQ Observations Courtesy Jeff Brook/ECCC
• Goals were to employ CRUISER in urban areas to
study spatial and temporal patterns of pollutants and
their relationship to urban meteorology
• Evaluate high-resolution
(2.5 km) GEM-MACH v2
• Mobile measurements
made near routine
monitoring sites (e.g.,
Resources Rd., Downtown
T.O., Downsview)
• High time resolution
datasets (1 – 5 sec data)
Page 27 – June-8-18
Data: black carbon, NO, NO2, O3, HCN, PM, VOCs + metAQ Observations
CRUISER
Deployment
Oshawa
Oakville RH%
• July 24th: No change in O3 in Oakville when
penetrating lake breeze (RH↑), but later in the day in
Oshawa O3 increasedPage>2870 ppbv when CRUISER
– June-8-18
passed into lake air → more processed airAQ Modelling
Joe, P. and co-authors, 2018: The Environment
Canada Pan and ParaPan American Science
Showcase Project, BAMS, in press.
• Hi-res (2.5 km)
GEM-MACH v2 /
2.5 km emissions
• Jul 28th prediction
shows up to
95 ppbv O3
behind lake-
breeze front,
higher than
observed
• GEM-MACH front
much further
inland at 20 UTC
than observed
frontAQ Modelling
Lake-Breeze
Front
Lake Shore Well Inland
• Some question as to whether ozone at lake surface is real…AQ Modelling
Stroud et al. 2016Summary • The Toronto 2015 Pan / ParaPan Am Games provided a focal point for collaborative science activities and accelerated a number of projects • Unique, world-class data set for process studies and hi-res model validation – numerous reports, presentations and publications, and more to come • All data to be available via the open data portal (some are there now) • Many lake breeze cases but ‘big event’ / boundary-initiated severe storms didn’t materialize…Field Studies 101
Acknowledgements
• Mesonet – John Macphee, Joan Klaassen
• LiDAR – Zen Mariani, Paul Joe
• HRDPS NWP – Stephane Belair,
    Sylvie Leroyer, Armin Dehghan
•   RSD Forecasters – Neil Taylor,
    Helen Yang, Anna-Belle Filion
•   MetObject Demo – Norbert
    Driedger, Brian Greaves,
    Emma Hung, Dominique
    Brunet, Bill Burrows
•   AQ – Jeff Brook, Craig Stroud
                        Page 33 – June-8-18
Thank you! David.Sills@canada.ca • The Toronto 2015 Pan / ParaPan Am Games provided a focal point for collaborative science activities and accelerated a number of projects • Unique, world-class data set for process studies and hi-res model validation – numerous reports, presentations and publications and more to come • All data to be available via the open data portal (some are there now) • Many lake breeze cases but ‘big event’ / boundary-initiated severe storms didn’t materialize…Field Studies 101
You can also read