A four-terminal-pair Josephson impedance bridge combined with a graphene-quantized Hall resistance
←
→
Page content transcription
If your browser does not render page correctly, please read the page content below
Measurement Science and Technology

PAPER • OPEN ACCESS

A four-terminal-pair Josephson impedance bridge combined with a
graphene-quantized Hall resistance
To cite this article: S Bauer et al 2021 Meas. Sci. Technol. 32 065007

View the article online for updates and enhancements.

                              This content was downloaded from IP address 192.53.103.119 on 07/07/2021 at 09:37
Measurement Science and Technology
Meas. Sci. Technol. 32 (2021) 065007 (9pp) https://doi.org/10.1088/1361-6501/abcff3
A four-terminal-pair Josephson
impedance bridge combined with a
graphene-quantized Hall resistance
S Bauer1, R Behr1, R E Elmquist2, M Götz1, J Herick1, O Kieler1,
M Kruskopf1,2, J Lee1, L Palafox1, Y Pimsut1,3 and J Schurr1
1
Physikalisch-Technische Bundesanstalt, Bundesallee 100, 38116 Braunschweig, Germany
2
National Institute of Standards and Technology, 100 Bureau Drive, Stop 8171, Gaithersburg, MD 20899,
United States of America
3
National Institute of Metrology Thailand, 3/4-5 Moo 3, Klong 5, Klong Luang, Pathumthani 12120,
Thailand
E-mail: stephan.bauer@ptb.de
Received 7 October 2020, revised 3 November 2020
Accepted for publication 2 December 2020
Published 31 March 2021
Abstract
This paper introduces a four-terminal-pair impedance bridge based on pulse-driven Josephson
junctions arrays which is designed to link any kind of impedance to the quantized Hall
resistance. The unique features of the quantized Hall resistance in a multiple series connection
allows to dispense a combining network and leads to a compact and simple design of the whole
setup. Moreover, the low noise of a quantized Hall resistance reduces the measurement time
compared to resistance standards at room temperature which is essential for the characterization
of quantum Hall devices in the AC
√ regime. A first measurement campaign confirmed the
expected low noise of 1.82 nV/ Hz for a link to a 10 nF capacitance standard. The repeatability
of the bridge was found to be few parts in 108 . Capacitance and resistance standards were
measured at 1233.15 Hz against graphene based quantum Hall resistance devices.
Keywords: impedance measurement, quantized Hall resistor, coaxial impedance bridge,
graphene, Josephson arbitrary waveform synthesizer
(Some figures may appear in colour only in the online journal)
1. Introduction The QHR is the state-of-the-art standard for the unit ohm
in the DC regime in the new SI [2–4]. Different approaches
Measurements of impedances play a major role in realizing are used for realization of the electrical units, especially
and disseminating the electrical units and also for many fields the unit farad. One possibility is to start with a calculable
in our daily life, which has encouraged development of a large Thompson Lampard capacitor [5]. This method results in a
variety of impedance bridges [1]. rather short calibration chain if the targeted values are the
The well-known quantized Hall resistance (QHR) is a very commonly used 10 pF and 100 pF. Another possibility is to
good example for the use of quantum effects in metrology. make use of the quantized Hall resistance. This solution splits
up into two different routes. The first one starts from the
DC QHR and uses resistors with well-known AC–DC trans-
fer difference [6]. The second possibility is to use the QHR
Original Content from this work may be used under the
terms of the Creative Commons Attribution 4.0 licence. Any
directly operated at AC which allows not only to omit the
further distribution of this work must maintain attribution to the author(s) and artefact for the AC–DC transfer, but has further metrolo-
the title of the work, journal citation and DOI. gical advantages [7]. In the past, this route could only be
1361-6501/21/065007+9$33.00 1 © 2021 The Author(s). Published by IOP Publishing Ltd Printed in the UKMeas. Sci. Technol. 32 (2021) 065007 S Bauer et al
realized by precise and complex impedance bridges based 2. Experimental setup
on inductive voltage dividers (IVD). To get the 90◦ phase
angle needed for a comparison of a resistance and a capa- The experimental setup was introduced in [17] and can
citance, this bridge employs a double quadrature bridge with be divided into three parts. The first one describes the
two QHR and two 10 nF capacitance standards. Because of pulse-driven Josephson system which provides the two poten-
the combination of two bridges, these devices are often called tial definitions within the impedance bridge. The second part
double quadrature bridges. By this method the calibration introduces the quantized Hall resistance setup. Finally the 4-
chain for capacitance is simplified and the measurement uncer- TP bridge is explained including injection and detection trans-
tainties are reduced compared to the chain starting with the former as well as sources and detectors.
DC QHR [7].
Using graphene based QHR devices will allow for relaxed 2.1. Pulse-driven Josephson system
experimental conditions as the operating temperature can be
raised to that of liquid helium (4 He, 4.2 K). Also GaAs QHR For the measurements reported here, two pulse-driven Joseph-
devices can be operated at metrological precision [8] but the son junction arrays were installed into a liquid helium Dewar.
needed magnetic field is typically in the range above 6 T Each array can provide AC signals with amplitudes of over
and the i = 2 plateau is smaller at this higher temperatures. 100 mV using the AC coupling technique with compensation
The magnetic field can be reduced to the range of about 5 T currents [18]. The rf pulse bias is realized by a pulse pattern
using graphene based devices. Combining the higher tem- generator (PPG; BPG 2x30G-TERx4, Sympuls4 ) with a clock
perature and the lower magnetic field allows to operate the speed of approximately 14 GHz and two independent memor-
graphene QHR in a compact closed cycle cryostat. This will ies. With this PPG, the output signal generated by one memory
reduce the costs and complexity of such systems and hence can be shifted in steps of one bit relative to the other memory.
increase the appeal for smaller National Metrology Insti- This results in a resolution of about 71 ps at 14 GHz clock
tutes, calibration laboratories and in future maybe also for frequency. The phase angle between the two signals can be
industry [9–12]. fine tuned using an analog delay with 200 fs resolution, which
The need for two QHR devices in a double quadrature is a perfect condition for the phase adjustment in impedance
bridge can be avoided by using a digital impedance bridge measurements. The Josephson arrays are mounted in a special
which is able to generate arbitrary and precise phase angles. chip carrier with two separated capsules to provide individual
An impedance bridge using two pulse-driven Josephson screens for each array (see figure 1) [19]. With this screen-
junction arrays (also called Josephson Arbitrary Waveform ing the crosstalk between both signals was below our detec-
Synthesizer) is a special type of such a digital impedance tion limit of approximately −180 dB for frequencies less than
bridge. The outstanding ability of JAWS to provide quantum- 10 kHz and −146 dB at 100 kHz. This was measured at the out-
based AC signals with high accuracy and extremely low put of one JAWS that was switched off with a lock-in amplifier
harmonic content [13] can efficiently be used for imped- while the other array was operated at the nominal amplitude of
ance metrology [14–16]. Using two independent JAWS sys- 100 mV.
tems allows to provide arbitrary voltage ratios with an arbit- The spurious free dynamic range (SFDR), measured with
rary phase angle. Moreover, the possibility of generating a NI PXI-5922 is at least 115 dBc at 1233.15 Hz as shown in
arbitrary signals can also be used to investigate proper- figure 2. This high spectral purity avoids any mixing of higher
ties of the associated bridge setup e.g. generating a signal harmonics into the measurement frequency due to non-linear
with defined harmonic content to investigate the response response of e.g. pre-amplifiers.
of the setup. The combination of Josephson voltage stand- The range of bias parameters over which the SFDR is
ards and a quantum Hall device provides perfect condi- not affected, is often called operating margins, flat spot or
tions for impedance metrology [15]. The possibility to gen- quantum-locking range (QLR). In order to determine this
erate arbitrary voltage ratios and phase angles also allows QLR, both Josephson systems were checked by two types of
to compare e.g. 1 nF capacitance standards directly with the measurements. The first possibility is to add a low frequency
QHR. This reduces the calibration chain to the commonly current to the array. The maximum additional current which
used 10 pF capacitance standards by one step as presented does not affect the SFDR is a measure of the QLR of the sys-
in [16]. tem. For the two arrays used in this measurements, the max-
We will present the extension of PTBs two-terminal-pair imum additional low frequency currents are 1.13 mA for array
impedance bridge to a four-terminal-pair definition as well 1 and 0.85 mA for array 2.
as the results of a first measurement campaign. The paper is The second way is to check the range of bias parameter
structured in the following way: First the experimental setup in which the SFDR of the output signal is not changed. This
with all needed components will be introduced in section 2. was carried out before the measurement campaign and each
Section 3 presents measurement results. Finally, section 4 will
summarize the paper and will present an outlook for future 4Identification of commercial equipment does not imply an endorsement by
work on this impedance bridge. PTB or that it is the best available for the purpose.
2Meas. Sci. Technol. 32 (2021) 065007 S Bauer et al
inductance of the Josephson junction arrays was measured at
100 kHz to be 15 nH for array 1 and 16 nH for array 2. The
estimated uncertainty for the inductance measurement is 5%.
This voltage is shifted by approximately 90◦ and hence mainly
affects the imaginary part of the measurement. Moreover, as
long as the inductive voltage drop does not change, the influ-
ence on the result cancels out when the impedances are inter-
changed and remeasured as described later in section 2.3.
Small changes in the output voltage are needed to balance
the bridge or to determine the sensitivity of the setup, but the
inductive voltage drop will not change since the compensa-
tion current remains constant. The phase of the compensation
current is set such that the in-phase component of the main
detector remains constant while changing the compensation
current [17].
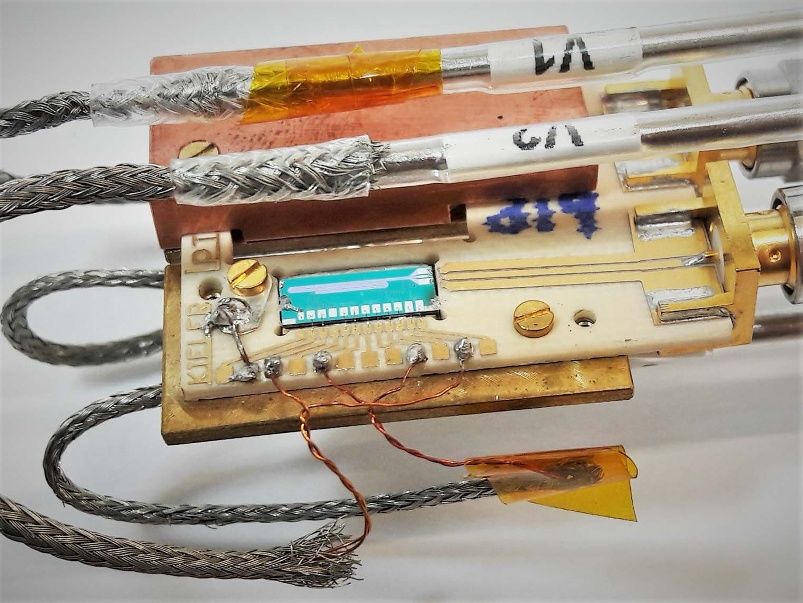
Figure 1. Picture of the chip carrier for the two Josephson junction
2.2. Quantized Hall resistance setup
arrays. The top cover of the first array is removed in this photo.
The QHR sample was mounted in a EUROMET coaxial
1000 -20 sample holder developed by METAS [21] and operated inside
a cryomagnet system at 4.2 K. The maximum field is ±12 T.
100 0
Based on the geometry of the contacts of our QHR device, we
10 20 set the current of the magnet so that the magnetic field vector
Amplitude / mV
points perpendicular out of the plane of the two-dimensional
SFDR / dBc
1 40 electron gas when viewed as in figure 3. For the reverse orient-
0.1 60
ation of the magnetic field, the quantum Hall voltage is meas-
ured diagonally instead of orthogonally, which might be less
0.01 80 favored because of a superimposed longitudinal voltage. The
0.001 100
setup is equipped with coaxial cables and hence allows to per-
form DC and AC measurements.
1E-4 120 All measurements presented in this work were carried out
with a graphene QHR sample provided by NIST [22]. The
1E-5 140
0 10000 20000 30000 40000 50000 sample is doped by chromium tricarbonyl for charge car-
Frequency / Hz rier density control [23]. By gently heating the sample in
an inert gas atmosphere at 150◦ C, the carrier density was
Figure 2. Measured spectrum of the output signal of array 1 at adjusted to a low n-type level between 1.0 × 1011 cm−2 to
1233.15 Hz. The SFDR is less than 115 dBc, as indicated by the 3.1 × 1011 cm−2 during different cool downs. The electric con-
black line. tacts of the device use superconducting NbTiN as well as a
branched design to minimize dissipation in the triple-series
connection [24, 25].
bias parameter was set to the center value of the range found.
For this purpose, the 4-TP impedance bridge offers a highly
sensitive detection of changes in the output voltage. When the
2.3. Impedance bridge setup
impedance bridge is balanced (see section 2.3.1) any change
in the output voltage due to a change of bias parameters of The impedance bridge is an extension of the existing two-
one system will directly change the detector reading. This terminal-pair setup [15]. A schematic diagram is shown in
measurement turned out to be more sensitive than the SFDR figure 3 and represents a classical four-terminal-pair (4-TP)
measurements, which remained unchanged even though the bridge. It consists of a potential arm and a current arm for
detector had shown changes. Detailed measurements were not each of the two impedances. Within this bridge the defining
carried out during these proof of principle measurements since conditions for a 4-TP measurement must be fulfilled. Hence
the measurement time was limited and some effects will can- the currents inside the potential arms must be zero. This is
cel out as long as they are stable over the measurement time as achieved by adjusting the current injection (S1 and S2 ) such
reported in [16]. We will perform a detail study of this depend- that the measured currents in the potential arms at the detection
ency as part of the process to determine the complete uncer- transformers (D1 and D2 ) become zero. For this specific setup
tainty budget for this bridge. the detection transformers are read out by a 2 channel lock-in
An inductive voltage drop will occur due to the bias cur- amplifier (HF2LI, Zurich Instruments) and the outputs of this
rent at the signal frequency and the inductance of the coplanar device are used for the current injection. The 10 kΩ resistors
wave guide in which the Josephson junctions are arranged. The in the current arms reduces the influence of the stability and
3Meas. Sci. Technol. 32 (2021) 065007 S Bauer et al
B ZN
CL
CH 2
PL1
PL2 PH2
I≅0
C H1 PH1
I1 I2
x60
100:1 Current low noise
Current 100:1
10 kΩ
10 kΩ
IPH1≅ 0 IPH2≅ 0
detection detection
D1 D Main D2
Detector
Current U1 = 100 mV U2 = 100 mV + δU Current
F F
injection injection
X X
S1 X X S2
X
Icomp1 Icomp2
X
X X
F F
Figure 3. Schematic diagram of the impedance bridge setup. The QHR device is connected in a triple-series connection [20] and located
inside a cryomagnet system at 4.2 K. The two Josephson junction arrays (represented as XXXX) are located inside a liquid Helium Dewar
and providing the potential definition for both impedances. The current inside the potential lines is measured over 100:1 detection
transformer (D1 and D2 ). The measurement current is provided by two function generators (S1 and S2 ) over an injection transformer with a
10 kΩ resistor in series. In each mesh an active equalizer (represented as black circles around the coaxial cables) is installed to ensure the
coaxiality of the bridge. The measured signal is amplified by a low noise pre-amplifier by a factor of 60 © 2020 IEEE. Reprinted, with
permission, from [17].
noise of the function generators by the ratio of the output res- Compared to impedance bridges using room-temperature
istance of the JAWS system to the 10 kΩ resistors as described resistance standards as reference, the combination of an
in detail in [14]. Typically the output resistance of the JAWS is impedance bridge and a quantized Hall resistance offers a
dominated by the connecting cable and is on the order of 1 Ω. much lower noise level due to the temperature of 4.2 K of the
The potential definitions are provided by the two JAWS sys- QHR. The expected noise can be calculated by:
tems where U 1 is fixed to 100 mV and the amplitude and the
phase angle of U 2 is adjusted to minimize the reading of the √
main detector. We used a low noise pre-amplifier [26] with a eN = e2N (PA) + e2N (QHR) + e2N (Z), (1)
gain of approx. 60 to reduce the influence of the input noise of
the commercial lock-in amplifier (MFLI, Zurich Instruments) where eN (PA) is the equivalent input noise of the pre-
used. The amplification factor is sufficiently stable over the amplifier, eN (QHR) the noise of the quantized Hall resist-
measurement and the absolute value did not have to be known ance and eN (Z) the noise of the impedance under test. For a
in advance, since it is included in the sensitivity measurement capacitance standard the equivalent noise can be assumed as
as explained later. zero in the first order. The gain of the preamplifier reduces
The 10 MHz clock of the PPG and the function generators the contribution from√ the lock-in amplifier to the overall
are linked to the optical 10 MHz reference signal provided by noise to 0.001 nV/ Hz and is therefore not included in
the time and frequency division of PTB. The PPG not only equation (1). √
provides the pulse streams for the JAWS but also the reference The measurement shows a noise of (1.8 ± 0.2) nV/ Hz
signal for the lock-in amplifiers, which therefore measuring at for a comparison of a 10 nF capacitance standard and
exactly the same frequency as the output signal of the Joseph- the QHR. √ The calculated noise for this configuration is
son voltage standards. 1.82 nV ( Hz)−1 . For a ratio measurement using a 12.9 kΩ
4Meas. Sci. Technol. 32 (2021) 065007 S Bauer et al
10 Measurement 12.9 kΩ
theoretical noise
Measurement 10 nF
theoretical noise
Allan deviation / nV
1
0.1
Figure 5. Low part connection of the impedance bridge. The two
current cables of the triple-series connection are connected to the
current low connection of the impedance (ZN ). The potential cable
0.01 of the QHR is connected to the potential low of ZN . The admittance
1 10 100 1000 YC and impedance ZC belong to the potential low cable. The sum of
time / s the detector admittance and of all connecting cables of the low part
of the bridge is represented as Y. The outer conductor is omitted for
clarity.
Figure 4. Plot of the Allan deviation for the measurement of a
10 nF capacitance standard and a 12.9 kΩ each against the QHR at
4.2 K. The Allan deviation was calculated from the pre-amplifier
input signal taking the measurement bandwidth of lock-in amplifier After this forward measurement the impedances are inter-
into account. This was 0.156 Hz for the QHR to the 12.9 kΩ changed by changing the potential high and current high
resistance measurement and 0.391 Hz for the measurement of the connections of the bridge from one impedance to the other.
10 nF capacitance standards to the QHR. Now the bridge is rebalanced as described above and a
reversed measurement is carried out.
resistance standard temperature stabilized 30 ◦ C and the Due to the properties of a QHR in a triple-series connec-
√ at − tion [20], the current in the potential defining terminal is so
QHR, the setup showed (14.9 √ ± 0.4) nV ( Hz) 1
and the cal-
culated noise is 14.8 nV ( Hz)−1 . This clearly shows that small that the direct contribution of the lead and contact res-
there is no significant additional noise generated by the setup istances becomes negligible and the effect of the lead capa-
(e.g. no electrical interference from function generators or citive current is considered as a conventional and very small
other components). This can also be seen from the Allan devi- cable correction. This offers the opportunity to omit a Kelvin
ations as shown in figure 4. combining network at the low side of the bridge which is usu-
ally needed in 4-TP impedance bridges. The currents of the
inner conductors of the three cables at the low side of the
2.3.1. Bridge balance procedure. During the first measure- QHR were measured to ensure that the current in the poten-
ments with this system the bridge was balanced manually. tial low connection is sufficiently small. The measurement
After the two Josephson voltages were applied, the output sig- was carried out using a 100:1 current detection transformer
nals of the function generators (S1 and S2 ) were set such that which detection voltage was read by a lock-in amplifier. The
the readings of the current detectors (D1 and D2 ) were minim- remaining current inside the low potential lead is 1.4 × 10⁴
ized. In the next step the phase between both JAWS systems times smaller than the measurement current and hence influ-
was adjusted to minimize the reading of the main detector. ences the measurement only by about 5 parts in 109 , for a sum
Then, the voltage U 1 was changed temporarily by 10−4 V/V to of cable and contact resistance of about 1 Ω. Nevertheless,
measure the change in detector reading and to properly adjust this influence will not limit our results in this measurement
the reference phase of the lock-in amplifier. From the change campaign.
in detector voltage UD and the known change of U 1 , the sensit- The model equation of the impedance bridge can be derived
ivity coefficient S can be determined to quantify how much the by Kirchhoff’s law. The impedance ratio can be calculated by
detector reading will change if the ratio of the applied voltages summing all currents in node D of figure 5:
or the impedance ratio changes by a certain amount. With this
sensitivity coefficient and the previous reading of the main ZN UN UD
=− + · S, (2)
detector, a new voltage U 2 was calculated and applied. This ZQHR UQHR UQHR
procedure was repeated until the main detector reading was
( )
typically below 100 nV (250 nV at maximum). The detector ZN
signal UD was used together with the measured sensitivity S S = G−1 · 1 + ZN (Y + Yc ) + , (3)
ZQHR
and the voltage ratio applied to calculate the impedance ratio
using equation (2). The remaining signal at the input of the where ZN is the impedance to be compared with the imped-
detector corresponds typically to a correction of some parts in ance of the QHR (ZQHR ) and S the sensitivity coefficient. Y
108 . The detector signal and the sensitivity coefficient must be is the sum of all admittances of the connecting cables at the
known to about 1% to achieve an uncertainty of the balance low side and that of the pre-amplifier. UN and UQHR are the
itself of 1 part in 109 . voltages applied to the impedances. UD the voltage measured
5Meas. Sci. Technol. 32 (2021) 065007 S Bauer et al
at the input of the detector and G the amplification factor of the capacitance standards allowed us to investigate the proper-
pre-amplifier. For almost all practical setups the contribution ties of the graphene QHR, e.g. at different magnetic fields.
of Zc /2 will not influence the sensitivity coefficient to a level The capacitance standards were measured against a 1 nF capa-
higher than 10−3 for frequencies up to 100 kHz. Therefore, citance standard linked to a GaAs QHR. This was carried
this term is assumed as zero in equation (3). out four times over a period of 112 days using PTBs clas-
Equation (3) can be used to calculate the sensitivity coef- sical 10:1 ratio bridge based on inductive voltage dividers
ficient of the impedance bridge. For this purpose the capacit- (IVD) [7]. Both standards show a drift of less than ±2 × 10⁻⁹
ance of the connecting cables at the low side was measured per day.
using a commercial LCR meter. For a comparison of a 10 nF The first measurements were carried out to determine the
capacitance standard and the QHR at 1233.15 Hz a coefficient deviation of the quantized Hall resistance at AC from its quant-
of 0.0281 is measured and is in sufficient agreement with the ized DC value. This was performed in a quadrature meas-
one of 0.0278 predicted by equation (3). In the case of a ratio urement at 1233.15 Hz. To find the best operating point for
measurement of QHR and a 12.9 kΩ resistance standard the the QHR the impedance bridge was balanced with the QHR
measured value is 0.034 and agrees well with the calculated operated at −12 T and 4.2 K. Then the magnetic field was
value of 0.0355. Combining the sensitivity coefficient with the slowly changed to −2.5 T at a constant rate of 0.15 T min−1
noise level of the bridge gives the achievable Type A uncer- without re-balancing the bridge. From the lock-in reading, the
tainty of the setup. This is at a measurement time of 100 s, change in resistance of the QHR can be calculated since the
1.9 nF/F for the measurement with the QHR and a 10 nF capa- value of the capacitor will stay unchanged during this meas-
citance standard and 12 nΩ/Ω for the ratio measurement with urement. Compared to measurements in a ratio bridge against
a 12.9 kΩ resistance standard. a room-temperature resistance standard, this method profits
When the bridge is perfectly balanced (UD = 0) equation from much lower noise and hence, needs only half of the meas-
(2) simplifies to the well-known relation, where the ratio urement time (typically 1 h compared to 2 h). Even if the abso-
of the impedances is given by the ratio of the voltages lute accuracy of the new 4-TP bridge is not yet evaluated and
applied: these measurements are carried out without interchanging the
impedances, they provide an important insight to the QHR
ZN UN
=− . (4) sample. By this procedure the device can be investigated and
ZQHR UQHR
shows in the ideal case a region where the resistance is inde-
With the set of forward and reversed measurements as pendent of the magnetic field. For example, the influence of
described above, effects like cable loading or small voltage different geometries of the devices can be measured and com-
bias cancel out as long as they are stable over time. The pared.
impedance ratio can be calculated as described in detail in the The results for four different charge carrier densities, set as
appendix of [16]: describes in section 2.2, can be seen in figure 6. The meas-
urements show that for all except the highest carrier dens-
√( ) ( )
ity, the deviation from the quantized resistance value is within
ZN ZN ZN ±5 × 10⁻⁸ for magnetic fields between −10 T and −12 T tak-
= (5) ing the calculated cable correction of the setup into account.
ZQHR ZQHR F ZQHR R
where F and R denotes the ratio obtained by the forward and The value of the graphene QHR was measured multiple
the reverse measurement respectively. The ratios themselves times against two 10 nF capacitance standards at 1233.15 Hz
are calculated according to equation (2). and a fixed magnetic field of −12 T. The results for dif-
ferent charge carrier densities are shown in figure 7. Also
these results are all within ±5 × 10⁻⁸ of the DC quantum
3. First measurement results Hall value. The scattering of the data points and also the
change of the mean value with respect to the charge car-
All measurements were carried out in the DC QHR laboratory rier density can be related to properties of the sample that
of PTB. The JAWS system was moved to the QHR lab and change with thermal cycling or to the reproducibility of the
operated in a liquid helium Dewar. In this proof of principle bridge. The latter will be investigated in the next evaluation
measurement, we focused on the in-phase component or real of the bridge. This type of measurement will be used with
part of the impedance ratio. The imaginary part of the imped- a new cryo magnet at 4.2 K to investigate new graphene
ance ratio needs much more detailed and careful investigations QHR samples and to determine the deviation of the quant-
due to the influence of an inductive voltage drop of the JAWS. ized Hall resistance at AC from its DC value at differ-
This is out of the scope of this paper. ent frequencies once the full evaluation of the bridge is
performed.
3.1. Linking capacitance standards to the QHR
Within this measurement campaign two 10 nF capacitance
3.2. Linking resistance standards to the QHR
standards were measured against the QHR. Beside testing the
new bridge setup, these measurements were also used to test The bridge was also used to compare a 12.9 kΩ resistance
new graphene based QHR devices [25]. The calibrated 10 nF standard with the graphene QHR in a ratio measurement.
6Meas. Sci. Technol. 32 (2021) 065007 S Bauer et al
400 9.3
300 CCC
4-TP (1233.15 Hz)
200 9.2
100
0 9.1
ΔR/RH / μΩ/Ω
ΔR/RH / nΩ/Ω
-100 0.065 μΩ/Ω
-200 9.0
-300
-400 8.9
-500
-600 8.8
-700 ΔR/R (n = 1.01 × 1011 cm-2)
ΔR/R (n = 1.51 × 1011 cm-2)
-800 8.7
ΔR/R (n = 2.35 × 1011 cm-2) 0 30 60 90 120 150 180
-900 ΔR/R (n = 3.12 × 1011 cm-2)
-1000 Days since 1st March 2020
-12 -10 -8 -6 -4
Figure 8. Plot of the stability of a 12.9 kΩ resistance standard
mag. field / T measured against a 10 nF capacitance standard using the QHR as
transfer standard. The drift over time was also measured with a
Figure 6. Magnetic field dependence of a quantized Hall resistor. 14bit CCC at DC. The measured frequency dependence of the
The impedance bridge was balanced at −12 T and then the field was 12.9 kΩ resistance standard was corrected. Cable corrections were
swept with a rate of 0.15 T min−1 . The lock-in reading was used to not accounted for as they are almost the same in both measurements
measure the change in the resistance value of the QHR device. The at AC and hence cancel out for the time dependence of the standard.
plot shows the relative difference between the measured resistance The error bars corresponds to the Type A uncertainties for the
and the nominal value of the quantized Hall resistance RH at the i = measurements with the impedance bridge and the combined
2 plateau. uncertainty (k = 1) for the CCC measurements.
50 C1 Mean C1 were carried out at 1233.15 Hz and at the maximum field
11
n=1.51×10 cm -2 C2 Mean C2 of −12 T. Moreover, the resistance standard was measured
40
n=1.01×1011 cm-2
four times at DC with a 14bit cryogenic current compar-
30 ator (CCC) against the national resistance standard of PTB.
n=2.35×1011 cm-2 n=3.12×1011 cm-2
20
Figure 8 shows the stability of the resistance standard meas-
ΔR/RH / nΩ/Ω
ured against the 10 nF capacitance standard using the graphene
10 QHR as a transfer standard at 1233.15 Hz. The daily drift
0 determined for both methods by a linear fit is in perfect
agreement:
-10
-20 (−3.03 ± 0.23) nΩ/Ω (4-TP)
-30
(−3.08 ± 0.10) nΩ/Ω (CCC).
-40
The frequency dependence of the resistance standard was
-50
measured with an IVB ratio bridge against a reference res-
ay
ch
ril
istor. This was done in a frequency range between 1 and 5 kHz.
Ap
M
ar
M
Even though the frequency dependence of the resistance stand-
Date ard was taken into account, the difference between the values
measured with the 4-TP bridge deviates 65 nΩ/Ω from those
Figure 7. Overview of the measurements linking the QHR and two
10 nF capacitance standards. The measurements were carried out
measured with the CCC. The reason for this can e.g. be caused
with four different charge carrier densities of the QHR. The round by a non-linear frequency dependence at lower frequencies.
symbols denote one single set of forward and revered measurement. Further measurements are needed to resolve the origin of this
The mean value over all measurements at one carrier density is deviation. Nevertheless, the excellent agreement for the daily
shown as star. drift of the resistance standard between both systems shows
that the 4-TP JAWS impedance bridge already has a high flex-
ibility and reproducibility.
Since the deviation of the QHR device from its DC value
was already measured by the previous described quadrat- 4. Conclusion and outlook
ure measurements, we can use these results to determ-
ine the value of the resistance standard. In this case the The setup and measurements presented here prove the
graphene QHR acts as a transfer standard. All measurements principle that the combination of a quantized Hall resistance
7Meas. Sci. Technol. 32 (2021) 065007 S Bauer et al
with a 4-TP JAWS impedance bridge leads to a compact setup M Kruskopf https://orcid.org/0000-0003-2846-3157
that works well without √ a combining network. Also the noise J Lee https://orcid.org/0000-0002-7382-8584
level of (1.8 ± 0.2) nV ( Hz)−1 of the setup was as low as L Palafox https://orcid.org/0000-0001-7663-856X
predicted by theory. The QHR device showed a deviation from Y Pimsut https://orcid.org/0000-0001-9210-6512
the quantized value of ±5 × 10⁻⁸ at 1233.15 Hz in a compar- J Schurr https://orcid.org/0000-0001-7985-5770
ison with 10 nF capacitance standards calibrated via our con-
ventional GaAs based QHR and IVD bridges [7]. Our first
AC measurements with graphene based quantized Hall res-
istances at 4 K show very promising results for the charac- References
terization with capacitance and resistance standards. Using a
[1] Overney F and Jeanneret B 2018 Impedance bridges: from
quadrature measurement of the QHR against a capacitance Wheatstone to Josephson Metrologia 55 S119–S134
standards allows us to carry out magnetic field sweeps with [2] Jeckelmann B and Jeanneret B 2001 The quantum hall effect
lower noise and even reduces the measurement time compared as an electrical resistance standard Rep. Prog. Phys.
to ratio bridges using room-temperature resistance standards. 64 1603–55
This will be used to investigate upcoming graphene QHR [3] Schurr J, Ahlers F and Kibble B P 2012 The ac quantum Hall
resistance as an electrical impedance standard and its role in
samples and to give important feedback to the manufacturing the SI Meas. Sci. Technol. 23 124009
process. [4] Rigosi A F and Elmquist R E 2019 The quantum hall effect
Within ratio measurements, the time dependent drift of in the era of the new SI Semicond. Sci. Technol.
a 12.9 kΩ resistance standard was determined in a substitu- 34 093004
tional measurement and agreed within the fit uncertainty of [5] Thompson A and Lampard D 1956 A new theorem in
electrostatics and its application to calculable standards of
0.23 nΩ/Ω with the measurements of a 14bit CCC. This gives capacitance Nature 177 888–888
a first impression of the reproducibility of the setup. Still the [6] Gibbings D L H 1963 A design for resistors of calculable
deviation between data points is higher than the Type A uncer- a.c./d.c. resistance ratio Proc. Inst. Electr. Eng. 110 335–47
tainty which may be caused by a non-optimal manual bal- [7] Schurr J, Bürkel V and Kibble B P 2009 Realizing the Farad
ance of the bridge, problems with the bridge setup itself or from two ac quantum Hall resistances Metrologia 46 619
[8] Kucera J, Svoboda P and Pierz K 2019 AC and DC quantum
unaccounted cable effects within the cryostat due to different hall measurements in GaAs-based devices at temperatures
helium levels. up to 4.2 K IEEE Trans. Instrum. Meas. 68 2106–12
In the next step, we will use a new cryomagnet system [9] Tzalenchuk A et al 2010 Towards a quantum resistance
which is dedicated for AC measurements with graphene QHR standard based on epitaxial graphene Nat. Nanotechnol.
samples. With this system we will evaluate and optimize the 5 186–9
[10] Rigosi A F et al 2019 Graphene devices for tabletop and
JAWS 4-TP bridge and new graphene QHR samples. A full high-current quantized hall resistance standards IEEE
evaluation of this bridge will be performed to set up an uncer- Trans. Instrum. Meas. 68 1870–8
tainty budget for multiple frequencies. [11] Ahlers F et al 2014 The emrp project graphohm—towards
quantum resistance metrology based on graphene 29th
Conf. Precision Electromagnetic Measurements (CPEM
Acknowledgments 2014) pp 548–9
[12] Callegaro L et al 2020 The EMPIR project GIQS: graphene
impedance quantum standard 2020th Conf. Precision
The authors would like to thank Marco Kraus for fruitful dis- Electromagnetic Measurements (CPEM) 24–28 August
cussion and Niklas Abraham, Judith Felgner, Susanne Gruber, 2020 (IEEE) (https://doi.org/10.1109/CPEM49742.
Gerhard Muchow, Eckart Pesel, Kathrin Störr, Thomas 2020.9191743)
Weimann for technical assistance. This work was suppor- [13] Benz S P and Hamilton C A 1996 A pulse-driven
ted in part by the Joint Research Project GIQS (18SIB07). programmable Josephson voltage standard Appl. Phys. Lett.
68 3171–3
This project received funding from the European Metro- [14] Overney F, Flowers-Jacobs N E, Jeanneret B, Rüfenacht A,
logy Programme for Innovation and Research (EMPIR) co- Fox A E, Underwood J M, Koffman A D and Benz S P
financed by the participating states and from the European 2016 Josephson-based full digital bridge for high-accuracy
Unions’ Horizon 2020 Research and Innovation Pro- impedance comparisons Metrologia 53 1045
gramme. The work of Y. Pimsut was supported by the [15] Bauer S, Behr R, Hagen T, Kieler O, Lee J, Palafox L and
Schurr J 2017 A novel two-terminal-pair pulse-driven
Braunschweig International Graduate School of Metrology Josephson impedance bridge linking a 10 nF capacitance
(B-IGSM). standard to the quantized hall resistance Metrologia
54 152–60
[16] Overney F, Flowers-Jacobs N, Jeanneret B, Rüfenacht A,
ORCID iDs Fox A, Dresselhaus P and Benz S 2020 Dual Josephson
impedance bridge: towards a universal bridge for
S Bauer https://orcid.org/0000-0001-6242-2223 impedance metrology Metrologia 57 065014
R Behr https://orcid.org/0000-0002-5480-443X [17] Bauer S, Pimsut Y, Behr R, Kieler O, Kruskopf M, Palafox L,
R E Elmquist https://orcid.org/0000-0001-9041-7966 Lee J and Schurr J 2020 AC quantum hall resistance
combined with a four-terminal pair pulse-driven Josephson
M Götz https://orcid.org/0000-0001-8464-0651 impedance bridge 2020th Conf. Precision Electromagnetic
J Herick https://orcid.org/0000-0001-9441-7699 Measurements (CPEM 2020) 24–28 August 2020 (IEEE)
O Kieler https://orcid.org/0000-0001-5193-8910 (https://doi.org/10.1109/CPEM49742.2020.9191895)
8Meas. Sci. Technol. 32 (2021) 065007 S Bauer et al
[18] Benz S P, Burroughs C J and Dresselhaus P D 2001 AC [23] Rigosi A F et al 2019 Gateless and reversible Carrier
coupling technique for Josephson waveform synthesis IEEE density tunability in epitaxial graphene devices functiona-
Trans. Appl. Supercond. 11 612–16 lized with chromium tricarbonyl Carbon
[19] Bauer S, Behr R, Kieler O, Lee J, Palafox L and Schurr J 2018 142 468–74
progress on PTB’s pulse-driven Josephson impedance [24] Kruskopf M, Rigosi A F, Panna A R, Patel D K, Jin H,
bridge combined with an AC quantum hall resistance Marzano M, Berilla M, Newell D B and Elmquist R E 2019
2018th Conf. Precision Electromagnetic Measurements Two-terminal and multi-terminal designs for
(CPEM 2018) next-generation quantized hall resistance standards: contact
[20] Delahaye F 1993 Series and parallel connection of material and geometry IEEE Trans. Electron. Devices
multiterminal quantum Hall effect devices J. Appl. Phys. 66 3973–7
73 7914–20 [25] Kruskopf M et al 2020 Graphene quantum hall effect devices
[21] Jeanneret B 2001 AC QHR sample holder, final report of for AC and DC resistance metrology 2020th Conf.
Euromet project 540, reg. no. 540 Tech. rep. EURAMET Precision Electromagnetic Measurements (CPEM 2020)
(available at: www.euramet.org/technical- submitted (IEEE) (https://doi.org/10.1109/
committees/tc-projects/) CPEM49742.2020.9191851)
[22] Kruskopf M and Elmquist R E 2018 Epitaxial graphene [26] Schurr J, Moser H, Pierz K, Ramm G and Kibble B P 2011
for quantum resistance metrology Metrologia Johnson-Nyquist noise of the quantized Hall resistance
55 R27–R36 IEEE Trans. Instrum. Meas. 60 2280–5
9You can also read