A Hidden Markov Model-Based Acoustic Cicada Detector for Crowdsourced Smartphone Biodiversity Monitoring
←
→
Page content transcription
If your browser does not render page correctly, please read the page content below
Journal of Artificial Intelligence Research 51 (2014) 805-827                           Submitted 5/14; published 12/14

        A Hidden Markov Model-Based Acoustic Cicada Detector for
            Crowdsourced Smartphone Biodiversity Monitoring

Davide Zilli                                                                       DZ 2 V 07@ ECS . SOTON . AC . UK
Oliver Parson                                                                           OSP @ ECS . SOTON . AC . UK
Geoff V Merrett                                                                        GVM @ ECS . SOTON . AC . UK
Alex Rogers                                                                             ACR @ ECS . SOTON . AC . UK
University of Southampton
Southampton, SO17 1BJ, UK

                                                            Abstract
            In recent years, the field of computational sustainability has striven to apply artificial intelli-
      gence techniques to solve ecological and environmental problems. In ecology, a key issue for the
      safeguarding of our planet is the monitoring of biodiversity. Automated acoustic recognition of
      species aims to provide a cost-effective method for biodiversity monitoring. This is particularly
      appealing for detecting endangered animals with a distinctive call, such as the New Forest cicada.
      To this end, we pursue a crowdsourcing approach, whereby the millions of visitors to the New
      Forest, where this insect was historically found, will help to monitor its presence by means of a
      smartphone app that can detect its mating call. Existing research in the field of acoustic insect
      detection has typically focused upon the classification of recordings collected from fixed field mi-
      crophones. Such approaches segment a lengthy audio recording into individual segments of insect
      activity, which are independently classified using cepstral coefficients extracted from the recording
      as features. This paper reports on a contrasting approach, whereby we use crowdsourcing to collect
      recordings via a smartphone app, and present an immediate feedback to the users as to whether an
      insect has been found. Our classification approach does not remove silent parts of the recording
      via segmentation, but instead uses the temporal patterns throughout each recording to classify the
      insects present. We show that our approach can successfully discriminate between the call of the
      New Forest cicada and similar insects found in the New Forest, and is robust to common types
      of environment noise. A large scale trial deployment of our smartphone app collected over 6000
      reports of insect activity from over 1000 users. Despite the cicada not having been rediscovered in
      the New Forest, the effectiveness of this approach was confirmed for both the detection algorithm,
      which successfully identified the same cicada through the app in countries where the same species
      is still present, and of the crowdsourcing methodology, which collected a vast number of recordings
      and involved thousands of contributors.

1. Introduction
The field of computational sustainability, which seeks to apply computer science and artificial intel-
ligence to issues of sustainability, has received great attention in recent years as our planet is under
ever stronger environmental, societal and economical pressure (Quinn, Frias-Martinez, & Subra-
manian, 2014; Gomes, 2009). Work in this field has striven to bring artificial intelligence research
to the real world, implementing practices to promote the sustainability of our environment and to
safeguard its living organisms. Towards this goal, the first step is the monitoring of biodiversity,
that is the variety of living species in a given environment. Biodiversity is a key measure of the
health of an ecosystem, and as land-use and climate change impact on the natural environment,

c 2014 AI Access Foundation. All rights reserved.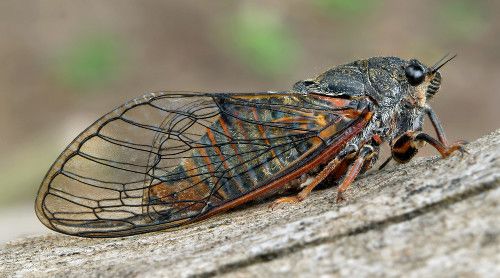
Z ILLI , PARSON , M ERRETT & ROGERS

    Figure 1: Cicadetta montana. Photograph by Jaroslav Maly, reproduced with permission.

many countries are increasingly seeing the need to monitor and protect it. For example, the UK has
formalised this endeavour within the UK Biodiversity Action Plan and has established a priority
species list to focus work on a small number of critically important species (Joint Nature Conserva-
tion Committee, 2010). One of these, of particular interest in this paper, is the New Forest cicada
(Cicadetta montana s. str., see Figure 1), the only native cicada known to the UK, which was first
identified in the New Forest, a national park on the south coast of England, in 1812. Despite being
well studied at a number of sites in the 1960s, there has been no confirmed observation of the New
Forest cicada in the last 20 years (Pinchen & Ward, 2002). Understanding whether this is simply
due to the migration of the cicada to as yet undiscovered sites, or whether the cicada is now extinct
in the UK due to climate change or land-use change, is an important question for UK biodiversity
research.
    Today, traditional approaches for searching for rare species typically require trained ecologists
to perform detailed manual surveys. However, the obvious costs of such work have led to significant
recent research into automated approaches whereby animals and plants can be classified remotely
without requiring that trained experts be in the field. In the case of insects, this is most often
performed by deploying fixed sensors with sensitive microphones that record the sounds (or calls)
emitted by the insects (MacLeod, 2007). These recordings are then analysed later to automatically
identify the insects whose calls were captured. The algorithms for such classification typically range
from those that operate solely in the time domain, such as time domain signal coding (Chesmore,
2004; Chesmore & Ohya, 2004), to those inspired by the literature of human speech recognition
(for example Potamitis, Ganchev, & Fakotakis, 2006; Pinhas, Soroker, Hetzoni, Mizrach, Teicher, &
Goldberger, 2008). The latter typically use a Gaussian mixture model or a hidden Markov model for
classification (Leqing & Zhen, 2010), and perform a number of pre-processing stages, often taken
directly from the human speech recognition literature, to extract features from the raw recording.
For example, Chaves, Travieso, Camacho, and Alonso (2012) present a state-of-the-art approach
that pre-processes the recorded sound to remove un-sounded periods where no insect call is detected,
before mapping the raw frequencies to the mel scale, which better represents human hearing. The
approach then converts mel scale features back into a pseudo-time domain, called the cepstrum, by
calculating a number of mel frequency cepstral coefficients (MFCC), that are then used as features

                                                 806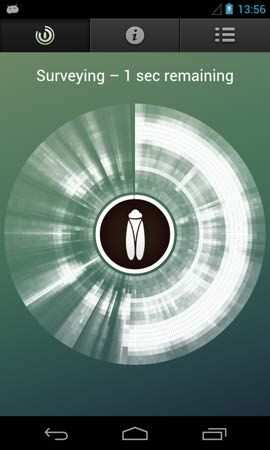
A N HMM ACOUSTIC C ICADA D ETECTOR FOR C ITIZEN S CIENCE

for the hidden Markov model (HMM) classification. Such approaches have been shown to classify
insects to very high levels of accuracy from clean recordings collected using purpose-built hardware.
     The use of such automatic acoustic recognition is particularly appealing in the case of the New
Forest cicada, since this insect has a particularly loud high-pitched mating song which, while being
close to the upper frequency limit of a normal adult’s hearing range and inaudible to most adults
over 40 years of age, can easily be detected by conventional microphones. However, the use of
fixed sensors to collect these recordings for later analysis is less compelling. The New Forest covers
600 km2 , and would require tens of thousands of sensors to exhaustively survey it for potential
cicada breeding sites. Furthermore, since the cicada only emits its mating call during the months of
June and July, any approach must be able to survey a large area over a short space of time, further
decreasing the applicability of fixed sensors.
     To address this challenge, we pursue a different approach, which aims to exploit the 13 mil-
lion day visits to the New Forest that occur each year by the general public to crowdsource the
search for the New Forest cicada using a smartphone app. The involvement of the general public
in the collection of observations about the natural environment is by no means a recent practice,
as records of farmers and clergymen devoted to this activity date back centuries (Miller-Rushing,
Primack, & Bonney, 2012; Brenna, 2011). The start of more structured collection of data, similar
to what we know today as the practice of citizen science, can be attributed to the beginning of the
20th century, with events such as the Christmas Bird Count and the foundation of the American As-
sociation for Variable Star Observers in 1911 (Silvertown, 2009). However, the Internet has made
remote communication and collaboration far easier, and the widespread adoption of smartphones
has greatly facilitated the cooperation of amateur scientists around the world to collect and process
large amounts of data. In ecology, this method has been a vehicle for such a wide participation of
citizens that a plethora of different initiatives has proliferated in the last decade (see for example
the survey paper, Dickinson, Zuckerberg, & Bonter, 2010). An example of this is the iRecord La-
dybirds app (Nature Locator, 2013), a system that allows users to collect geo-located photographs
of ladybirds and helps them identify the correct species through a series of morphological and taxo-
nomic questions (e.g. colour and number of spots). Records are stored on a database and presented
on a public page. However, the app does not attempt to automate the analysis and classification
process, outsourcing the task entirely to the users. More recently, the automation of the classifica-
tion process on a portable device has been attempted for both birds and bats (Jones, Russ, Catto,
Walters, Szodoray-Paradi, Szodoray-Paradi, Pandourski, Pandourski, & Pandourski, 2009). For the
former, due to the difficulty in differentiating these calls, work is still in progress and to date no
deployed prototype exists. For the latter, a project called BatMobile (Nature Locator, 2012) is start-
ing to implement the automated detection on Apple iOS devices, but the requirement for expensive
ultrasonic microphones hinders the accessibility of the tool to the general public on a large scale.
The system we propose in this paper is therefore, to the best of our knowledge, the first deployed
real-time acoustic species recognition system to run entirely on a mobile device.
     However, crowdsourcing acoustic biodiversity using a smartphone app presents a number of
challenges. Firstly, smartphones can only be expected to collect short recordings while the user is
waiting (30 seconds in our case), in contrast with the always-on recordings collected from fixed
sensors. Such fixed sensors would generate much longer recordings (in the order of hours and
days) and as a result, existing classification methods are required to automatically remove silent
periods from the recording. As a side effect, this can also remove useful time-domain information
that can be used to easily differentiate insects with similar frequency calls, especially in lower

                                                 807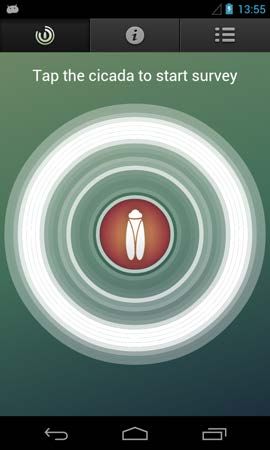
Z ILLI , PARSON , M ERRETT & ROGERS

quality recordings from a smartphone. This makes existing methods unsuitable for our purpose.
Furthermore, the smartphone app would require that the algorithm provides some real-time feedback
to the user as to the identification of the insect being heard. This allows the user to be requested
to collect a recording if a cicada is detected, and conversely the user is not required to upload
unnecessary recordings if a cicada is not detected1 . However, low-end mobile devices have limited
processing capabilities compared to that of high-end servers, and therefore the previously proposed
complex feature extraction methods are not suitably efficient to be run in real-time. In addition, it
is essential for an acoustic cicada detector to be able to discriminate between the call of the New
Forest cicada and that of other insects commonly found in the New Forest. Two examples of insects
with similar calls are the dark bush-cricket, whose call is of a similar pitch to the New Forest cicada
but instead chirps with a duration of typically only 0.1 seconds; and the Roesel’s bush-cricket,
whose call is similar in duration to the New Forest cicada but covers a broader frequency band.
Although this scenario involves the detection of relatively few insects compared to existing work,
the challenge is to design an approach which can be deployed to the field via low cost hardware for
the rediscovery of the New Forest cicada.
     Therefore, in this paper we present an algorithm, which we call the Cicada Detection Algorithm
(CDA), specifically intended for real-time detection of the New Forest cicada on computationally
constrained smartphones. Rather than calculating a number of cepstral coefficients as in existing
work, we use the Goertzel algorithm to calculate the magnitude of specific frequency bands, which
is an efficient method for approximating individual terms of a discrete Fourier transform (DFT)
(Goertzel, 1958). We extract the following three frequency bands: the first centred at 14 kHz
corresponding to the strongest frequency component of the calls of the New Forest cicada and the
dark bush-cricket, the second centred at 19 kHz, where both the dark bush-cricket and the Roesel’s
bush-cricket are still present, but the cicada is not, and the third centred at 8 kHz, which is far
from both general background noise (mostly lower than 5 kHz) and the insects’ calls. We then
calculate the following two features which form the input to the hidden Markov model: the ratio
between 14 kHz and 8 kHz to distinguish between the New Forest cicada and white noise across
all frequencies, and the ratio between 19 kHz and 14 kHz to distinguish between the New Forest
cicada and the dark bush-cricket. Next, we use a five-state hidden Markov model which explicitly
represents the idle period between insect calls, the calls of the New Forest cicada, dark bush-cricket
and Roesel’s bush-cricket, and also the short pauses during the dark bush-cricket’s call. Hence,
rather than attempting to independently classify individual segments of insect calls using a complex
set of features, we exploit the temporal patterns present throughout the recording using the HMM.
We then use the Viterbi algorithm to identify the most likely sequence of insect calls throughout a
recording.
     We evaluate our approach using 235 recordings of 30 seconds each in duration collected from
the New Forest and Slovenia (where the same species of cicada is still present). Unlike standard
library recordings, our data set represents the range of crowdsourced data that we are likely to
encounter, exhibiting significant noise (e.g. handling noise, road traffic noise, human voice and
noise generated by the wind), and insect calls of varying amplitude depending on the proximity of
the recording device to the specimen. We show that our approach is able to classify the call of the
New Forest cicada in normal environmental conditions with an F1 score of 0.82. Since existing
approaches are designed for the batch processing of significantly longer recordings, we compare
 1. A 30s mono recording at 44,100 samples per second, is about 2.7MB; a significant file to upload in areas with poor
    mobile phone reception where connection rates may be down to 100kbps or less.

                                                        808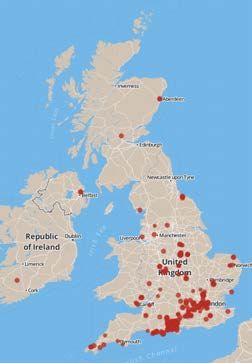
A N HMM ACOUSTIC C ICADA D ETECTOR FOR C ITIZEN S CIENCE

             20
             15
Freq (kHz)

             10
             5
             0
             1
Amplitude

             0
             -1
                  00:05    00:10      00:15      00:20     00:25       00:30      00:35      00:40
                                                  Time (mm:ss)

 Figure 2: Spectrogram and waveform of a New Forest cicada call (recording by Jim Grant, 1971
 and courtesy of the British Library, wildlife sounds collection).

 our approach to three variants in order to evaluate the benefit of various components of the pipeline.
 Our results show that our feature extraction procedure is robust to noise, to the call of the Roesel’s
 bush-cricket and to the call of the dark bush-cricket, and therefore satisfies the requirements of our
 deployment environment.
     This algorithm was implemented on a mobile app, developed for iOS and Android, which was
 downloaded over 1500 times by members of the public. This culminated in a large-scale trial de-
 ployment, with citizen scientists submitting over 6000 reports worldwide. Although the New Forest
 cicada was not found in this first phase, the accuracy of the detection algorithm and wide geographi-
 cal coverage achieved via crowdsourcing clearly motivate a second phase of deployment. The same
 approach can also be applied to the monitoring of many other singing species, and an app that can
 recognise all British Orthoptera is currently under development.
     A preliminary version of our proposed method has also been compared to a state-of-the-art
 approach for batch classification of insects proposed by Chaves et al. (2012). The comparison,
 presented by Zilli, Parson, Merrett, and Rogers (2013), shows that our method is considerably more
 computationally efficient, and therefore better suited for real-time operation. The method proposed
 in this paper has further improved accuracy and efficiency over that presented in Zilli et al.
     The remainder of this paper is organised as follows. In Section 2 we describe our proposed
 approach, highlighting the different techniques used. In Section 3 we analyse its performance using
 hundreds of smartphone recordings. In Section 4 we present the first phase of deployment of our
 approach as a smartphone application, and analyse the coverage of reports collected to date. Finally,
 we conclude in Section 5 along with our plans for a second phase of deployment to ensure a more
 complete coverage of the New Forest.

 2. Real-Time Insect Detection Using Hidden Markov Models
 We now give a description of our proposed approach for real-time insect detection. We first describe
 an efficient method by which individual terms of a DFT can be extracted from raw audio recordings
 using the Goertzel algorithm. We then describe two features which can be calculated from three
 individual terms of the DFT to produce a feature vector that can discriminate between the insects
 of interest and is also robust to environment noise. Next, we formalise the classification of the ex-

                                                  809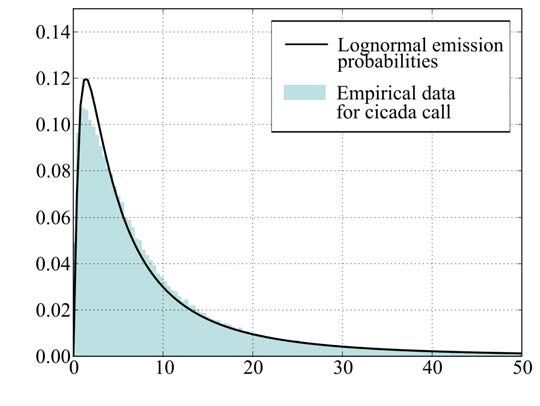
Z ILLI , PARSON , M ERRETT & ROGERS

tracted features as an inference problem over a HMM. Last, we propose a five-state HMM designed
specifically to capture the temporal patterns of the insects’ calls.

2.1 Feature Extraction Using Goertzel Algorithm
We observed strong high frequency components in the calls of each of the insects of interest. These
frequencies are sufficiently distant from any common background noise, such as wind noise, road
traffic or people speaking, to be a reliable indicator for the presence of each insect. Figure 2 shows
an example of such a frequency component, in the call of the New Forest cicada which is centred at
14 kHz. An efficient approximation of the magnitude of such frequencies can be calculated using
the Goertzel algorithm; a method that evaluates individual terms of a DFT, implemented as a second
order infinite impulse response filter.
     An efficient implementation of the Goertzel algorithm requires two steps. The first step produces
a coefficient that can be pre-computed and cached to reduce CPU cycles:

                                                         2πf
                                         c = 2 cos                                                (1)
                                                          fs

where f is the central frequency in question and fs is the sampling rate of the recording.
    The second step consists of iteratively updating the values of a temporary sequence y with any
incoming sample sn such that:

                              yn = hamming(sn ) + (c · yn−1 ) − yn−2                              (2)

where the samples are passed through a Hamming filter, given by:

                                                                       2πsn
                            hamming(sn ) = 0.54 − 0.46 cos                                        (3)
                                                                       N −1

and the length of the sequence of samples N determines the bandwidth B of the Goertzel filter, such
that:
                                                  fs
                                            B=4                                                  (4)
                                                  N
    A shorter sequence length N yields a larger bandwidth, at the cost of a noisier output. In
practice, we use multiples of 128 samples to match a typical smartphone’s audio recording buffer
size. For example, a block size of N = 128 samples gives a bandwidth of just under 1.4 kHz. The
magnitude m of the frequency band centred at f and with bandwidth B in time slice t is then given
by:
                                     q
                                        2 + y2
                              mt,f = yN       N −1 − c · yN · yN −1                            (5)

    In terms of computational complexity, this approach shows a considerable benefit compared to
the single-bin DFT. An efficient algorithm to compute the latter, the fast Fourier transform, has a
complexity of O(N logN ), while the Goertzel algorithm is only of order O(N ), where N is the
number of samples per window. Moreover, the sample update described in Equation 5 can be pro-
cessed in real-time, eliminating the need for an independent background thread on the smartphone
app and the need to store sample values.

                                                 810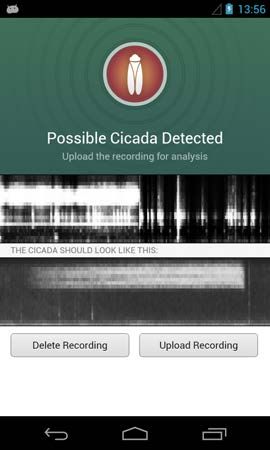
A N HMM ACOUSTIC C ICADA D ETECTOR FOR C ITIZEN S CIENCE

                           z1          z2        z3                      zT

                           x1          x2        x3                      xT

Figure 3: A hidden Markov model. Unshaded square nodes represent hidden discrete variables,
while shaded circular nodes represent observed continuous variables. Each xt is a vector of the two
features xt,1 and xt,2 .

2.2 Feature Combination Using Filter Ratio
The magnitude of the frequency component at 14 kHz is a good indicator of the presence of a
New Forest cicada, robust against most background noise, which is normally contained in the lower
5 kHz of the frequency spectrum. However, it may be sensitive to white noise that covers the entire
spectrum, such as handling noise. Furthermore, it will not be able to discriminate between the
calls of the New Forest cicada and the Roesel’s bush-cricket, both of which exhibit a prolonged
call at a similar frequency. Therefore, we extract the following three frequencies using the Goertzel
algorithm: mt,8 which represents the 8 kHz frequency which is outside the range of both the cicada
call and environmental noise, mt,14 which represents the 14 kHz frequency of both the New Forest
cicada and the dark bush-cricket, and mt,19 which represents the 19 kHz frequency of only the dark
bush-cricket and the Roesel’s bush-cricket. We then take ratios of these frequencies to produce two
features:
                                            mt,14           mt,19
                                     xt,1 =       , xt,2 =                                        (6)
                                            mt,8            mt,14

As such, at any point t, xt,1 will be high in the presence of any of the insects considered and
tend to one when either no sound is detected in the cicada range or if sound is present across
both bands. In addition, xt,2 will be high in the presence of the dark bush-cricket, and tend to
zero in the presence of the New Forest cicada. These two features form a T -by-2 feature vector
which is used for classification by our model. In order to obtain real-time computationally efficient
insect identification, we adopt a HMM-based approach to classification as described in the following
section.

2.3 Classification Using Hidden Markov Model
A HMM consists of a Markov chain of discrete latent variables and a sequence of continuous ob-
served variables, each of which is dependent upon one discrete variable’s state (Ghahramani, 2001).
Figure 3 shows the graphical structure of a HMM, where the discrete, hidden variables (e.g. idle,
cicada singing) are represented by the sequence z1 , . . . , zT , and the continuous, observed variables
(the features extracted from the audio recording) are represented by the sequence x1 , . . . , xT . The
value of each discrete variable zt corresponds to one of K states, while each continuous variable
can take on the value of any real number.
    The behaviour of a hidden Markov model is completely defined by the following three parame-
ters. First, the probability of each state of the hidden variable at t = 1 is represented by the vector

                                                  811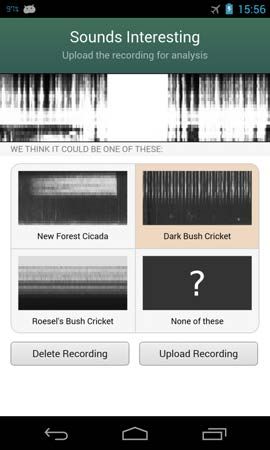
Z ILLI , PARSON , M ERRETT & ROGERS

π such that:
                                           πk = p(z1 = k)                                          (7)
   Second, the transition probabilities from state i at t − 1 to state j at t are represented by the
matrix A such that:
                                    Ai,j = p(zt = j|zt−1 = i)                                    (8)
    Third, the emission probabilities that describe the observed feature, x, given parameters φ, in
our case follow a log-normal distribution such that:

                                     xt,f |zt , φ ∼ ln N (µzt , σz2t )                             (9)

where φ = {µ, σ 2 }, and µzt and σz2t are the mean and variance of the Gaussian distribution for
state zt . Figure 4 shows a histogram of data generated by a cicada’s song, along with a log-normal
distribution fitted to the data. A log-likelihood ratio test on a normal, log-normal and exponential
distributions fitted to our data set of cicada songs shows that the log-normal distribution matches the
data better than the normal (F = 3512.13, p < 0.001) and exponential (F = 1516.06, p < 0.001)
distributions. However, despite its long tail, the log-normal distribution still has poor support for
data of unusually high magnitude, as are often generated by handling noise. In order to prevent
the model from strongly favouring a certain state when a data point is in the extreme of the log-
normal distribution, we cap the emission probabilities to capture cases where our data are likely
to be poorly represented by this model. The outcome of this is that the likelihood that such data
points result from the correct state may be so low that the model triggers a state change even though
the transition probability strongly discourages it (by being itself very low). Therefore, we cap the
emission probability of such data points such that there is a maximum ratio, initially 100, with
which any state can be preferred to another.
    Equations 7, 8 and 9 can then be used to calculate the joint likelihood of a hidden Markov
model:
                                                YT                 T
                                                                   Y
                         p(x, z|θ) = p(z1 |π)      p(zt |zt−1 , A)    p(xt |zt , φ)               (10)
                                              t=2                  t=1

where the model parameters are collectively defined by θ = {π, A, φ}.
     We use the Viterbi algorithm (Viterbi, 1967) to infer the most likely sequence of hidden states
given the features described. Despite the fact that the number of possible paths grows exponen-
tially with the length of the chain, this algorithm efficiently finds the most probable sequence by
maximising Equation 10, with a cost that grows only linearly with the length of the chain.

2.4 5-State Finite State Model of Insect Call
We propose a five-state HMM for cicada detection, in which the states consist of: an idle state in
which no insect is singing (I), a cicada singing state (C), a state where the dark bush-cricket is
chirping (DC ), a short pause in between the dark bush-cricket’s chirps (DSP ) and a state in which
the Roesel’s bush-cricket is calling (R). The emission parameters, i.e. the location a and scale b of
the log-normal distribution, are learned empirically using:
                                                 !       s
                                          µ2                        σ2

                            a = ln p               , b = ln 1 + 2                               (11)
                                        σ 2 + µ2                    µ

                                                    812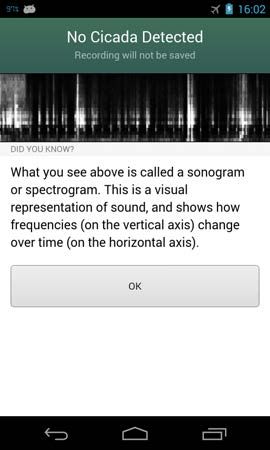
A N HMM ACOUSTIC C ICADA D ETECTOR FOR C ITIZEN S CIENCE

                                                                                          Log-normal emission
                                                                                          probabilities
                                                                                          Empirical data

                       Probability density function
                                                                                          for cicada call

                                                                     Feature value (mt,14 /mt,8 )

           Figure 4: Log-normal distribution of the extracted feature for the cicada call

           D
                                                                        I    Idle state

                 DC                                      DSP            D Dark bush-cricket                             D
                                                                        DC Dark bush-cricket's chirp
                                                                        DSP Dark bush-cricket's short pause

                                                                        R    Roesel's bush-cricket               R            C
    R             I                                      C
                                                                        C    New Forest cicada

                      (a) 5-state model used by our approach.                                                   (b) 3-state model.

                                                      Figure 5: Comparison of finite state machines.

where µ represents the mean and σ 2 represents the variance of the data. This manual estimation
was originally based on the few recordings the authors had gathered from historical archives, and
has therefore been improved with recordings obtained by the deployment of this work, described in
the following section.
    The transition matrices describing the dynamics of a Markovian process can be represented
graphically using finite state machines. Figure 5a shows the five states described above and all pos-
sible transitions, where those with non-zero probability are represented by arrows connecting two
states. Our model explicitly represents the silence between the dark bush-cricket’s chirps, which is
essential information for distinguishing between the calls of the New Forest cicada and dark bush-
cricket. This is in contrast to existing batch classification methods which remove such silent periods
of a recording in order to improve the computational cost of the operation and classify only sounded
periods of the sample file (Chaves et al., 2012). These methods also employ a feature extraction pro-
cess whereby they compute a number of mel-frequency cepstral coefficients for each species in the
model, making the process scalable to several insects, at the cost of higher computational complex-

                                                                            813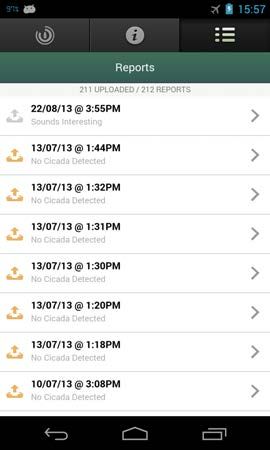
Z ILLI , PARSON , M ERRETT & ROGERS

ity. In contrast, the method we proposed in Section 2.1 is more closely tailored to the requirements
of our scenario, producing the improvement in efficiency necessary for our mobile application. Fig-
ure 5b shows a variant of our approach where the silent states have been removed, against which we
compare our approach in the following section. Furthermore, the HMM could be arranged so as to
be fully-connected, allowing transitions between states that are otherwise disconnected (for exam-
ple between a Roesel’s Bush-cricket and a Dark bush-cricket). However, this confuses the model
between states that have very similar emission probabilities, without providing any improvement in
accuracy. We therefore exclude this variation from the comparison in the following section.

3. Empirical Evaluation Using Smartphone Recordings

We introduce three variants of the approach described thus far that, following the practices in the
literature, motivate the choices made to construct our Cicada Detection Algorithm. The first variant
uses the same approach as proposed in Section 2, but the three raw frequencies, as opposed to their
ratio, are used directly as features (CDA raw frequencies). The second variant removes un-sounded
periods from the recording and, as such, segments it into individual calls. It then applies the 3-state
model shown in Figure 5b to classify the insects (CDA silence removed). The third approach does
not apply a HMM at all, and instead uses the ratio of frequencies to directly identify the most likely
state, given only the instantaneous emission probabilities of the features. As such, this method can
be considered as a mixture model, since each time slice is classified independently. This method
is considerably more computationally efficient, at the cost of losing the information of the time
domain.

    We evaluate the accuracy of each approach using a collection of 235 recordings taken by citizen
scientists using smartphones from the New Forest (the only known UK habitat of the New Forest
cicada) and by the authors of this paper in Slovenia (where the same species of cicada is still present)
over the summer of 2013. Each recording is 30 seconds long, and in most cases contains a call of
either the New Forest cicada, a dark bush-cricket or a Roesel’s bush-cricket. Some recordings
contain different types of noise, including people speaking, walking, calls of birds, handling noise
and even people mimicking the sound of the cicada. In contrast to existing recording libraries, this
data set represents the typical quality of crowdsourced data, exhibiting significant noise and insect
calls of varying amplitude depending on the proximity of the recording device to the specimen.
Each recording was later labelled by domain experts as containing either one or none of the insects
of interest. Although multiple insects in the recordings will not make the classification fail, we
consider only one singing insect per recording. If more than one is present, we set the ground truth
across the 30-second recording as the longest or loudest singing insect, therefore taking the state
active for the longest period as the outcome of the model. Since the emission probabilities in our
model are purposely tuned, we do not require any training data as such, and hence we use the entire
data set as test data. We describe the deployment of the smartphone app used to collect this data in
more detail in Section 4.

    We assess the accuracy by which each approach can correctly classify the cicada using the
standard precision, recall and F1 score metrics. The precision represents the fraction of recordings
in which the approach detected the cicada as singing when it was in fact singing, while the recall
represents the fraction of recordings in which the cicada was singing that were correctly detected.

                                                  814
A N HMM ACOUSTIC C ICADA D ETECTOR FOR C ITIZEN S CIENCE
Approach Precision Recall F1 -score
CDA 0.66 0.78 0.82
CDA raw frequencies 0.46 0.94 0.62
CDA silence removed 0.62 0.99 0.75
Mixture model 0.61 0.65 0.67
Table 1: Accuracy metrics of cicada detection
I C D R I C D R I C D R I C D R
I I I I
D
C C C C
D D D D
R R R R
(a) CDA (b) CDA raw frequencies (c) CDA silence re- (d) Mixture model
moved
Figure 6: Confusion matrices for the four variants of the detection algorithm. On the y-axis, the
actual class; on the x-axis, the predicted class.
Precision and recall are defined as:
tp tp
precision = , recall = (12)
tp + f p tp + f n
where tp represents the number of correct cicada song detections, f p represents the number of
cicada song detections when it was actually not singing, and f n represents the number of cicada
songs which were not detected. This work is primarily concerned with the detection of the New
Forest cicada, and as such other insects are modelled in order to avoid false positive detections of
the New Forest cicada. We also use the F1 score, which represents a weighted combination of
precision and recall, defined as:
precision · recall
F1 = 2 · (13)
precision + recall
Table 1 shows the precision, recall and F1 score metrics of our approach compared to the three
variants over the data set of recordings from the New Forest and Slovenia. Similarly, Figure 6
reports the true and false positives, with real values along the y axis and predicted class along the x
axis. It can be seen that our approach (CDA) achieves an F1 score of 0.82, and as such outperforms
each benchmark variant, visually apparent from the darkness along the main diagonal in Figure 6a.
In contrast, the variant of our approach which uses the raw frequency measurements as the HMM
feature vector (CDA raw frequencies) receives an F1 score of 0.62. This is a result of the approach’s
lack of robustness to noise, such as handling noise, as shown by the high number of false positives in
Figure 6b. Furthermore, the variant of our approach which removes the silent periods (CDA silence
removed) receives an F1 score of 0.75. Although this appears as positive result, Figure 6c highlights
815Z ILLI , PARSON , M ERRETT & ROGERS
its lack of ability to discriminate between the dark bush-cricket and the New Forest cicada. This
method, as well as the raw frequencies approach, favour the New Forest cicada, scoring a good
true positive rate but consequently also a high false postive rate. Finally, the mixture model method
receives an F1 score of 0.67 because the lack of transition probabilities leaves the decision to the
emission probabilities only, not utilising the information contained in the time domain, making
the number of true and false positives more equally distributed (Figure 6d). Insects with similar
emission probabilities, such as the Roesel’s bush-cricket and the dark bush-cricket, will therefore be
difficult to classify with this method. It should be noted however that this approach is considerably
more computationally efficient, as it decides on the most likely state instantaneously and without
traversing the entire recording.
Figures 7, 8, 9 and 10 show a comparison of the four approaches over a sample recording for
each of the four species in the recordings analysed. The top plot of each figure shows a spectrogram
with the time domain on the x-axis, and the frequency domain on the y-axis, with the magnitude
of the frequency bins varying with the colour of the plot. Subsequently, the figure shows the most
likely state identified by each approach. In each plot, the states are labelled as in Figure 5a, where
I represents the un-sounded idle state (if present), C represents the cicada’s song, R represents
the Roesel’s bush-cricket and DC and DSP the dark bush-cricket’s chirping and short pause states,
respectively. The gaps in the silence-removed variant correspond to unsounded periods.
Figure 7 shows that classifying the cicada is easier for the HMM-based methods, as the call lasts
for a long period without interruption and is clearly distinct from background noise. A more noisy
recording would cause the raw-frequency approach to fail. The mixture model approach struggles to
distinguish between the cicada and the dark bush-cricket call, since they are similar in features but
different in the time domain, which this model does not capture. Figure 8 shows how the variants are
more sensitive to noise than the CDA for different reasons. The raw frequencies approach doesn’t
filter out background noise, while the mixture model triggers a cicada state even for a very short
noise in the right frequency band. The silence-removed method is only active in the short period of
higher background noise, and not having an idle state, it is forced to classify the sound as any of
the sounded states. Figure 9 shows how, when silence is removed, a Roesel’s bush-cricket becomes
very similar to a dark bush-cricket, having very similar emission probabilities. The same perception
is observed by the mixture model, that doesn’t have a perception of time. Similarly, Figure 10 shows
that the dark bush-cricket is difficult to classify for the mixture model and the approach with silence
removed, as explained thus far. Moreover, it shows how a trade-off between a very quiet insect
(visible throughout the recording) and no insect must be made, as the insect could be at any distance
from the microphone, and thus there is no limit to how quiet it may be.
The analysis of each of the 235 recordings is presented in detail on the project’s web page, to-
gether with the parameters of the HMM, the audio file, and information about the recording device2 .
4. Automated Classification on a Smartphone App
We deployed the insect detection algorithm within a smartphone app that enables wide participation
in the search for this critically endangered species. This process, often referred to as citizen science,
attempts to leverage the widespread presence of users willing to participate such that they act as a
distributed network of sensors, while learning about the scientific process behind a certain research,
2. Result at http://www.newforestcicada.info/devdash. The data can be used free of charge, provided
that the New Forest Cicada Project is attributed according to the Creative Commons Attribution (BY) licence.
816A N HMM ACOUSTIC C ICADA D ETECTOR FOR C ITIZEN S CIENCE
20
Freq (kHz)
Spectrogram
15
10
5
0
R CDA
C
DC
DSP
I
R CDA
C raw frequencies
Most likely state
DC
DSP
I
CDA
R silence removed
C
D
R Mixture model
C
DC
DSP
I
Figure 7: Model comparison on a New Forest cicada recording
20
Freq (kHz)
Spectrogram
15
10
5
0
R CDA
C
DC
DSP
I
R CDA
C raw frequencies
Most likely state
DC
DSP
I
CDA
R silence removed
C
D
R Mixture model
C
DC
DSP
I
Figure 8: Model comparison on a recording with no singing insect
817Z ILLI , PARSON , M ERRETT & ROGERS
Freq (kHz)
20
15
10
5 Spectrogram
0
R
C
DC
DSP
I CDA
R
C
Most likely state
DC
DSP CDA
I raw frequencies
R
C
CDA
D
silence removed
R
C
DC
DSP
I Mixture model
Figure 9: Model comparison on a Roesel’s bush-cricket recording
20
Freq (kHz)
Spectrogram
15
10
5
0
R CDA
C
DC
DSP
I
R CDA
C raw frequencies
Most likely state
DC
DSP
I
CDA
R silence removed
C
D
R Mixture model
C
DC
DSP
I
Figure 10: Model comparison on a dark bush-cricket recording
818A N HMM ACOUSTIC C ICADA D ETECTOR FOR C ITIZEN S CIENCE
Possible cicada
detected
Save audio
recording
Live detection Record audio Sounds interesting
Upload report
No cicada
detected
Figure 11: Flow of the detection and classification process on the app.
in this case the automated identification of species for biodiversity monitoring. Examples of the
communities to which this app caters include tourists and visitors to the New Forest National Park,
local residents and bug enthusiasts. In order to maximise the number of citizen scientists taking
part, it was essential for the app to be compatible with a wide range of hardware, in addition to
being simple and unobtrusive to use. Therefore, we released both an iPhone and Android client,
which ensures compatibility with over 80% of smartphone users (Go-Gulf, 2012). Furthermore, we
designed the app to be simple to use, require user consent when recording audio and to constrain
usage of both battery and mobile data usage.
Figure 11 shows an overview of the flow of interaction when a user takes a recording with
the app. When a user first opens the app they are presented with the live detection screen, which
displays a graphical representation of the audio signal entering the microphone, in the form of a
circular spectrogram, and an immediate feedback on the presence of a singing cicada, obtained
through the output of the mixture-model described in Section 2. Upon selecting to start an audio
recording, the user is shown the current progress through the 30 second recording. On completing
the recording, the CDA is run and the user is presented with one of three possibilities: a possible
cicada detected screen, a sounds interesting screen (which notes that the algorithm has detected an
insect that is not the cicada), or the no cicada detected screen (where nothing known was found). A
report of the survey is saved locally and uploaded upon connecting to the Internet. If the recording
contains any of the known insects, the user is asked for their consent to upload the recorded audio.
4.1 Stages of Real-Time Classification
In order to capture a sound to be fed to the automated classifier, the user is presented with an intuitive
interface, summarised in Figures 12 and 13 and detailed as follows:
4.1.1 L IVE D ETECTOR
Figure 12a shows the detector screen, which appears upon loading the app. A crucial difficulty for
a human to detect the New Forest cicada’s call is the fact that the pitch is too high for most people
to hear, since the central frequency is at the limit of the hearing range of the average 40 year old. To
address this issue, this tab presents a visualisation of the sound drawn as a circular spectrogram. In
the centre, the cicada logo lights up when a call is detected, triggered by the instantaneous output of
the mixture model described in Section 2, updated every 128 samples from the microphone. Twenty
819Z ILLI , PARSON , M ERRETT & ROGERS
(a) Live detector (b) Audio recording (c) Upload recording
Figure 12: Three screens of Cicada Hunt on Android. On the left, a cicada singing lights up the
icon and the frequency bands around 14 kHz. In the middle, a cicada was singing during a survey
and stopped shortly after 15 seconds. On the right, the latest survey is waiting to be uploaded.
concentric circles around it represent twenty frequency bands of the spectrum, centred from 1 to
20 kHz with a bandpass of 1.4 kHz, extracted with 20 Goertzel filters, which ensure rapid updating
of the interface. Each of these becomes brighter with a higher signal strength (i.e. a louder sound
at that pitch) and paler when the band is quieter. The outer bands, roughly from 12 to 18 kHz, are
those triggered by the cicada call, producing the distinctive effect shown in Figure 12a. Tapping the
cicada icon at the centre of the app starts a 30-second survey, during which the sound is recorded
and then analysed by the algorithm described in Section 2. This idea is core to the interface, as it
encourages users to stop and wait in silence, thus maximising the chance of detecting the required
sound. The choice of 30 seconds strikes a balance between the length of the cicada call and the
amount of time a user—mostly an occasional visitor to the forest—can be expected to stand still
and in silence.
4.1.2 AUDIO R ECORDING
Figure 12b shows the screen shown during a 30 second audio recording. Once the recording has
finished, the audio is analysed by the HMM-based algorithm described in Section 2. Depending on
the result of the classification, the user is shown either the no cicada detected screen, the sounds
interesting screen or the possible cicada detected screen.
4.1.3 U PLOAD R ECORDING
Figure 12c shows a list of reports which have been saved locally. Each report is geo-tagged and
time-stamped, and saves a unique identifier of the phone as well as basic information about the
device. The report also saves an uncompressed 44.1 kHz 16 bit PCM WAV sound recording in the
820A N HMM ACOUSTIC C ICADA D ETECTOR FOR C ITIZEN S CIENCE
(a) No cicada detected (b) Sounds interesting (c) Possible cicada detected
Figure 13: Three possible outcomes of the CDA, where no known insect is found, an insect that is
not a cicada is found, or the cicada itself is found.
case that either the cicada or another insect is found, provided the user has granted permission to do
so. Since the audio recording requires 2.7 MB on disk, it is deleted from the smartphone as soon as
the report is sent to the server to minimise the storage space required on each smartphone. Last, a
low-resolution spectrogram is saved in all cases, constructed from the combination of the output of
20 Goertzel filters over the 30 seconds survey, saved every 128 samples. This constitutes the easiest
way for a human to check for the presence of the cicada and avoids any privacy concerns (speech
could not be reconstructed from such a spectrogram). Moreover, the payload of the image file,
saved in Base64 (Josefsson, 2006), is around 15 KB and therefore much lighter than a raw sound
recording. Once an Internet connection becomes available, the report is uploaded to the project’s
servers, where it is available to the research team to analyse further.
4.1.4 N O C ICADA D ETECTED
Figure 13a shows the screen shown if nothing was detected. A fact about the cicada, its habitat, the
New Forest or the technology behind the app is shown to provide an informative notion, encouraging
the user to try again. This intends to both support the morale of the user who is receiving negative
results, and to provide educational content so that the citizen scientist receives some information in
exchange for the work they have performed.
4.1.5 S OUNDS I NTERESTING
Figure 13b shows the screen displayed when another insect is detected, whose call is similar to that
of the New Forest cicada. At present, the app encompasses two other insects present in the New
Forest: the dark bush-cricket and the Roesel’s bush-cricket. The user is shown a spectrogram of a
typical call of these insects, as well as a spectrogram of what they have just recorded, and they are
821Z ILLI , PARSON , M ERRETT & ROGERS
Device OS Filtered Silence (SEM) Cicada (SEM) Ratio (SEM)
iPhone 4 iOS No 1.623 (0.075) 13.047 (0.327) 8.041 (0.442)
iPhone 5 iOS No 1.897 (0.076) 14.793 (0.388) 7.800 (0.373)
iPhone 4S iOS No 1.466 (0.050) 10.549 (0.337) 7.196 (0.336)
iPhone 3 iOS No 1.469 (0.047) 10.539 (0.430) 7.173 (0.372)
HTC Desire Android No 0.844 (0.041) 4.255 (0.265) 5.041 (0.397)
Xperia Mini Android No 2.480 (0.155) 10.190 (0.262) 4.109 (0.277)
Moto A953 Android No 2.015 (0.104) 5.845 (0.148) 2.901 (0.167)
Galaxy S3 Android No 1.374 (0.038) 3.279 (0.088) 2.387 (0.093)
Xperia Z Android No 0.951 (0.032) 1.971 (0.059) 2.072 (0.094)
HTC One S Android No 1.466 (0.040) 2.915 (0.085) 1.988 (0.079)
Nexus 4 Android No 0.675 (0.025) 1.314 (0.026) 1.946 (0.081)
HTC Desire X Android No 1.243 (0.054) 1.817 (0.075) 1.462 (0.087)
Galaxy Ace 2 Android No 1.953 (0.063) 2.162 (0.059) 1.107 (0.047)
Galaxy S2 Android No 1.916 (0.085) 2.101 (0.031) 1.097 (0.051)
Nexus One Android Yes 1.514 (0.051) 1.568 (0.045) 1.036 (0.046)
HTC One X Android Yes 1.933 (0.062) 1.732 (0.052) 0.896 (0.040)
HTC Wildfire S Android No 2.032 (0.088) 1.683 (0.063) 0.828 (0.047)
Table 2: Comparison of most popular smartphone devices. Values are means of ratios of 14 and
8 kHz Goertzel filters, sampled every ≈ 3 ms (128 samples at 44,100 kHz). Standard error of the
mean (SEM) is given in brackets.
asked to select which insect their recording looks most similar. This promotes the involvement of
the user in the process, who would otherwise be passively observing the detection performed on the
smartphone.
4.1.6 P OSSIBLE C ICADA D ETECTED
Figure 13c shows a message informing the user of the discovery of the cicada. Since the algorithm
can be tricked by a recording of an actual call, the detection is presented as ‘possible’.
4.2 Evaluation of Microphones’ Frequency Response
Prior to deployment, it was noted that not all smartphones are equally capable of detecting the
cicada. Our tests reveal that some smartphones are equipped with a microphone considerably more
sensitive than others. We tested a range of different devices by reproducing four types of sound for at
least 2 seconds each: silence, white noise, a frequency sweep from 50 to 20,000 Hz, and the cicada
call. These were reproduced in a custom-built sound-proof chamber, placed in a quiet location, with
a Visaton KE 25 SC 8 Ohm tweeter producing the four test sounds. The phones were arranged with
the microphone facing the speaker and all equally distant from it. From our experiences recording
cicada calls in Slovenia, the sound volume was calibrated so that the volume of the cicada call was
equivalent to that likely to be detected in the wild. The synthetic white noise and frequency sweep
were tuned to match the maximum amplitude of the cicada call.
We report a comparison of the sensitivity of the microphones based on how well they detect
the cicada call in our test environment. Table 2 summarises the outcome of the test, reporting the
822A N HMM ACOUSTIC C ICADA D ETECTOR FOR C ITIZEN S CIENCE
Ampl.
(a)
20
15
(b) 10
5
0
20
15
(c) 10
Freq (kHz)
5
0
20
15
(d) 10
5
0
20
15
(e) 10
5
0
00:05 00:10 Time (s) 00:15 00:20 00:25
Figure 14: Comparison of three phones. At the top, the waveform (a) and spectrogram (b) of the
sample calibration file. At the bottom, the very sensitive iPhone 5 (c), the Google Nexus 4 (d) and
the hardware-filtered HTC One X (e), all top-end devices for iOS and Android.
ratio between the 14 kHz and 8 kHz bands extracted with the Goertzel filter when no sound was
played (marked as Silence), when the cicada call was played (Cicada), and the ratio between these
two. A higher value of the latter means a clearer indication of the cicada call, which results in a
clearer separation of the log-normal distributions representing the sounded and unsounded states,
and therefore greater confidence in the detection. It can be seen that all models of iPhone capture
the call of the New Forest cicada most accurately, while Android phones exhibit a wide range in
performance. This is not due to the operating system itself, but rather to the more varied range of
hardware specifications in common Android devices. Figure 14 shows the reference sound played to
the phone, together with three examples of high-end devices; the Apple iPhone 5, which detects the
cicada call very clearly, the Nexus 4, which detects it most of the time, and the HTC One X, which
despite having a sensitive microphone, uses a low-pass frequency filter, and is therefore incapable
of detecting the insect’s call. This is confirmed by the divergent rank these devices score in Table 2.
4.3 Large-Scale Trial Deployment
The smartphone app was launched on 8th June 2013 and collected data until the end of the mating
season of the New Forest cicada. Since its launch, over 1000 citizen scientists have submitted over
6000 reports worldwide. Of these, at least 1777 were in the New Forest (over 1600 were submitted
before a GPS fix had been acquired); of the New Forest reports, 162 were classified as either sounds
interesting or potential cicada detected, and as a result include a 30 second audio recording. Of the
citizen scientists who submitted reports, 738 used the iOS version of the app, while 346 used the
Android version.
Figure 15 shows a bar graph of the number of reports uploaded by the top 25 contributors, with
the trend for the top 100 users displayed in the top-right corner. It should be noted that among these,
5 are entomologists and authors of this paper. However, these users only covered specific areas of
the forest, in particular those where the cicada had historically been observed. In contrast, the citizen
scientists submitted much fewer reports per user, but the reports were much more evenly distributed
823Z ILLI , PARSON , M ERRETT & ROGERS
350
306 301 300
300
iOS
Number of Reports
Android
247
250
236
Number of Reports
200
164 0
1 Ranking 100
150
100
78
63
54 52
42 40 38 38 37 37 37 36 36 34
50
33 33 31 30 29 29
0
1 2 3 4 5 6 7 8 9 10 11 12 13 14 15 16 17 18 19 20 21 22 23 24 25
Ranking
Figure 15: Reports per user by operating system for the top 25 users (right, trend of the top 100).
across the New Forest, as shown in Figure 16. This shows the crucial difference that this distributed
approach can make, as entomologists cannot be ubiquitously present in different areas of the forest
when the conditions are favourable, and can only cover a limited territory, while visitors, though
contributing individually less, can help rediscover the cicada if it has moved to different sites, as
it is currently suspected. At the same time, while entomologists have the tools and the knowledge
to recognise insects’ calls, the general public must be equipped with an accessible method. In this
space, the implementation and deployment of our automated acoustic insect detection algorithm has
succeeded to bring to the public the possibility to contribute to the distributed monitoring of insect
species, as shown by the large number of downloads of the app and submitted reports.
5. Conclusions
In this paper we have presented a novel algorithm designed specifically to detect the mating call of
the New Forest cicada. We have shown that through a careful analysis of its call, key features can be
extracted at minimal cost, greatly simplifying the identification process. We compared our approach
with three variants of our own approach, as no method exists to date to the best of our knowledge to
automatically classify insects calls on a constrained platform, such as a mobile phone. Of the three
variants, one uses the raw frequency components as HMM feature vectors, a second variant removes
the silent periods of a recording and a third one classifies time slices independently based upon only
the emission distributions. Our results show that our approach achieves an accuracy of F1 = 0.82
for the detection of the New Forest cicada on a data set of recordings collected from the New Forest
and Slovenia using iPhone and Android smartphones. Such recordings included various forms of
background noise, insects’ calls and human voices. Rather than focusing on the batch processing
of large data sets of species, our approach is focused upon the identification of a small number of
species in real time.
824A N HMM ACOUSTIC C ICADA D ETECTOR FOR C ITIZEN S CIENCE
(a) The New Forest (b) UK
Figure 16: Map of submitted surveys around the New Forest and across the UK. The area of the
New Forest corresponds to the green area in the centre.
With the development of the robust acoustic classifier complete, we integrated the technology
into the smartphone app for iOS and Android. A large-scale deployment resulted in the collection
of at least 1777 reports in the New Forest, of which 162 detected the call of an insect of interest,
from over 1000 citizen scientists. Although the New Forest cicada was not successfully detected
during its two month mating season in 2013, the use of the app in Slovenia confirmed the accuracy
of the acoustic detector and the deployment in the New Forest attested the suitability of using citizen
scientists to crowdsource the collection of audio reports via smartphones. The app is now also used
by expert entomologists in Slovenia to detect the presence of Cicadetta montana.
Our future work will consist of a second deployment of the smartphone app during the two
month mating season of the New Forest cicada, with the aim of achieving a greater coverage of the
New Forest, and as such it will require the mobilisation of a larger community of citizen scientists
to cover the areas of the New Forest which have not yet been surveyed. Such a deployment will
constitute the largest survey of the New Forest cicada’s habitat to date, and therefore will provide
unprecedented insight into the existence of this endangered species. Moreover, an app for the clas-
sification of all British Orthoptera is also currently under development, and will pose a new set
of challenges. In fact, with a higher number of different calls, the selection of distinctive features
for the HMM becomes more difficult, and may require sampling at a higher frequency, increasing
the computational complexity of the approach. To increase our accuracy and encompass a wider
number of devices, we will use techniques such as cepstral mean normalisation to account for the
difference in sensitivity of microphones.
Since the learning part of the algorithm is completed offline, our algorithm remains an efficient
solution to classify insects’ calls in real time on a mobile device, and may readily be extended to
the calls of different animals, such as other insects and birds. Preliminary work on this extension
has now started, with the goal of an adaptive acoustic classifier that can be trained for different
sound-emitting wildlife species.
825Z ILLI , PARSON , M ERRETT & ROGERS
Acknowledgements
This research was supported by an EPSRC Doctoral Training Centre grant (EP/G03690X/1) and
by the ORCHID Project, www.orchid.ac.uk (EP/I011587/1). Many thanks to Dr Tomi Trilar and
Prof Matija Gogala for their field guidance in Slovenia and to Dr David Chesmore for his original
suggestion and ongoing support.
References
Brenna, B. (2011). Clergymen Abiding in the Fields: The Making of the Naturalist Observer in
Eighteenth-Century Norwegian Natural History. Science in Context, 24(02), 143–166.
Chaves, V. A. E., Travieso, C. M., Camacho, A., & Alonso, J. B. (2012). Katydids acoustic classi-
fication on verification approach based on MFCC and HMM. Proceedings of the 16th IEEE
International Conference on Intelligent Engineering Systems (INES), 561–566.
Chesmore, E. D. (2004). Automated bioacoustic identification of species. Anais da Academia
Brasileira de Ciências, 76(2), 436–440.
Chesmore, E. D., & Ohya, E. (2004). Automated identification of field-recorded songs of four
British grasshoppers using bioacoustic signal recognition. Bulletin of Entomological Re-
search, 94(04), 319–330.
Dickinson, J. L., Zuckerberg, B., & Bonter, D. N. (2010). Citizen Science as an Ecological Research
Tool: Challenges and Benefits. Annual Review of Ecology, Evolution, and Systematics, 41(1),
149–172.
Ghahramani, Z. (2001). An Introduction to Hidden Markov models and Bayesian Networks. In
Journal of Pattern Recognition and Artificial Intelligence, Vol. 15, pp. 9–42.
Go-Gulf (2012). Smartphone Users Around the World – Statistics and Facts. On-line,
http://www.go-gulf.com/blog/smartphone, retrieved 19/07/2012.
Goertzel, G. (1958). An algorithm for the evaluation of finite trigonometric series. The American
Mathematical Monthly, 65(1), 34–35.
Gomes, C. P. (2009). Computational Sustainability: Computational methods for a sustainable envi-
ronment, economy, and society. The Bridge, 39(4), 5–13.
Joint Nature Conservation Committee (2010). UK priority species pages Cicadetta montana (New
Forest Cicada). Tech. rep..
Jones, K. E., Russ, J., Catto, C., Walters, C., Szodoray-Paradi, A., Szodoray-Paradi, F., Pandourski,
E., Pandourski, I., & Pandourski, T. (2009). Monitoring bat biodiversity: indicators of sustain-
able development in Eastern Europe Darwin Initiative – Final Report. Tech. rep., Zoological
Society London.
Josefsson, S. (2006). The base16, base32, and base64 data encodings. RFC 4648, Standards Track.
Leqing, Z., & Zhen, Z. (2010). Insect Sound Recognition Based on SBC and HMM. In International
Conference on Intelligent Computation Technology and Automation (ICICTA), Changsha,
China, Vol. 2, pp. 544 –548.
MacLeod, N. (2007). Automated Taxon Identification in Systematics: Theory, Approaches and Ap-
plications. CRC Press.
826You can also read