A highly sensitive octopus like azobenzene fluorescent probe for determination of abamectin B1 in apples - Nature
←
→
Page content transcription
If your browser does not render page correctly, please read the page content below
www.nature.com/scientificreports
OPEN A highly sensitive octopus‑like
azobenzene fluorescent probe
for determination of abamectin B 1
in apples
Zhenlong Guo1,2,3, YiFei Su2, Kexin Li2, MengYi Tang2, Qiang Li1,3* & Shandong Xu1*
The development of detecting residual level of abamectin B1 in apples is of great importance to public
health. Herein, we synthesized a octopus-like azobenzene fluorescent probe 1,3,5-tris (5′-[(E)-(p-
phenoxyazo) diazenyl)] benzene-1,3-dicarboxylic acid) benzene (TPB) for preliminary detection of
abamectin B1 in apples. The TPB molecule has been characterized by ultraviolet–visible absorption
spectrometry, 1H-nuclear magnetic resonance, fourier-transform infrared (FT-IR), electrospray
ionization mass spectroscopy (ESI-MS) and fluorescent spectra. A proper determination condition
was optimized, with limit of detection and limit of quantification of 1.3 µg L−1 and 4.4 μg L−1,
respectively. The mechanism of this probe to identify abamectin B1 was illustrated in terms of
undergoing aromatic nucleophilic substitution, by comparing fluorescence changes, FT-IR and ESI-MS.
Furthermore, a facile quantitative detection of the residual abamectin B1 in apples was achieved. Good
reproducibility was present based on relative standard deviation of 2.2%. Six carboxyl recognition
sites, three azo groups and unique fluorescence signal towards abamectin B1 of this fluorescent probe
demonstrated reasonable sensitivity, specificity and selectivity. The results indicate that the octopus-
like azobenzene fluorescent probe can be expected to be reliable for evaluating abamectin B1 in
agricultural foods.
Avermectins, being one type of macrolide antibiotics, have been widely used as bactericide, insecticide and miti-
cide for plants or animals, which have excellent characteristics of disturbing the target’s neurophysiological activi-
ties and can easily be decomposed by soil microorganisms1. Abamectin B1, is the only avermectin that has been
widely approved for plants and animals because of its efficient antiparasitic a ctivity2,3. However, the spread use of
avermectins tends to result in consecutive accumulation in food-producing animals and plants4,5. To detect aver-
mectins (Abamectin B1), various analytical approaches were employed, involving high-performance liquid chro-
matography-ultraviolet detection (HPLC–UV)4, liquid chromatography-tandem mass spectrometry (LC–MS)6,
high-performance liquid chromatography-fluorescent detector (HPLC-FLD)7, enzyme-linked immunosorbent
assay (ELISA)8 and liquid chromatography-tandem mass spectrometry/mass spectrometry (HPLC–MS/MS)9.
Whereas, in most case, these approaches either needed a time-consuming process, high-cost accurate instru-
ment, and high professional operators, which makes them difficult to apply in general laboratories10. Herein,
considering the potential harm of abamectin B1 for public health, a convenient and accurate analysis method
for residual abamectin B 1 is necessary10,11.
Fluorescent probe has gained great attention in recent years owing to high sensitivity, high selectivity, fast
response, low cost, and direct detection12. Especially, azobenzene fluorescent probe exhibits outstanding fluo-
rescent quantum yield, light s tability13, and chemical and thermal s tability14. Fluorescent probe has been applied
to analyze organophosphorus p esticides15, organochlorine p
esticides16 and carbamate p esticides17. However,
there are few reports on fluorescent probe for monitoring avermectin residual in literature due to the weaker
fluorescence signal of a single chromophore18 and the difficulty in recognizing their complicated chemical struc-
tures containing ketones, aldehydes and hydroxyl g roups19. Therefore, a fluorescent molecule, with rationally
designed structures, containing multiple chromophores and recognition groups, is an ideal probe to monitor
avermectin B1.
1
Department of Chemistry, College of Science, Beijing Forestry University, Beijing 100083, China. 2College of
Biological Sciences and Biotechnology, Beijing Forestry University, Beijing 100083, China. 3Beijing Key Laboratory
of Forest Food Processing and Safety, Beijing 100083, China. *email: liqiang@bjfu.edu.cn; xushd@bjfu.edu.cn
Scientific Reports | (2021) 11:4655 | https://doi.org/10.1038/s41598-021-84221-w 1
Vol.:(0123456789)
www.nature.com/scientificreports/
O O
HO OH
N N
O
H2C
H2C CH2
OH O O
O
O N N
OH
N N
HO O HO O
Figure 1. Structure of single molecular TPB.
Figure 2. Fluorescence 3D contour spectra of TPB (0.006 mmol L−1). Excitation wavelength: 200–600 nm,
Emission wavelength: 200–600 nm.
Herein, this study reported the synthesis of octopus-like 1,3,5-tris (5′-[(E)-(p-phenoxyazo) diazenyl)] ben-
zene-1,3-dicarboxylic acid) benzene (TPB), with six carboxyl groups and three azo chromophores (Fig. 1). Its
application as a fluorescent probe was proved to be feasible by evaluating its fluorescence properties. A sensi-
tive and specific approach was further established for qualitative and quantitative assay of abamectin B 1. The
applicability of approach was evaluated in apple samples, based on a visible fluorescence signal for this probe
towards avermectin B 1 at 420 nm.
Results and discussion
Fluorescence properties of TPB. The fluorescence property of TPB was investigated, with its precursor
5-(4-hydroxyphenylazo)-isophthalic acid dimethyl ester (DDH) (chemical structure was shown in Figure S1)
for comparison, which only has one azo chromophore. When TPB and DDH were irradiated by ultraviolet light,
TPB displayed a maximum emission at 350 nm and excitation at 290 nm (Fig. 2), while no fluorescence signal
was visible for DDH (Fig. 3). The difference of fluorescence property was attributed to the more released energy
of TPB than that of DDH when the excited state electrons returned from the excited singlet state (S) to the spin
singlet electron (S0), which was based on the superposition of fluorescence effect of three azo chromophores.
Furthermore, improved fluorescence property of TPB was ascribed to enhance resistance to internal rotation
of molecule resulting from the introduction of 1,3,5-tris (bromomethyl) benzene and the expansion of space
system effect. Moreover, the Stokes shift of TPB was calculated to be 60 nm. The Stokes shift, was considered to
Scientific Reports | (2021) 11:4655 | https://doi.org/10.1038/s41598-021-84221-w 2
Vol:.(1234567890)
www.nature.com/scientificreports/
Figure 3. Comparison of fluorescent excitation (EX) and emission (EM) spectra of DDH (0.006 mmol L−1),
TPB (0.006 mmol L−1) and the product (0.01 mg L−1). Excitation wavelength: 200–600 nm, Emission
wavelength: 200–600 nm.
Figure 4. Comparison of fluorescence spectra of the product with 0.00–0.12 mg L−1 abamectin B1. Excitation
wavelength: 360 nm, Emission wavelength: 200–700 nm.
effectively decrease detection errors, resulting from the interference from auto-fluorescent of s amples24 and the
spectral overlap between the fluorescent and excitation light25. Therefore, TPB was expected to be suitable for
employ as a fluorescent probe.
We further investigated the applicability of TPB to abamectin B1. Upon the addition of abamectin B1, the
emission band at 350 nm and the excitation band at 290 nm of the probe shifted forward to 420 nm and 360 nm
respectively (Fig. 3). Generally, different fluorescence molecules have different excitation and emission spectra,
which can determine the specificity and selectivity of analysis by using fluorescent probe. The Stokes shift of
60 nm was calculated and reflected rational anti-interference ability. This result confirmed that abamectin B 1
could be identified by probe TPB under the certain conditions, which indeed underpinned qualitative analysis
of abamectin B 1.
Furthermore, the fluorescence intensities of the reacted product at 420 nm were examined at different concen-
trations of abamectin B1. Figure 4 presented that the fluorescence intensity of the reacted product at 420 nm were
enhanced gradually with the increasing concentration of abamectin B 1. The which was considered as the basis of
quantitative analysis. Therefore, TPB could be used as a fluorescence probe for assessing the level of abamectin B
1.
Scientific Reports | (2021) 11:4655 | https://doi.org/10.1038/s41598-021-84221-w 3
Vol.:(0123456789)
www.nature.com/scientificreports/
H3C H H CH3
H3C H3C CH3
CH3 H
H
O O
O OH O OH
CH3 H3C
O O O O
H O O H
N N
O HO N O H OH O
H O N
O O
O O CH3
H3C CH2 CH2
CH3 H3 C
O O
O H2 C O
CH3 OCH3 O H3CO H3C
O O
O O
CH3 OCH3 H3CO H3C
HO N N OH
HO O
O OH
Figure 5. Recognized mode of the reacted product.
In the absence of abamectin B1, probe TPB had no or faint fluorescence, otherwise it emitted the visible
fluorescence (Fig. 4), which confirmed the probe TPB was the typical fluorescent molecule based on the effect
of Photoinduced Electron Transfer (PET). Further analysis for TPB’ structure showed that its carboxyl groups,
azo groups and peripheral phenyls might be considered as receptors, fluorophores and spaces respectively. Based
on frontier orbital theory, in the existence of abamectin B
1 and its relevant substances with the same recognized
group, probe TPB should engender different LUMO and HUMO, which leaded to unequal excitation and emis-
sion spectra. Therefore, probe TPB has a good sensing selectivity.
The mechanism of identifying abamectin B1 by TPB. To investigate the mechanism of identifying
abamectin B1 by TPB, fluorescence spectroscopy, FT-IR and ESI-MS were employed to compare the difference
of the TPB before and after adding abamectin B1. After adding abamectin B1, FT-IR spectra showed additional
peaks at 1704 cm−1 and at 1149 cm−1 (Figure S2), corresponding to the ester group. The appearance verified the
recognition of probe TPB to abamectin B1 achieved by esterification. In addition, a clear red shift of wavelengths
in fluorescence spectroscopy was noticed (Fig. 3), which was assigned to the changed conjugate systems of elec-
tron-donating and rearranged internal charges prompted by enhanced ability of TPB to capture abamectin B 1.
Moreover, ESI-MS spectra yielded a peak at m/z = 2717.1910 (Figure S6), which corresponded to a new product
produced between probe TPB and abamectin B1, thus underlying the mechanism of detection.
For abamectin B 1, the hydroxyl groups at the C 5 and C
7 are allylic, which should have the high reactive.
However, the allylic hydroxyl group at the C7 A is too easily forming hydrogen bonds with adjacent ester groups
and too sterically hindered to be reactive26. Hydroxyl group at the C 4 is a general, and its activity is weaker than
that of C5 and C7. Thus, only hydroxyl group at the C5 has the potential to be used for esterification theoretically.
In addition, due to the effect of steric hindrance on TPB, its combination with abamectin B 1 can only take place
in the counterpoint. However, on the same phenyl of TPB with two carboxyl groups, in the existence of one
abamectin B1, the adjacent carboxyl groups will be passivated and incapable to add another abamectin B 1. There-
fore, a recognition mode was tentatively proposed, i.e., the two carboxyl groups of the octopus-like azobenzene
fluorescent probe TPB were used as recognition sites to abamectin B 1 with a molar ratio of 1:2 (Fig. 5), which
was further confirmed by ESI-MS spectra with a peak at m/z = 2717.1910 (Figure S6).
Establishment and evaluation of the method. To optimize the determination conditions, effects of
different levels of the pH and amount of phosphate buffer were investigated. Figure S7 showed that the fluores-
cent intensity of the reacted product at 420 nm was initially increased at pH 5.0–6.0, followed by a decrease at pH
6.0–9.0, and eventually by the maximum at pH 6.0. The increase–decrease–maximum trend reflected the proper
protonation of carboxyl groups of TPB facilitated the coordination process and enhanced the nucleophilicity of
hydroxyl of TPB to abamectin B 1. Figure S8 showed that the fluorescent intensity of the product at 420 nm was
initially increased at 0.2–0.8 mL phosphate buffer (0.2 M, pH 6.0), followed by a stabilization at 0.8–1.2 mL phos-
phate buffer (0.2 M, pH 6.0). Therefore, the validation of using probe TPB was estimated at 0.8 mL phosphate
buffer (0.2 M, pH 6.0), by optimizing the determination conditions, linear equation, correlation coefficients ( R2),
limit of detection (LOD), limit of quantification (LOQ) precision and linear range. Apparently, the fluorescent
Scientific Reports | (2021) 11:4655 | https://doi.org/10.1038/s41598-021-84221-w 4
Vol:.(1234567890)www.nature.com/scientificreports/
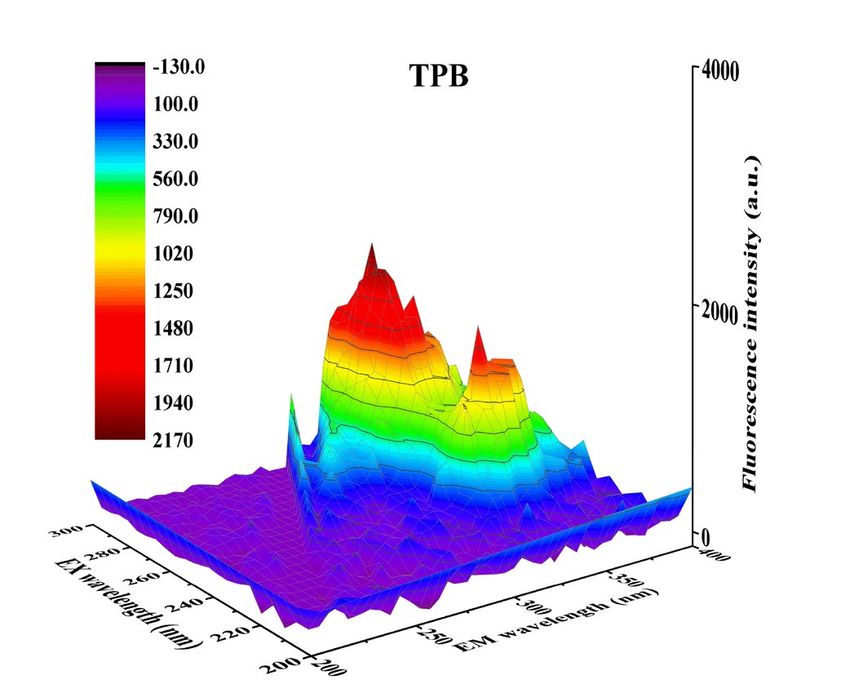
Figure 6. Plot of fluorescence intensity differences with 0.00–0.06 mg L−1 abamectin B1. Excitation wavelength:
360 nm, Emission wavelength: 420 nm.
Sample Based level (μg L−1) Added level (μg L−1) Found average level (μg L−1) Recovery (%) RSD (%)
2.0 4.4 6.4 (6.4, 6.4, 6.5) 100.0–102.3 0.9
Malus pumila mill 2.0 8.8 11.0 (11.1, 11.2, 10.7) 98.9–104.5 2.4
2.0 44 45.5 (45.4, 45.2, 45.9) 98.2–99.8 0.8
3.0 4.4 7.5 (7.6, 7.6, 7.4) 100.0–104.5 1.5
Qinguan 3.0 8.8 11.8 (11.8, 11.7, 11.9) 98.9–101.1 0.8
3.0 44 47.2 (46.3, 48.2, 47.0) 98.4–102.7 2.0
1.6 4.4 6.1 (6.2, 6.0, 6.0) 100.0–104.5 1.9
Huangxiangjiao 1.6 8.8 10.4 (10.4, 10.3, 10.6) 98.9–102.3 1.5
1.6 44 46.3 (45.8, 46.2, 46.9) 100.5–103.0 1.2
Table 1. Recovery values determination of abamectin B1 in apple samples of the approach.
intensity of probe TPB mixing with various concentrations of abamectin B 1 exhibited a good linear relationship
at the linear range from 4.4 to 60 μg L−1, giving rise to a LOQ of 4.4 μg L−1 (Table S2). In addition, the LOD of the
described method was calculated as 1.3 µg L−1 (Table S2).
The linear regression equation was thus determined to be Y = 3987X – 0.7143 (Fig. 6), where Y was the
fluorescent intensity of probe TPB at 420 nm, and X represented the concentration of abamectin B 1. Correla-
tion coefficients ( R2) was determined to be 0.9997, which manifested the satisfactory precision of the method.
The enhancement clarified the suitability of this convenient and sensitive method for the determination of the
abamectin B1 with tiny LOD, miniature LOQ, excellent precision and epic linear range.
Further comparison was conducted between our fluorescent probe method and those described previously.
Table S3 showed that the recovery, linear range and LOQ of our fluorescent probe method were comparable to
or superior to those of the methods reported previously.
A good reproducibility was represent by a relative standard deviation of 2.2% between eleven parallel experi-
ments shown in Table S2. The final product had an unique fluorescence spectra at EX of 360 nm and EM of
420 nm, which could be considered to embody the specificity and selectivity of the method generally, as men-
tioned above. Sensitivity of the method was benefit from the six carboxyl recognition sites and three azo response
sites of TPB.
Preliminary detection of abamectin B1 in apple samples. Table 1 showed 2.0 μg L−1, 3.0 μg L−1 and
1 in Malus pumila mill, Qinguan and Huangxiangjiao, respectively. To evaluate the accu-
1.6 μg L−1 abamectin B
racy of the proposed method, apple samples spiked with abamectin B 1 at different levels of 4.4 μg L−1, 8.8 μg L−1
and 44 μg L−1 were determined. The recoveries of abamectin B1 spiked to apple samples were calculated in the
range of 98.2–104.5% (Table 1), which indicated the suitability of this detection method in apples.
Scientific Reports | (2021) 11:4655 | https://doi.org/10.1038/s41598-021-84221-w 5
Vol.:(0123456789)www.nature.com/scientificreports/
Conclusion
In summary, we had demonstrated the probe TPB synthesized for facile quantitative detection of the residual
abamectin B1 in apples. The octopus-like TPB molecule was characterized using UV–Vis, 1H NMR, FT-IR,
ESI-MS and fluorescent spectra. The determination conditions were tuned by varying different pH value and
concentration, and a proper condition was achieved at pH 6.0 with LOD and LOQ of 1.3 µg L−1 and 4.4 μg L−1,
respectively. The mechanism of the probe to identify abamectin B1 was tentatively proposed in a aromatic nucleo-
philic substitution through a combined mode of TPB and abamectin B 1 with a molar ratio of 1:2. In particular,
the facile quantitative detection of the residual abamectin B
1 in apples was achieved. Our results showed that
the novel approach of quantitative assay based on fluorescent probe is significative to evaluate the abamectin B1
in agricultural foods.
Materials and methods
Reagents and materials. Dimethyl 5-aminoisophthalate, 1,3,5-tris (bromomethyl) benzene, phenol,
sodium acetate anhydrous, sodium nitrite, sodium hydroxide, N,N-dimethylformamide (DMF), ethanol anhy-
drous, methanol, magnesium sulfate anhydrous, potassium carbonate, sodium chloride, acetonitrile, tetrahy-
drofuran, hydrochloric acid, sulphuric acid, pH 4.0 phosphate buffer (0.2 M), pH 7.0 phosphate buffer (0.2 M),
pH 8.0 phosphate buffer (0.2 M), pH 9.0 phosphate buffer (0.2 M), sodium dihydrogen phosphate anhydrous,
sodium phosphate dibasic, potassium bromide, deuterated chloroform, octadecylsilane chemically bonded silica
(C18) were purchased from Shanghai Macklin Biochemical Co., Ltd (Shanghai, China) and were of analytical
grade. pH 6.0 phosphate buffer (0.2 M) was purchased from Beijing Lanyi chemical products Co., Ltd. (Bei-
jing, China) and were of analytical grade. Quinine sulfate fluorescent standard substance (98.6%) and abamec-
tin B1 were purchased from Aladdin Biochemical Technology Co., Ltd. (Shanghai, China). Demonized water
(18 MΩ cm) was produced by using a water purification system (Water Purification System, Casccada 1, Pall,
Beijing, China).
General instrumentation. Fourier-transform infrared spectroscopy (FT-IR) was recorded on a Thermo
330 spectrometer at 500–4000 cm−1 wavelengths and a resolution of 3 cm−1 over 32 scans. The ultraviolet–visible
absorption spectrometry (UV–Vis) was measured with a TECHCOMP UV2600 Spectrometer (TECHCOMP,
Shanghai, China) at 200–800 cm−1 wavelengths. 1H-nuclear magnetic resonance (NMR) spectra was recorded on
a JNM-ECA 600 MHz-NMR using tetramethylsilane (TMS) (JEOL, Japan). Electrospray ionization mass spec-
troscopy (ESI-MS) data of TPB and the product were obtained by using a Bruker New ultrafleXtreme MALDI-
TOF mass spectrometer at NL: 7,990,000, RT: 4.58–4.66, AV: 34, T: FTMS-p ESI and NL: 41,300, RT: 2.13–2.22,
AV: 36, T: FTMS-p ESI. Fluorescent spectra was performed using a Hitachi F-7000 spectrometer at Sampling
Interval: 5 nm, Scan speed: 12,000 nm min−1, EX Slit: 5 nm, EM Slit: 5 nm, PMT Voltage: 700 V, Contour inter-
val: 10 nm, Temperature: room temperature.
Preparation of probe TPB. TPB was synthesized by the scheme showed in Figure S1 based on a previ-
ously reported method20, which was confirmed by FT-IR, UV–Vis, 1H NMR and ESI-MS. FT-IR: characteristic
absorption peaks at 3432 cm−1 (C–H of aryl), 1699 cm−1 (C=O of carboxyl), 1597 cm−1 (N=N), 1499 cm−1 (aryl),
1253 cm−1 (aryl-N). UV–Vis: λmax 355 nm (azobenzene). 1H NMR (600 MHz, C DCl3) δ (ppm): 8.71 (s, 3 H),
8.65–8.68 (s, 6 H), 7.94–7.95 (d, 6 H), 7.25 (s, 3 H), 7.0–7.1 (d, 6 H), 5.22 (s, 6 H). HRMS (m/z, ESI): [ M]− calcd.
Found 971.2133 (TPB), 703.1660 (TPB-C14N2O4H8), 485.1024 (TPB-C22N4O9H22). All supplementary data used
for confirmation can be found in Figures S2–S5 and Table S1.
General procedure for fluorescent spectra measurement. Tetrahydrofuran, as a solvent, was used
to prepare the probe TPB solution (0.06 mmol L−1), abamectin B1 solution (1.00 mg L−1), and DDH solution
(0.06 mmol L−1). 0.5832 g TPB was added to a volumetric flask and mixed with tetrahydrofuran solution to
100 mL to get probe TPB solution (6.00 mmol L−1). Then, 1 mL TPB (6.00 mmol L−1) was added to a volumetric
flask and mixed with tetrahydrofuran solution to 100 mL to get probe TPB solution (0.06 mmol L−1). 0.1716 g
DDH was added to a volumetric flask and mixed with tetrahydrofuran solution to 100 mL to get probe DDH
solution (6.00 mmol L−1). Then, 1 mL DDH (6.00 mmol L−1) was added to a volumetric flask and mixed with
tetrahydrofuran solution to 100 mL to get DDH solution (0.06 mmol L−1). 1.0 mg abamectin B1 was added to a
volumetric flask and mixed with tetrahydrofuran solution to 1 L to get abamectin B 1 solution (1.0 mg L−1).
The appropriate excitation wavelengths and emission wavelengths of TPB in the absence and existence
abamectin B1 and DDH were analyzed by fluorescent spectra respectively. One 10 mL colorimetric tube was
filled with probe TPB (1.0 mL, 0.06 mmol L−1) and avermectin B 1 (0.2 mL, 1.0 mg L−1). The other was only filled
with probe TPB (1.0 mL, 0.06 mmol L−1). One 10 mL was only filled with DDH (1.0 mL, 0.06 mmol L−1). Then,
they all fixed with tetrahydrofuran to 10 mL. For each sample in colorimetric tubes, test condition of the fluores-
cence intensity was as follows: sample mixed time: 10 s, Sampling interval: 5 nm, Scan speed: 12,000 nm min−1,
EX Slit: 5 nm, EM Slit: 5 nm, PMT Voltage: 700 V, Contour interval: 10 nm, Temperature: room temperature,
EX WL: 200–600 nm, EM WL: 200–600 nm.
In order to explore the quantitative relationship between TPB and avermectin. The fluorescence intensity of
the reacted product at 420 nm were examined at different concentrations of abamectin B1 (0.00, 0.02, 0.04, 0.06,
0.08, 0.10, 0.12 mg L−1). Test condition of the fluorescence intensity was same as that of probe TPB, except EX
WL: 360 nm and EM WL: 200–700 nm.
Scientific Reports | (2021) 11:4655 | https://doi.org/10.1038/s41598-021-84221-w 6
Vol:.(1234567890)www.nature.com/scientificreports/
Establishment and validation of the analysis method. To obtain the ideal pH condition of test,
considering the emergence of esterification at pH below 5.0 and salt forming at pH above 5.0 for avermectin B 1,
the effect of pH 5.0–9.0 on the analysis result was investigated. Five 10 mL colorimetric tubes were filled with
probe TPB (1.0 mL, 0.06 mmol L−1) and avermectin B1 (0.2 mL, 1.0 mg L−1), and fixed to 10 mL with pH 5.0–9.0
phosphate buffer (0.2 M) at room temperature, respectively. For each sample in colorimetric tubes, test condition
of the fluorescence intensity was same as that of probe TPB, except EX WL: 360 nm and EM WL: 420 nm. pH 6.0
phosphate buffer (0.2 M) was found as an ideal pH condition and used in following tests.
To obtain the ideal mount of phosphate buffer, the effect of 0.2–1.2 mL phosphate buffer (0.2 M, pH 6.0) was
investigated. Six 10 mL colorimetric tubes were filled with probe TPB (1.0 mL, 0.06 mmol L−1) and avermectin
B1 (0.2 mL, 1.0 mg L−1), and fixed with 0.2, 0.4, 0.6, 0.8, 1.0 and 1.2 mL phosphate buffer (0.2 M, pH 6.0) at room
temperature, respectively. For each sample in colorimetric tubes, test condition of the fluorescence intensity was
same as that of probe TPB, except EX WL: 360 nm and EM WL: 420 nm. 0.8 mL phosphate buffer (0.2 M, pH
6.0) was found as an ideal mount and further applied in followed tests.
To establish the relationship between probe TPB and abamectin B1, at room temperature, 0.0 mL, 0.1, 0.2,
0.3, 0.4, 0.5 and 0.6 mL abamectin B 1 (1.0 mg L−1) were added to probe TPB (1.0 mL, 0.06 mmol L−1), mixed
with 0.8 mL phosphate buffer (0.2 M, pH 6.0) and fixed with tetrahydrofuran to 10 mL, respectively. For each
sample, test condition of the fluorescence intensity was same as that of part 2.4, except EX WL: 360 nm, EM
WL: 200–700 nm.
To validate the method under analytical control, the limit of detection (LOD), limit of quantification (LOQ),
precision and linear range were implemented according to the previous methods21,22. A 10 mL colorimetric tubes
was mixed with abamectin B 1 (0.20 mL, 1.0 mg L−1) and probe TPB (1.0 mL, 0.06 mmol L−1), mixed with 0.8 mL
phosphate buffer (0.2 M, pH 6.0), fixed with tetrahydrofuran to 10 mL and fluorescently detected according to
that of probe TPB, except EX WL: 360 nm and EM WL: 420 nm. Eleven groups of parallel experiments were
conducted. LOD and LOQ were calculated using the formulas shown in Eqs. (1) – (2). Precision was evaluated
using relative standard deviation (RSD). The linear range was from LOQ to the maximum measured value.
LOD = 3δ/k (1)
δ: standard deviation of the experiments, k: slope for the range of the linearity.
LOQ = 10 × δ (2)
δ: standard deviation of the experiments.
To perform the recovery rate, the standard addition method was chosen for detection of abamectin B1 in apple
samples. Abamectin B 1, at concentrations of 4.4 μg L−1, 8.8 μg L−1, 44 μg L−1, were added to the apple samples and
fluorescence responses were introduced to detect these pesticides according to that of probe TPB, except EX WL:
360 nm and EM WL: 420 nm. Level of abamectin B1 was calculated according to the linear regression equation
of this work. And the recovery rate was calculated using the formulas shown in Eq. (3).
Recovery rate (%) = 100 × (CA − CB )/CS (3)
CA: abamectin B1 value of apple samples filled with the standard abamectin B1, CB: abamectin B1 value of apple
samples filled without the standard abamectin B1, CS: the filled standard abamectin B1 value.
Preparation and analysis of apple samples. Malus pumila mill, Qinguan and Huangxiangjiao were
purchased from local Xingfu Supermarket (Beijing, China) and analyzed. Apple samples were prepared accord-
ethod23. Each sample (20.0 g) was respectively added with acetonitrile (10.0 mL) and vigor-
ing to a published m
ously shaken for 2.0 min by a vortex mixer. Then, each mixture was mixed with 4.0 g anhydrous magnesium sul-
fate anhydrous and 1.0 g sodium chloride and shook for another 1.0 min. Following centrifugation at 4000 rpm
for 5.0 min, 2.0 mL of the upper layer was transferred to a 20 mL volumetric flask and filled with tetrahydrofuran
to obtain tested Malus pumila mill, Qinguan and Huangxiangjiao samples. These samples were fluorescently
detected according to that of probe TPB, except EX WL: 360 nm and EM WL: 420 nm, respectively. Value of
abamectin B1 was calculated according to the linear regression equation of this work.
Received: 16 November 2020; Accepted: 11 February 2021
References
1. Rúbies, A., Antkowiak, S., Granados, M., Companyó, R. & Centrich, F. Determination of avermectins: A QuEChERS approach to
the analysis of food samples. Food Chem. 181, 57–63 (2015).
2. Egerton, J. R. et al. 22, 23-dihydroavermectin B 1, a new broad-spectrum antiparasitic agent. Br. Vet. J. 136, 88–97 (1980).
3. Shen, H. et al. Determination and correlation of Avermectin B1a solubility in different binary solvent mixtures at temperatures
from (283.15 to 313.15) K. J. Chem. Thermodyn. 105, 253–266 (2017).
4. Teixeira, R. A., Flores, D. H. Â., da Silva, R. C. S., Dutra, F. V. A. & Borges, K. B. Pipette-tip solid-phase extraction using poly(1-
vinylimidazole-co-trimethylolpropane trimethacrylate) as a new molecularly imprinted polymer in the determination of aver-
mectins and milbemycins in fruit juice and water samples. Food Chem. 262, 86–93 (2018).
5. Zhou, Q. Z. et al. The effects and mechanism of using ultrasonic dishwasher to remove five pesticides from rape and grape. Food
Chem. https://doi.org/10.1016/j.foodchem.2019.125007 (2019).
6. Zhan, J. et al. Multi-class method for determination of veterinary drug residues and other contaminants in infant formula by ultra
performance liquid chromatography-tandem mass spectrometry. Food Chem. 138, 827–834 (2013).
Scientific Reports | (2021) 11:4655 | https://doi.org/10.1038/s41598-021-84221-w 7
Vol.:(0123456789)www.nature.com/scientificreports/
7. Lemos, M. A. T. et al. Development, validation, and application of a method for selected avermectin determination in rural waters
using high performance liquid chromatography and fluorescence detection. Ecotoxicol. Environ. Safe 133, 424–432 (2016).
8. Zhao, W. D., Zheng, W. J., He, Y., Wan, Y. P. & Wang, S. L. Determination of avermectin residues in animal products by ELISA.
Food Res. Dev. 30, 39–44 (2009).
9. Park, J. H., Abd El-Aty, A. M., Rahman, M. M., Choi, J. H. & Shim, J. H. Application of hollow-fiber-assisted liquid-phase micro-
extraction to identify avermectins in stream water using MS/MS. J. Sep. Sci. 36, 2946–2951 (2013).
10. Ni, T. T. et al. Development of a broad-spectrum monoclonal antibody-based indirect competitive enzyme-linked immunosorbent
assay for the multi-residue detection of avermectins in edible animal tissues and milk. Food Chem. 286, 234–240 (2019).
11. De Souza Santos Cheibub, A. M., Silva Bahiense de Lyra, E. & Pereira Netto, A. D. Development and validation of a method for
simultaneous determination of trace levels of five macrocyclic lactones in cheese by HPLC-fluorescence after solid–liquid extrac-
tion with low temperature partitioning. Food Chem. 272, 148–156 (2019).
12. Zhao, M. et al. Far-red to near-infrared fluorescent probes based on silicon-substituted xanthene dyes for sensing and imaging.
Trend Anal. Chem. https://doi.org/10.1016/j.trac.2019.115704 (2020).
13. Wu, D. et al. Comparative analysis of the interaction of mono-, dis-, and tris-azo food dyes with egg white lysozyme: A combined
spectroscopic and computational simulation approach. Food Chem. 284, 180–187 (2019).
14. An, Y. L., Tan, H. R. & Zhao, S. Y. Silver carbonate mediated oxidative dehydrogenation of aromatic amines to produce aromatic
azo compounds. Chin. J. Org. Chem. 37, 226–231 (2017).
15. Wu, X. L., Wang, P. S., Hou, S. Y., Wu, P. L. & Xue, J. Fluorescence sensor for facile and visual detection of organophosphorus
pesticides using AIE fluorogens–SiO2–MnO2 sandwich nanocomposites. Talanta 198, 8–14 (2019).
16. Hussein, B. H. M., Khairy, G. M. & Kamel, R. M. Fluorescence sensing of phosdrin pesticide by the luminescent Eu(III)- and
Tb(III)- bis (coumarin-3-carboxylic acid) probes. Spectrochim. Acta A. 158, 34–42 (2016).
17. Kestwal, R. M., Bagal-Kestwal, D. & Chiang, B. H. Fenugreek hydrogel–agarose composite entrapped gold nanoparticles for
acetylcholinesterase based biosensor for carbamates detection. Anal. Chim. Acta 886, 143–150 (2015).
18. Wang, J. J. et al. A novel reaction-based fluorescent probe for the detection of cysteine in milk and water samples. Food Chem. 262,
67–71 (2018).
19. Wang, Z., Beier, R. C. & Shen, J. Immunoassays for the detection of macrocyclic lactones in food matrices—A review. Trend Anal.
Chem. 92, 42–61 (2017).
20. Eubank, J. F. et al. On demand: The singular rht net, an ideal blueprint for the construction of a Metal-Organic Framework (MOF)
platform. Angew. Chem. Int. Ed. 51, 10099–10103 (2012).
21. Yan, H. M. et al. A water-soluble fluorescent probe for the detection of thiophenols in water samples and in cells imaging. Spec-
trochim. Acta A https://doi.org/10.1016/j.saa.2019.117905 (2019).
22. Zenaida, G., Olga, M. P., Álvaro, G., José, D. C. & Belén, A. Quantitative determination of wine polysaccharides by gas chroma-
tography–mass spectrometry (GC–MS) and size exclusion chromatography (SEC). Food Chem. 131, 367–374 (2012).
23. Wilkowska, A. & Biziuk, M. Determination of pesticide residues in food matrices using the QuEChERS methodology. Food Chem.
125, 803–812 (2011).
24. Yuan, L., Lin, W., Zheng, K., He, L. & Huang, W. Far-red to near infrared analyte-responsive fluorescent probes based on organic
fluorophore platforms for fluorescence imaging. Chem. Soc. Rev. 42, 622–661 (2013).
25. Ren, T. B. et al. A general method to increase Stokes shift by introducing alternating vibronic structures. J. Am. Chem. Soc. 140,
7716–7722 (2018).
26. Wang, Z. L. et al. Two ultrafast responsive isolongifolanone based fluorescent probes for reversible and sensitive visualization of
toxic BF3 in solution and in gas phase. Sensor Actuator B Chem. https://doi.org/10.1016/j.snb.2019.127083 (2020).
Acknowledgements
This work was supported by the National Natural Science Foundation of China (No. 21671021) and the Funda-
mental Research Funds for the Central Universities (No. 2015ZCQ-LY-03).
Author contributions
Z.L.G. carried out conceptualization, methodology, validation, formal analysis, data cu-ration, drawing, investiga-
tion and writing. Y.F.S., K.X.L. and M.Y.T. carried out conceptualization, drawing, methodology and resources.
Q.L. and S.D.X. carried out methodology, editing and supervision. All authors reviewed the manuscript.
Competing interests
The authors declare no competing interests.
Additional information
Supplementary Information The online version contains supplementary material available at https://doi.
org/10.1038/s41598-021-84221-w.
Correspondence and requests for materials should be addressed to Q.L. or S.X.
Reprints and permissions information is available at www.nature.com/reprints.
Publisher’s note Springer Nature remains neutral with regard to jurisdictional claims in published maps and
institutional affiliations.
Open Access This article is licensed under a Creative Commons Attribution 4.0 International
License, which permits use, sharing, adaptation, distribution and reproduction in any medium or
format, as long as you give appropriate credit to the original author(s) and the source, provide a link to the
Creative Commons licence, and indicate if changes were made. The images or other third party material in this
article are included in the article’s Creative Commons licence, unless indicated otherwise in a credit line to the
material. If material is not included in the article’s Creative Commons licence and your intended use is not
permitted by statutory regulation or exceeds the permitted use, you will need to obtain permission directly from
the copyright holder. To view a copy of this licence, visit http://creativecommons.org/licenses/by/4.0/.
© The Author(s) 2021
Scientific Reports | (2021) 11:4655 | https://doi.org/10.1038/s41598-021-84221-w 8
Vol:.(1234567890)You can also read