A VISION-BASED REAL-TIME ADAPTIVE TRAFFIC LIGHT CONTROL SYSTEM USING VEHICULAR DENSITY VALUE AND STATISTICAL BLOCK MATCHING APPROACH - Sciendo
←
→
Page content transcription
If your browser does not render page correctly, please read the page content below
Transport and Telecommunication                                                                                Vol. 22, no.1, 2021

Transport and Telecommunication, 2021, volume 22, no. 1, 87–97
Transport and Telecommunication Institute, Lomonosova 1, Riga, LV-1019, Latvia
DOI 10.2478/ttj-2021-0007

     A VISION-BASED REAL-TIME ADAPTIVE TRAFFIC LIGHT
     CONTROL SYSTEM USING VEHICULAR DENSITY VALUE
        AND STATISTICAL BLOCK MATCHING APPROACH
                   Janak D. Trivedi1, Mandalapu Sarada Devi2, Dhara H. Dave3
         1
          Government Engineering College Bhavnagar, Electronics & Communication Department,
                                  Gujarat Technological University,
                                            Gujarat, India
                                   Trivedi_janak2611@yahoo.com
         In India, traffic control management is a difficult task due to an increment in the number of vehicles for the same
infrastructure and systems. In the smart-city project, the Adaptive Traffic Light Control System (ATLCS) is one of the major
research concerns for an Intelligent Transportation System (ITS) development to reduce traffic congestion and accidents, create a
healthy environment, etc. Here, we have proposed a Vehicular Density Value (VDV) based adaptive traffic light control system
method for 4-way intersection points using a selection of rotation, area of interest, and Statistical Block Matching Approach
(SBMA). Graphical User Interface (GUI) and Hardware-based results are shown in the result section. We have compared, the
normal traffic light control system with the proposed adaptive traffic light control system in the results section. The same results are
verified using a hardware (raspberry-pi) device with different sizes, colors, and shapes of vehicles using the same method.
Keywords: Adaptive Traffic Light Control System (ATLCS), vehicular-density value (VDV), area of interest (AOI), raspberry-pi,
Intelligent Transportation System (ITS), Graphical User Interface (GUI)

1.    Introduction

       The violation of traffic light control systems can cause an accident. According to the Ministry of
Road Transport and Highways (MORTH), India ranked 1st among the number of road accident deaths
across the 199 countries in the World Road Statistics in 2018. A total of 4,67,044 road accidents have
been reported which is increased by 0.46% compared to the year 2017. ATLCS does not reduce traffic
accident but it’s also avoided traffic collisions/congestions problem, reduce time-delay, etc. ATLCS
requires continuous data or information from respective intersection points to the control unit at
respective urban areas. Information Communication Technology (ICT) is useful for the development of
smart cities and ITS.
       In recent years, different image-video processing-based methodology is very useful for the
development of an ITS. An autonomous vehicle requires this must technology for better reliability, safety,
and flexibility. A Global Positioning System (GPS) opens the door for Vehicle to Vehicle (V2V), Vehicle
to Infrastructure (V2I), Vehicle and handheld device (V2D), and Connected Vehicle Signal Control
Strategy (CVSC). In this paper, we have used the image-video processing-based methodology for the
development of ATLCS.

1.1. Motivation
        Since the intelligent method of traffic light control system developed as per offline tool,
TRANSYT (Robertson, 1969), Fixed time-plans for traffic junction, need to be enhanced and technology
adaptive. Adaptive Traffic Light Control System is applied for real-time traffic information to minimize
the delay of traffic, minimize the delay of pedestrians, minimize the delay of public transport, maximize
reliability, minimize environmental impact, etc. A fixed time interval-based traffic light control system
cannot accommodate day to day traffic congestion.
        One of the limitations of Sensor-based optimizer to adequate with real-time traffic condition also the
same time requires synchronization of individual Inductive Loop Detector (ILD) and requires additional
installation if not installed earlier. In the case of a fixed-time traffic signal, we have to wait for a complete
cycle of rotation with fixed time whether traffic is present or absent., whereas in case Adaptive Traffic Light
Control System traffic time interval can be changed based on a different strategy or a traffic model.

                                                                  87
Transport and Telecommunication                                                          Vol. 22, no.1, 2021

       Different road-traffic models are discussed by Mfenjou et al. (2018). Maxband (Maximize
Bandwidth) includes a two-way main road, with specifying passage time between the intersection point.
Transyst (Traffic Network Study Tool) works on off-line optimization, which requires a lot of input
parameters at intersection points. Prodyn is an adaptive traffic system for minimizing delay at intersection
points. OPAC (Optimized Policies for Adaptive Control) works on a dynamic algorithm for minimizing
stops at intersection points, the upgraded version of the system is OPAC-1,2,3 and 4. SCOOT (Split
Cycle and Offset Optimization Technique) is an optimized control system that includes the duration of
green light, offset between neighbouring intersections, and light cycles. This system also collects
information about the number of vehicles per time interval. SCATS (Sydney Coordinated Adaptive
Traffic System) is used information from sensors installed on the road for changing real-time traffic light
plans at intersection points. Rhodes (Real-time Hierarchical Optimized Distributed Effective System)
works on the concept of vehicular network. Insync has used image processing techniques for detecting
vehicles and change traffic signals accordingly in real-time as per traffic demand.

1.2. Organisation of the paper
       The remaining part of the paper is organized as follows: In Section 2, we have presented the
Traffic Control System (TCS) using a different methodology. This part presents a survey of different
image-video processing techniques, trends, and applications for the ITS. This part also indicates future
scope from each of the respective articles. In section 3, we have presented the proposed method with a
flowchart. In this part statistical block matching (SBMA) approach with pseudocode is explained. Section
4 and section 5 are indicating the GUI-based adaptive traffic control system and the Raspberry-pi
(Hardware) –based adaptive traffic control system and results respectively. As for section 6, we have
discussed the methodology and results with its objective outcomes. Finally, section 7 shows the
conclusion and future scope of the presented work.

2.   Traffic Control Management System using a different methodology

        An image-video analysis is useful in traffic control management in terms of real-time an automatic
parking management system, adaptive traffic control system, vehicle classification, automatic vehicle
guidance system in a driverless vehicle, detection of static or movable objects, speed measurements,
vehicle counting, incident detection such as an accident or congestion, automatic lane finding, different
sign detection and recognition, and many more could be added in the list.
        Kastrinaki et al. (2003) have explained a survey on a different aspect of video-processing
techniques. Automatic Lane Finding (ALF) and Object detection for the stationary and moving camera
are discussed with different approaches. ALF is discussed using (1) lane-region detection (2) feature and
(3) model-driven approaches. Object detection is explained using (1) Thresholding (2) Multigrid
identification of Region of Interest(ROI) (3) Edge-based detection (spatial differentiation) (4) Space
signature (5) Background frame differencing (6) inter-frame differencing (7) Time signature (8) Feature
aggregation and object tracking (9) Optical flow field (10) Motion parallax (11) Stereo vision (12) Inverse
perspective mapping (13) 3D Modelling and forward mapping. In smart traffic management or adaptive
traffic management is required (A) quickly changes and adapt system accordingly environmental changes
and (B) automatic updating data or information from different sources.
        Lozano et al. (2009) have presented Total Recognition by Adaptive Classification Experiments
(TRACE) is described in this paper using feature selection/feature extraction with the help of the k-means
clustering algorithm. The future scope from this article is finding real-time proper vehicle classification
and vehicle counting. Video processing is a useful tool for finding vehicle velocity, stopped vehicles,
travel time and queue length, traffic density for measurement of an automatic traffic control system,
license plate detection, incident detection, vehicle size and vehicle shape for vehicle classification &
vehicle counting approaches, lane departure warning (or ALF), vehicle direction and traffic sign detection
and recognition for driverless vehicle approach using Hough Transform in Bubenikova et al. (2012) for
Advance Driver Assistance System (ADAS).
        Mu et al. (2015) has explained the traffic light detection and recognition process, firstly from RGB
(Red-Green-Blue) to HSV (Hue-Saturation-Value) conversion then apply the filtering process and finally
for recognition, a histogram of oriented gradients (HOG) features and Support Vector Machine (SVM) is
used. ADAS is required for the detection and recognition of not only circular traffic lights but also traffic
lights in a horizontal and vertical arrangement. Trained Red, Yellow, and Green traffic light and

                                                     88
Transport and Telecommunication                                                           Vol. 22, no.1, 2021

Gaussian-like traffic light colour distribution are assumed. The limitation of the proposed method is that
the method performs well only in daytime and false measurement increase during night time. Future work
is the detection and recognition of more types of traffic lights.
        Intelligent Transportation System (ITS) in a smart city or a smart road requires continuous
monitoring of traffic data with good quality of image/video for the betterment of traffic engineering is
explained by Bommes et al. (2016). The author analysed traffic with (1) Automatic Incident Detection
(AID) of a dangerous traffic situation (2) Traffic count: direction detection of vehicles by Automatic
Number/License Plate Recognition (ANPR/ALPR) (3) State recognition: classify traffic like congestion,
slow traffic, and dense traffic. In that process Optical flow method and frame differencing method was
used (4) Traffic management: video detection system for a dangerous object, shortening decision travel
time, parking lot monitoring and management system, vehicle counting using Principal Component
Analysis (PCA) (5) Measuring speed, toll collection, etc. Different application-wise technology matrix is
mapped in terms of vision details as (a) Traffic webcam resolution (b) Traffic surveillance camera
resolution (c) High-detail camera resolution. Future applications categorized as (i) Short-term, in which
automatic recognition and automatic incident detection with the adaptive traffic control system is targeted
(ii) Mid-term, in which Video-based technology for a better environment is focused and (iii) long-term, in
which Communication with automated vehicles is set.
        Chandan et al. (2017) has described as Connected Vehicle Signal Control (CVSC) for speed and
location information using Global Positioning System (GPS) enabled vehicles. This method is compared
with an adaptive traffic signal control simulation developed by PTV EPICS. Different traffic situations
were tested in VISSIM 8 microscopic simulation tool. Limitation of Connected Vehicles (CV) during
communication failure, which decreases the penetration rate. Future work is in the direction of real-time
implementing the proposed method for adaptive traffic control management.
        Makino et al. (2018) have given detail of Electric Toll Correction (ETC), Vehicle Information
Communication Service (VICS), ETC 2.0 technology development as a part of the Intelligent
Transportation System (ITS) in Japan. The combination of automatic driving system, ETC 2.0 is helpful
for driver information about changing routes, changing lanes, avoid a collision, etc.
        Traffic management project in Phnom Penh, the capital city of the Kingdom of Cambodia is
discussed by S. Matsuoka (2018). Mainly two objectives are explained: (1) improve road traffic
conditions with the help of a traffic control system, pavement markings, traffic signs, median dividers (2)
transfer traffic management technology to local counterparts so that the project continues. First, this
project is analysed before the implementation of the project: (i) the total number of registered vehicles (ii)
traffic condition with a variety of vehicles, roads, driving behaviour, shortage of parking spaces (iii)
pavement markings, traffic signs and other facilities. This project method is assessed with the listed
benefits in the city like an increase in average speed and reduction in fuel consumption, emission, stop,
delay, crash, travel time. The adaptive traffic control system with the same traffic volume for 2
intersection points with enabling and disabling during 1-hour time duration is measured and results are
more prominent for enable condition of the adaptive traffic control system. Future challenges are listed as
(a) proper operation and maintenance of the system (b) safety education and campaigning traffic rules
among road users (c) expansion and up-gradation of the system.
        Krzysztof et al. (2018) have explained smaller size cells compared to the Negel-Schreckenberg
traffic model using cellular automaton (CA). The model is demonstrated with different driver behaviours:
(1) The carefree driver (2) The driver with little skills (3) The standard driver. In this article, the count-
down timer effect is useful for different driver approaches positively. Future work with more reliability of
work, from a traffic light, mounted at intersection points.
        Zhang et al. (2018) have described as a traffic decision using Case-Based Reasoning (CBR) and
was verified by example. Different modules are considered for traffic management easy of operation,
listed as (1) traffic information acquisition module (2) emergency scene information module (3) human-
computer interface module (4) emergency modelling module (5) aid decision-making module and (6)
database module. Generally, the CBR case solving process includes four steps (a) Retrieve -the case (b)
Reuse- case information and knowledge (c) Revise- if the large difference between previous and targeted
case (d) Retain – the new solution. In this paper, case base characteristic attributes are mainly traffic peak,
traffic type, place, whether, area, number of causalities, and number of damaged cars, and many more.
Find similarities of various attributes in terms of (i) local similarity – enumerated, numerical, fuzzy (ii)
overall similarity.
        Rabbouch et al. (2018) has proposed an online video processing based automatic traffic control
system model using Motion Intensity Index (MII) with a cumulating vision score frame by frame. After
simple regression (linear regression) and wavelet regression (independent regression) forecast and convert
MII into several vehicles for expected traffic flow counting and monitoring. Mfenjou et al. (2018) have
explained different methodology-technology, application, and trends for developing an Intelligent

                                                      89
Transport and Telecommunication                                                            Vol. 22, no.1, 2021

Transportation System (ITS) in sub-Saharan Africa countries using Information Communication
Technology (ICT). A hybrid system, a combination of four modules is discussed: (1) autonomous
management of control system- to maximize communication coverage and a minimum number of control
points (2) detection and diffusion of disturbance- to reduce congestion (3) dynamic route planning which
is collaborated with disturbance detection (4) monitoring of sections- to reduce accidents in the road.

3.   The Proposed method with flow-chart

                                   Figure 1. Flow-chart of the proposed method

                           Figure 2. Flow-chart of rotation, area of interest, SBMA, VDV

        A real-time ATLCS is developed using database management, selection of area of interest,
selection of different image-video related properties for four-way intersection points, and combination of
VDV and SBMA. Figure 1 represents the flowchart of the proposed method and figure 2 represents
cropping, rotation, area of interest, SBMA, and VDV. In a normal traffic light control systems timing
rotation and interval both are fixed irrelevant of any traffic condition, whereas in ATLCS visual
information and vehicle density-based traffic timers are changing continuously.

                                                        90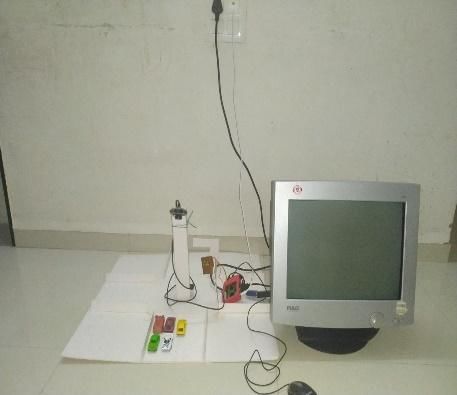
Transport and Telecommunication Vol. 22, no.1, 2021
We have implemented our proposed method in software and hardware. GUI-based and Hardwar
(Raspberry-pi)-based results are shown in result sections. SBMA, VDV method, and Pseudocode are
represented in sections 3.1 and 3.2. Real-time video or location are inserted in GUI formation for video-
1,2,3 and 4 respectively. Rotation is one of the important selections for a proper selection of are of
interest as well as for a vehicle density information. A simple 0o, 90o- left, 90o- right, and 180o rotation
are required as per the selection of visual information. One of the novels approaches in the proposed
method is the selection of a reference frame implemented using VDV. In the case of background
subtraction method normally reference frame is selected, when there is no object in the image, whereas in
the proposed method, liberty of selection for the reference frame. That first frame may contain a large
number of objects, a small number of the object or none of them. We can also select an area of interest at
any instant of time for real-time ATLCS measurements along with intersection points after cropping,
rotation, and VDV is explained in section 3.1 with sets of equations and with pseudocode in section 3.2.
This method works with spatial domain in the field of image-processing techniques.
3.1. SBMA & VDV
X min Min( xul , xll ) and X max Max( xur , xlr ) , (1)
Ymin Min(yul , yll ) and Ymax Max(yur , ylr ) , (2)
X dist X max X min 1 and Ydist Ymax Ymin 1 , (3)
yur yul
yul yur
If xul X dist * yul else xul yul yur , (4)
X dist 1
y y
yll ylr
If xll X dist * yll else xll yll lr ll ylr , (5)
X dist 1
x xul
xul xur
If yul Ydist * xul else yul xul ur xur , (6)
Ydist 1
x xll
xll xlr
If yll Ydist * xll else yll xll lr xlr , (7)
Ydist 1
4
( j 1)*90 ,
j 1
(8)
n
icrop ] and mean 1
N
A [i i 1
ref
N
[A ] ,
i 1
i
(9)
VDV mean(mean( AOI )) , (10)
if R i 1 fc fc f s else f
c f c fl . (11)
All the abbreviations are as mentioned below:
Xmin is minimum value of X-point, Xmax is maximum value of x-point,
Ymin is minimum value of Y-point, Ymax is maximum value of y-point,
xul is upper-left value of x-point, yul is upper-left value of y-point,
xll is lower-left value of x-point, yll is lower-left value of y-point,
xur is upper-right value of x-point, yur is upper-right value of y-point,
xlr is lower-right value of x-point, ylr is lower-right value of y-point
Xdist is distance of x-point from a center location, Ydist is distance of y-point from a center location,
Ri represents ith road location (here i=1,2,3 or 4), fl represents last-product calculation,
fc represents current-Frame of the selected road, fs represents total number of skipped frames road,
iref represents reference-image intensity value, icrop represents crop-image intensity value.
All the statistics block-matching approach and cropping measurements of the selected roads are
done using a defined set of equations (1) to (7). After reading the video, rotate video with the desired
91
Transport and Telecommunication                                                            Vol. 22, no.1, 2021

direction using selected theta (θ) if required. Here, θ values are varied as 0o, 90o -left, 90o-right, and 1800,
which is derived using equation (8). Vehicle Density Value is measured using equation (9) and (10) with
the combination of mean values of selected AOI row and column position. After selection of rotation,
video, crop, area of interest, density values, GUI simulation provides ATLCS with timing and light
control as well as remaining time of current junction and vehicle on-off time, to the next junction, i.e. If
road-A indicates green signal then next 5 seconds is waiting time with yellow signal for the road- A and
the same time with same yellow signal for Road-B provides information, ‘about to start’ this junction. In
a fixed-time interval traffic light control system, the interval is fixed irrespective of vehicle information
on the road, so there is not about-to start information needed. This way the proposed method also controls
air pollution and gives better environmental conditions. In the process of GUI simulation when one road
act as active at the same time another road should be passive. This is done using equation (11).
        In this method, VDV is calculated using the mean of the selected AOI. First select, AOI for the
selected roadside in the traffic signal. AOI calculates pixels’ values information using matrix-vector
operation for the selected region. The first time ‘mean’ operation applies to selected region which
calculates mean of row and column pixel value. Then again ‘mean’ operation applies which provides
single value. That single value represents density value information for the selected traffic roadside.
        Nowadays, traffic surveillance systems available to monitor traffic in the city. In this article, θ
represents the rotation of the camera situated at four-way intersection points in the city. θ value is varied
as 0o which represents traffic situation capture with camera position at traffic Road-A (fixed camera
position), θ value is varied as 90o -left which represents traffic situation capture with camera position at
traffic Road-B (camera rotates in 90o –left direction), and similar condition for the different choices of θ.
The single-camera situated at four-way intersection points with rotation facility can also monitor traffic
signals at the traffic junction using the rotation θ. The selection of θ is not a necessary step to implement
this method.

3.2. Pseudocode

         Time difference = Time out for traffic light
                  If road==1 to 4, Current threshold = from final image 1 to 4
                  Otherwise, Current threshold = 0
                  If road==1 to 4, Minimum threshold = Adaptive Threshold value
                  Otherwise, Minimum threshold = 0
         Traffic Light Condition
                  Waiting Time (Yellow color) = 5 Second
                  Allow time (Green Light) = 15 Second
                  Time difference = Time out for traffic light
                           If road 1 to 4 selected but video not uploaded,
                                     If, Time difference < Required stop time
                                               Set traffic time, with Stop=Red signal,
                                     Otherwise, Time difference > Required stop time
                                               Start timer count
                                                         If road 1 then change road 2
                                                         If road 2 then change road 3
                                                         If road 3 then change road 4
                                                         If road 4 then change road 1
                                                              Color change
         Current Threshold > Adaptive Threshold value and Time difference < Allow time
                                     Traffic timer stops.
         Current Threshold < Adaptive Threshold value or Time difference > Allow time
                                     Traffic timer stops and goes to the next road.
         Color Change Function in times box
                  Number1= Red
                  Number2= Green
                  Number3= Yellow
         Display Traffic time
                  Four different roads
                  Use Number to string operation, display road wise respectively

                                                      92
Transport and Telecommunication Vol. 22, no.1, 2021
4. Result: GUI-based adaptive traffic control system
Figure 3 represents all roads A, B, C, D are blocked with a red signal. Figures 4 and 5 are shown
with a yellow and a green light signal. For controlling air pollution, a wait signal is operated in two
continuous roadsides. After completion of a green signal in the road-A side, a yellow signal indicates the
reserved time for vehicles, at the same time the same reserved period indicates vehicle start time to Road-B.
In the current scenario vehicles engine are mostly in on condition at the junction points, so this reserved
period is helpful for vehicle engine ON/OFF time.
Figure 3. The starting phase with all red signal
Figure 4. A yellow signal – waiting time 5 seconds
93Transport and Telecommunication Vol. 22, no.1, 2021
Figure 5. A green signal in one direction for 15 seconds
5. Result: Raspberry-pi (Hardware)-based adaptive traffic control system module
Figure 6. (a) Prototype model (b) Model connected using Raspberry-pi (c) Result for adaptive traffic
control system using Raspberry-pi
The same method is uploaded to the raspberry-pi module. A hardware implementation of the
raspberry-pi module is done using Simulink. During uploading the program to hardware first step is
checking board parameter values with the connected environment. Then the next step is to select the build
options, Serial Peripheral Interference (SPI) bus speed, external mode, and ports. With the help of
deploying function, the same algorithm is programmed into raspberry-pi.
Figure 6 (a), (b), and (c) represent the prototype model and results for ATLCS. The proposed
method is also applied in hardware with the use of the raspberry-pi 3B model. This hardware does not
require any additional software installation; we can just plug into any monitoring system. Here, real-time
ATLCS is managed in a prototype model with different vehicle sizes, shapes, colors, and numbers.
94Transport and Telecommunication Vol. 22, no.1, 2021
3 different colors Light Emitting Diode (LED) with green, yellow, and red are used. Green LED for
indication of ‘Drive’ status, yellow for ‘Wait’ status, and red for ‘Stop’. Here, visual information is
obtained using a USB camera. The display device is used for monitoring results. In monitoring screen
waiting time, stop time, and drive time is continuously indicating with real-time changes in toy car
replacement.
Table 1. Video Properties used in GUI simulation, resolution 640 X 360 frame rate in frames/second
Road Total Frame Rotation Cropping Area of Interest Density
Frame Rate value$
Road-A 9000 30 180 [270,635,10,355] [1,360,10,145] ~5-10
Road-B 8992 29.97 90-Left [150,350,10,450] [80,200,1,430] ~3-7
Road-C 7500 25 0 [320,640,1,355] [1,315,180,350] ~1-2
Road-D 7193 23.98 90-Left [1,360,1,640] [35,185,15,640] ~18-25
$
Density values are selected from the probability of allowable time/vehicles for a particular road-side. It may be varied with
different parameters.
VDV is depended mainly on AOI, vehicle color and size, number of vehicles. In the presented
method, VDV is decided by trial and error method with maximum likelihood possibility for managing
ATLCS. Different values of VDV can affect the number of passing vehicles, light, and timing of the TCS.
The pseudocode represents the use of traffic light condition, timers, adaptive thresholding, color changes,
and display traffic timer function for the proposed ATLCS.
Table 2. Compare the timing diagram for a different traffic control system
Traffic Control System Timing in second, stop time – 40, drive time – 15, wait time – 5.
Road A Road B Road C Road D
Fixed Traffic Light Control 15 + 5 40 40 40
System 40 15 + 5 40 40
40 40 15 + 5 40
40 40 40 15 + 5
Fixed Traffic Light Control 15 + 5 40 – 5 40 40
System (Without VDV, With 40 15 + 5 40 – 5 40
Remaining time, full traffic) 40 40 15 + 5 40 – 5
40 – 5 40 40 15 + 5
Fixed Traffic Light Control 15 + 5 30 – 5 45 – 5 60 – 5
System (With VDV*, With 60 – 5 15 + 5 30 – 5 45 – 5
Remaining time, full traffic) 45 – 5 60 – 5 15 + 5 30 – 5
30 – 5 45 – 5 60 – 5 15 + 5
Adaptive (With VDV*, With 10 + 5 25 – 5 40 – 5 55 – 5
Remaining time, controlled 57 – 5 12 + 5 27 – 5 42 – 5
traffic) 38 – 5 53 – 5 8+5 23 – 5
29 – 5 44 – 5 59 – 5 14 + 5
* As per changes in VDV values complete cycle rotation of road A-B-C-D-A also vary, it provides always a higher number of cycle
rotation compares to normal traffic light control system.
6. Discussion
We have proposed a vision based constant ATLCS for a 4-way crossing point, utilizing a
determination of turn, AOI, VDV, and SBMA. Figure (1) and figure (2) shows a flowchart of the
proposed technique. Figure (3) to figure (6) speaks to Graphical User Interface (GUI) based simulation
results for 4-way intersection point (Sub-figures are turned according to single-camera see with a fixed
situation at crossing point). Similar outcomes are additionally checked to utilize equipment (raspberry-pi)
with various sizes, colours, and shapes of vehicles utilizing a similar technique. A prototype module
appears in figure 6(a), figure 6(b) shows associated set-up of equipment and screen, and in figure 6(c)
shows the result for versatile traffic light control framework utilizing equipment (raspberry-pi) gadget
with "Pause" (for 15 second or no vehicle out and about) and "Drive" (for 45 seconds or most extreme
number of vehicles for particular side) message on the screen. S. Srivastava et al. (2016) expresses
ATLTC with a period stream outline for a solitary side, though here the proposed technique for a 4-way
intersection point. In the outcome segment we have compared, the typical traffic light control framework
with the proposed versatile traffic light control framework in Table 2 with the assistance of the span of
time-stamps.
95Transport and Telecommunication Vol. 22, no.1, 2021
The proposed technique is expelled restriction of fixed time traffic light control framework
structured by offline tool TRANSYT (1969). This technique likewise controls traffic at the 4-way
crossing point focuses, which is an improved adaptation of the ATLTC (2016). Table 1 shows various 4-
video properties and Table 2 shows the correlation of the diverse traffic control frameworks with the
planning cycle.
7. Conclusions & Future-scope
We present, vision-based continuous ATLCS. This strategy gives an improvement as far as a more
noteworthy number of complete cycle revolution for road, for example, A-B-C-D-A compared with the
fixed traffic-light control framework. If there is no vehicle or few vehicles present at any single (road-
side-A), opposite side streets (road-side B, C, D) get profited in the wake of discovering relative vehicle
density data. As appeared in table 2, road A, B, C, and D decrease 5, 3, 7, and 1-second cycle revolution
individually compared to fixed time traffic light control system. The proposed strategy limits traffic delay
which helps to reduce traffic congestions, environmental effects. The reserved-time idea is likewise
valuable for the information on vehicle on-off time, it might assist with lessening fuel utilization just as a
superior natural condition. The constraint of this work is, the proposed technique relies upon the vision
framework introduced at convergence focuses that have variable video properties.
In a future work try to installed the proposed method for any junction points to obtain the
outcomes and effect on the same.
References
1. Robertson, D. I. (1969) TRANSYT: A Traffic Network Study Too, RRL Report LR 253, Road
Research Laboratory Crowthorne, Berkshire.
2. Kastrinaki, V., Zervakis, M., Kalaitzakis, K. (2003) A survey of video processing techniques for
traffic applications. Image Vis. Comput., 21(4), pp. 359–381.
3. Lozano, A., Manfredi, G., Nieddu, L. (2009) An algorithm for the recognition of levels of
congestion in road traffic problems. Math. Comput. Simul., 79(6), pp. 1926–1934.
4. Bubeníková, E., Muzikářová, L., Halgaš, J. (2012) Application of image processing in intelligent
transport systems. IFAC Proc. Vol., 11(1), pp. 53–56.
5. Mu, G., Xinyu, Z., Deyi, L., Tianlei, Z., Lifeng, A. (2015) Traffic light detection and recognition for
autonomous vehicles. J. China Univ. Posts Telecommun., 22(1), pp. 50–56.
6. Nemade, B. (2016) Automatic Traffic Surveillance Using Video Tracking. Procedia Comput. Sci.,
79, pp. 402–409.
7. Małecki, K. (2016) The Importance of Automatic Traffic Lights Time Algorithms to Reduce the
Negative Impact of Transport on the Urban Environment. Transp. Res. Procedia, 16(March),
pp. 329–342.
8. Bommes, M., Fazekas, A., Volkenhoff, T., Oeser, M. (2016) Video Based Intelligent Transportation
Systems - State of the Art and Future Development. Transp. Res. Procedia, 14, pp. 4495–4504.
9. Srivastava, S. et al. (2016) Adaptive Traffic Light Timer Control (ATLTC), Adaptive Traffic Light
Timer Control (ATLTC) – NERD.
10. Chandan, K., Seco, A. M., Silva, A. B. (2017) Real-time Traffic Signal Control for Isolated
Intersection, using Car-following Logic under Connected Vehicle Environment. Transp. Res.
Procedia, 25, pp. 1610–1625.
11. Kotov, A., Pospelov, P. (2017) Engineering Tools and Methods of Estimation of Traffic Capacity
Using Mobile Video Monitoring. Transp. Res. Procedia, 20, pp. 347–354.
12. Makino, H., Tamada, K., Sakai, K., Kamijo, S. (2018) Solutions for urban traffic issues by ITS
technologies. IATSS Res., 42(2), pp. 49–60.
13. Nagy, A. M., Simon, V. (2018) Survey on traffic prediction in smart cities, Pervasive Mob.
Comput., 50, pp. 148–163.
14. Aibin, M. (2018) Traffic prediction based on machine learning for elastic optical networks. Opt.
Switch. Netw., 30, pp. 33–39.
15. Rabbouch, H., Saâdaoui, F., Mraihi, R. (2018) A vision-based statistical methodology for
automatically modeling continuous urban traffic flows. Adv. Eng. Informatics, 38, pp. 392–403.
16. Matsuoka, S. (2018) Traffic management project in Phnom Penh. IATSS Res., 42(4), pp. 180–189.
17. Mfenjou, M. L., Abba Ari, A. A., Abdou, W., Spies, F., Kolyang (2018) Methodology and trends for
an intelligent transport system in developing countries, Sustain. Comput. Informatics Syst., 19,
pp. 96–111.
96Transport and Telecommunication Vol. 22, no.1, 2021
18. Zhang, H., Dai, G. L. (2018) Research on traffic decision making method based on image analysis
case-based reasoning. Optik (Stuttg)., 158, pp. 908–914.
19. Małecki, K., Iwan, S. (2019) Modeling traffic flow on two-lane roads with traffic lights and
countdown timer, Transp. Res. Procedia, 39, no. 2018, pp. 300–308.
20. Dodsworth, Joel Andrew (2018) The application of vehicle classification, vehicle-to-infrastructure
communication and a car-following model to single intersection traffic signal control, Ph.D. thesis,
University of Leeds.
97You can also read