Extremely Low Molecular Gas Content in the Vicinity of a Red Nugget Galaxy at
←
→
Page content transcription
If your browser does not render page correctly, please read the page content below
D RAFT VERSION N OVEMBER 13, 2020
                                                 Typeset using LATEX twocolumn style in AASTeX63

                                                 Extremely Low Molecular Gas Content in the Vicinity of a Red Nugget Galaxy at
                                                                                 z = 1.91
                                                             T. M ORISHITA , 1 Q. D’A MATO , 2, 3 L. E. A BRAMSON , 4 A BDURRO ’ UF , 5 M. S TIAVELLI , 1          AND   R. A. L UCAS 1
                                                                   1 Space Telescope Science Institute, 3700 San Martin Drive, Baltimore, MD 21218, USA; tmorishita@stsci.edu
                                                                                2 INAF/IRA, Istituto di Radioastronomia, Via Piero Gobetti 101, 40129, Bologna, Italy
                                                                3 Dipartimento di Fisica e Astronomia dell’Università degli Studi di Bologna, via P. Gobetti 93/2, 40129 Bologna, Italy
arXiv:2011.06051v1 [astro-ph.GA] 11 Nov 2020

                                                                                   4 The Carnegie Observatories, 813 Santa Barbara Street, Pasadena, CA 91101, USA
                                                                                   5 Institute of Astronomy and Astrophysics, Academia Sinica, Taipei 10617, Taiwan

                                                                                                                Submitted to ApJ

                                                                                                                   ABSTRACT
                                                         We present Atacama Large Millimeter/submillimeter Array (ALMA) Band 5 observations of a galaxy at
                                                       z = 1.91, GDS24569, in search of molecular gas in its vicinity via the [C I] 3 P1 -3 P0 line. GDS24569 is a
                                                       massive (log M∗ /M = 11) and passively evolving galaxy, and characterized by compact morphology with an
                                                       effective radius of ∼ 0.5 kpc. We apply two blind detection algorithms to the spectral data cubes, and find no
                                                       promising detection in or around GDS24569 to projected distance of ∼ 320 kpc, while a narrow tentative line
                                                       (4.1σ) is identified at +1200 km / s by one of the algorithms. From the non-detection of [C I] in these deep data
                                                       cubes, we place a 3σ upper limit on molecular hydrogen mass, ∼ 1.5 × 10⁹ M , which converts to an extremely
                                                       low gas-to-stellar mass fraction, <  ∼ 1%. In combination with a previous result of an insufficient number of
                                                       surrounding satellite galaxies, it is suggested that GDS24569 is unlikely to experience significant size evolution
                                                       via satellite mergers. We conduct a spectral energy distribution modeling by including optical-to-far-infrared
                                                       data, and find a considerably high (∼ 0.1%) dust-to-stellar mass ratio, ∼ 10-100× higher than those of local
                                                       early-type galaxies. We discuss possible physical mechanisms that quenched GDS24569.

                                                       Keywords: galaxies: evolution – galaxies: formation

                                                                    1. INTRODUCTION                                             scope (HST) and the adaptive optics of ground based facil-
                                                  The origin of the most massive galaxies in the local uni-                     ities revealed that some of them have even smaller radius
                                               verse has been a long standing subject of galaxy evolu-                          compared to the local counterpart at a similar mass, by a fac-
                                               tion. From analysis of stellar populations and chemical abun-                    tor of ∼ 5 (van Dokkum et al. 2008; Damjanov et al. 2009;
                                               dances of local galaxies, it has been inferred that the most                     Szomoru et al. 2010). Given the absence of such a compact
                                               massive galaxies in the local universe completed their forma-                    galaxy population in normal fields in the local universe (Shen
                                               tion at redshift z >                                                             et al. 2003; Taylor et al. 2010, but see Valentinuzzi et al. 2010
                                                                  ∼ 2 (Kauffmann et al. 2003; Thomas et al.
                                               2003; Gallazzi et al. 2005; Treu et al. 2005; McDermid et al.                    for their presence in dense fields), the transition of galaxies in
                                               2015). Recent near-infrared (NIR) observations indeed found                      the size-mass plane implies that many high-z compact galax-
                                               many distant galaxies to be already quenched, showing con-                       ies would have to experience significant size evolution.
                                               sistency with the quenching timeline inferred from local and                        Various scenarios of significant size evolution for compact
                                               low-z universe (Brammer et al. 2009; Marchesini et al. 2009;                     galaxies have been proposed in the past decade, including
                                               Muzzin et al. 2013; Tomczak et al. 2014).                                        dry/wet, major/minor mergers (Khochfar & Silk 2006; Naab
                                                  Interestingly, a large fraction of high-z massive quenched                    et al. 2007; Hopkins et al. 2009; Naab et al. 2009; Nipoti et al.
                                               galaxies are characterized by compact morphology (Cimatti                        2009) and AGN feedback (Fan et al. 2008; Damjanov et al.
                                               et al. 2004; Daddi et al. 2005; Trujillo et al. 2007; Buitrago                   2009) (see Conselice 2014, for a thorough review). Among
                                               et al. 2008; Ichikawa et al. 2010; Cassata et al. 2011). While                   these scenarios, the dry minor merger scenario has been pop-
                                               the average size of galaxies is smaller at that high redshift                    ularly discussed and taken as the most successful scenario
                                               (Trujillo et al. 2006; Morishita et al. 2014; van der Wel et al.                 in terms of its efficiency of size increase; surrounding satel-
                                               2014), high resolution imaging by the Hubble Space Tele-                         lite galaxies accrete to the central compact galaxy, without
2
disturbing the central core, and in this way it can efficiently as a good alternative tracer of molecular hydrogen in extra-
evolve effective radii with a small increase of stellar mass galactic systems, originated from photodissociation regions.
(Naab et al. 2009; Hopkins et al. 2009; Oser et al. 2010; Tru- The paper is constructed as follows. In Sec 2, we describe
jillo et al. 2011), while not all of them may have to follow the our observations and data reduction. In Sec 3, we present
same path (Nipoti et al. 2012; Newman et al. 2012). The re- our analysis method of a blind search for gas in the ALMA
sulting stellar populations and mass profiles from this inside- data, and results. While the primary goal in this study is
out evolution are in good agreement with findings at inter- to search for surrounding gas, the dataset also provides us
mediate redshifts (van Dokkum et al. 2010; Patel et al. 2013; an opportunity to investigate the cause of quenching in the
Morishita et al. 2015; Papovich et al. 2015) and for local mas- central galaxy from a panchromatic analysis over optical-
sive galaxies (Belfiore et al. 2017; Ellison et al. 2018). to-far-infrared (FIR) wavelengths (Sec. 3.4). In Sec. 4, we
However, such an interpretation remains indirect, and the discuss our results and present our interpretation. Through-
data still admit other scenarios. For example, such compact out, magnitudes are quoted in the AB system assuming Ωm =
galaxies may not have to be the typical massive galaxy pop- 0.3, ΩΛ = 0.7, H0 = 70 km s−1 Mpc−1 , and we assume the
ulation at low redshift. In fact, there is a significant number Salpeter (1955) initial mass function.
of compact galaxies but more preferably in cluster environ-
ments (Valentinuzzi et al. 2010; Poggianti et al. 2013). It has 2. DATA AND ANALYSIS
also been proposed that the observed trend of average galaxy 2.1. Target galaxy
sizes reflects progenitor bias (e.g., Carollo et al. 2013; Fagioli
Our primary target, GDS24569, is a massive
et al. 2016), where large radius galaxies may appear at later
(log M∗ /M ∼ 11) galaxy at z = 1.91, originally reported
time and drive apparent size evolution while high-z compact
in Daddi et al. (2005). The galaxy is passively evolving,
galaxies remain as they are.
characterized by its spectral features, and has compact mor-
Toward more direct understanding of their following evo-
phology with effective light radius ∼ 0.5 kpc (Szomoru
lutionary path, Mármol-Queraltó et al. (2012) studied satel-
et al. 2010), which converts to stellar mass density of
lite galaxies around massive galaxies to calculate possible
log Σ∗ /M kpc−2 ∼ 11 (Fig. 1). Morishita et al. (2019)
size increase that would likely happen through accreting
analyzed its spectral energy distribution (SED) by fitting
these satellite galaxies. Interestingly, their results indicated
photometric and spectroscopic data points, and revealed that
that the extant satellite galaxies are not enough to account for
the galaxy experienced a very short period of star formation
significant size evolution to the local relation. Furthermore,
∼ 0.5 Gyr prior to its observed redshift, characterizing it as a
Morishita & Ichikawa (2016) studied a compact galaxy at
quenched galaxy (see also Sec. 4).
z = 1.91, GDS24569, in deep HST images from the extreme
On the size-mass plane, GDS24569 is located ∼ 2σ be-
deep field (XDF) project (Illingworth et al. 2016), to search
low the median size of passive galaxies at that redshift and
for satellite galaxies around it down to log M∗ /M ∼ 7.2.
stellar mass (van der Wel et al. 2014). To speculate its fu-
Their conclusion is that the number of satellites is not enough
ture evolutionary path, Morishita & Ichikawa (2016) inves-
either, and extra mass increase by, e.g. additional star forma-
tigated surrounding sources photometrically selected in ex-
tion, is required for GDS24569 to be on the local size-mass
tremely deep images from the XDF project (Illingworth et al.
relation.
2013), down to ∼ 108 M . There are insufficient satellite
This poses a question whether additional in-situ star for-
galaxies to move GDS24569 onto the local size mass rela-
mation is possible in such compact quenched galaxies. One
tion when following a simple formula for a minor merger
missing key component in these studies is gas, in particular
scenario, ∆r ∝ ∆M 2 (Naab et al. 2009). While GDS24569
in the form of molecular hydrogen. While the stellar compo-
may end up as one of the compact population found in the
nent is not enough for the mass increase required to be on the
local universe, it is worth investigating any contribution from
local relation, additional star formation caused by remaining
optically-dark components, which may trigger a significant
or newly accreted gas could change their sizes significantly
starburst and size evolution before we conclude.
(i.e. the scenario C in Morishita & Ichikawa 2016).
To answer the question, we here present new observa- 2.2. ALMA Cycle 7 observation
tions with the Atacama Large Millimeter/submillimeter Ar-
Interferometric observations with Band 5 were executed
ray (ALMA) on GDS24569. Our configuration allows wide
in ALMA cycle 7 (PID. 2019.1.01127.S, PI T. Morishita).
field-of-view (FoV) coverage to the extent of its virial radius,
We designed the observations so they would reveal gas
r ∼ 300 kpc. Due to the spectral window available for the
components down to ∼ 108 M within the virial radius of
source redshift, we target atomic carbon, [C I] 3 P1 -3 P0 (rest-
GDS24569, ∼ 300 kpc, via the [C I] emission line with an ex-
frame frequency 492 GHz, hereafter [C I]), which is known
citation temperature of ∼ 30 K. Since our purpose here is not
to resolve each gas clump, we optimize the antennas’ con-3
Cont.
-27.789
-27.789 Data2
Data1
Dec. / degree
-27.793
Dec. / degree
-27.794
-27.799 -27.798
-27.804 -27.802
53.148 53.153 53.158 53.163 53.168 53.152 53.157 53.161 53.166
R.A. / degree R.A. / degree
Figure 1. (Left): Pseudo RGB image (F160W+F814W+F435W of HST) of the observed field. The two ALMA pointings are overlaid (Data1
and Data2; white circles). The target, GDS24569, is centered in the image (red square). The position of the tentative detection found in Data2
(Sec. 3.2.2) is also shown (green circle), while no optical/IR counterpart is found at the position. (Right): Dust continuum map, created by
collapsing the entire frequency range of the combined data cube. The coordinates of the objects in the left panel are indicated with the same
symbols. No continuum emission is detected near the position of GDS24569. The beam size is shown at the bottom right (orange ellipse).
figuration for a large FoV, resulting in the final beam size
of 1.0 × 0.8 arcsec2 . We set three 1.875 GHz-width spec-
tral windows, one of which was tuned to cover the [C I] fre-
quency of the target (∼ 169 GHz), while the other two spec-
tral windows were centered on 168.5 GHz and 170.4 GHz for
a continuum estimate.
Our observations, originally executed in November 2019
with on-source exposure of 107 minutes, were accidentally
off the central pointing for ∼ 12 arcsec, while GDS24569
was still within the FoV (dubbed as Data2). The observa-
tions were compensated in January 2020, with the target in
the center as it was originally planned (Data1). We there-
fore acquired two datasets with the same setup for frequency
and exposure time as described above (Fig. 1), which allow
us an independent check on possible detection (Sec. 3). We
ran the tclean task of CASA on each of the datasets, with
parameters of pixel scale 0.16 arcsec and velocity resolution
element ∼ 28 km / s (∼ 15.6 MHz). Figure 2. (Top): Distribution of fluxes measured at 1000 random
positions in one of the data cubes. Fluxes are in units of mJy per
beam per spectral element. (Bottom): Radial distribution of RMSs
3. METHOD AND RESULTS estimated at each radius in the three data sets — Data1 (cyan), Data2
(yellow), and combined (red) cubes. Corresponding molecular hy-
3.1. Dust Continuum Emission drogen mass limits (3σ) for a line width of ∆v = 200 km /s are
In Fig. 1, we show a continuum map created by collapsing shown in the right y-axis.
the spectral data cube over the entire velocity range, −4000-
3000 km / s. No continuum source is detected near the po- et al. 2019). We will use the upper limit derived here for a
sition of GDS24569. Root-mean-squares (RMSs) are calcu- panchromatic analysis in Sec. 4.
lated by imstat of CASA; 27 µJy / beam and 34 µJy / beam
for Data1 and Data2, respectively, and 21 µJy / beam for the 3.2. Clump Finding Algorithm
combined data cube at the target source position. This non- Our primary goal in this study is to search for gas clumps in
detection of dust emission is consistent with the optical-to- the data cubes via the [C I] emission line, both in the position
NIR SED analysis of GDS24569, AV ∼ 0.4 mag (Morishita of GDS24569 and its neighboring regions out to r ∼ 300 kpc,4
Furthermore, none of these sources are commonly identified
in both of the data cubes. We thus conclude that all of the
detected clumps are artifacts. To confirm this, we also apply
the same method to the data cubes but with signs of fluxes in-
verted. We find a similar number of detections with a similar
spatial distribution as for the real cubes.
The spectrum extracted from the position of GDS24569 in
the combined cubes is shown in Fig. 3. No obvious line is
detected beyond the noise limit associated with each spectral
element.
Figure 3. Spectrum extracted in the position of GDS24569 in
the combined data cube, with an aperture of the beam size. No 3.2.2. D’Amato et al. (2020)’s method
significant flux excess is seen.
To double-check the non-detection in Sec. 3.2.1, we also
apply a blind detection method introduced in D’Amato et al.
which is its approximate virial radius. Despite a complicated
(2020), that relies on spectral, spatial and reliability criteria.
aspect of blind detection in interferometric data cubes, our
We perform the detection on the signal-to-noise-ratio-
advantage is that we have two independent data cubes, so
(S/N-) cube. In order to produce it, we firstly generate a
that any detection found in one data cube can be checked
noise-cube, where the pixels have the value of the RMS in
in the other. We start with a fiducial detection algorithm,
a box centered in them. We choose a box with an area equal
clumpdind (Williams et al. 1994), but also apply a method
to that of 10 beams, since we find that this size allows us to
introduced in D’Amato et al. (2020) to check the consistency.
trace the local variation of the noise in each channel, still
having enough statistics per box. The RMS is recursively
3.2.1. Starlink Clumpfind Algorithm
calculated to convergence masking all pixels above 3× RMS
To search for line detection across the data cubes, we apply at each iteration. The S/N-cube is then obtained as the ratio
an automated detection algorithm. We first run the clumpfind between the original data-cube and the noise cube.
algorithm, implemented in the starlink package (Currie In order to perform the detection, we firstly scan each
et al. 2014). One of the parameters for clumpfind is the spaxel searching for a given amount of contiguous channels
noise level of the data represented by RMSs. While imstat (Nch ) above a given S/N threshold. We search for Nch =2, 3,
of CASA provides a RMS value at each frequency value, 4, 5 (corresponding to ∼ 60, 90, 120, 150 km / s, respectively)
the noise is correlated significantly for our case with a rel- above a S/N threshold of 1.5, 2, 2.5 and 3. Then, among the
atively large beam size. Furthermore, the data show differen- candidate detections, we reject all those with a number of
tial noise structure along the radial direction from the center, contiguous pixels lower than a given amount Nch . For each
where larger noise structures frequently appear at a larger combination of Nch and S/N threshold, we try Npx = 2, 3, 4.
radius. To estimate a more realistic noise level, we extract Finally, in order to estimate the incidence of spurious de-
apertures of beam size in 1000 randomly selected positions tections, we perform the same algorithm on the “negative"
in each cube, to measure RMSs in annuli at every 10 pixels S/N-cube, where the pixels have the same value and inverted
from the center. As an example, the distribution of extracted sign of the original (“positive”) S/N-cube. Then, for any
fluxes is shown in the top panel of Fig. 2, where the dis- combination of Nch , S/N threshold and Npx we reject all
tribution is well fitted with a Gaussian. A radial distribu- the candidate detections obtained from the positive S/N-cube
tion of derived RMSs (= FWHM / 2.355 of Gaussian fit) are that have a peak S/N lower than the maximum peak S/N of
shown in the bottom panel of Fig. 2. The RMS varies from the detections obtained from the negative S/N-cube using the
σ ∼ 45 µJy / beam / spectral element at the innermost region same parameter combination. Finally, we crop the detection
to 130 µJy / beam / spectral element at the outermost region. area to the half-primary-beam-width.
We run the clumpfind algorithm on each of two data cubes From this analysis, we find one tentative detection (4.1 σ)
with various RMSs taken from the estimated range above. at +1200 km / s at projected distance ∼ 14 kpc away from
Other configuration parameters are also determined through GDS24569 in Data2 (top panel of Fig. 4). The line is narrow,
our initial tests (VELORES=5, MINPIX=50, and FWHM- and fitted with a gaussian of FWHM = 84 km / s (∼ 3 spectral
BEAM=3). With the setup, the algorithm initially detects elements). The total flux from the integral of the gaussian
∼ 100 sources from the entire FoV of each dataset for dif- fit is S[C I] ∆v ∼ 7.5 mJy km / s. However, the line is not
ferent RMS values. However, most of the identified clumps detected at the same spectral position in Data1, which is
are located at outer regions, r >
∼ 15 arcsec. Our visual inspec- ∼ 10.5 arcsec away from the center (bottom panel of Fig. 4).
tion does not confirm any of these clumps as real sources. This may be attributed to lower sensitivity at the position in5
Data1. We therefore leave this detection as tentative, while the dataset with a SED fitting code, gsf (ver.1.4). From
including this emission would not change our main conclu- Morishita et al. (2019), we retrieve broadband photometry
sion in Sec. 4. of HST and Spitzer up to IRAC CH4, originally published
by the 3D-HST team (Skelton et al. 2014). Deep spectra
3.3. Upper limits in molecular gas mass of WFC3-IR G102 and G141 presented in Morishita et al.
In this subsection, we attempt to place an upper limit (2019) are also included, which are critical to constrain its
on molecular hydrogen mass from the estimated RMSs in stellar populations and star formation history.
Sec. 3.2.1. Following a recipe by Papadopoulos et al. (2004, We include the upper limit on the continuum obtained from
also Wagg et al. 2006; Man et al. 2019), molecular hydrogen our ALMA observations (Sec. 3.1). We also include Spitzer
gas mass is inferred by: MIPS 24µm flux from Whitaker et al. (2014), and upper lim-
its on MIPS 70µm, Herschel PACS 100 and 160µm from the
D2l X[C I] GOODS Herschel program (Elbaz et al. 2011). The broad-
MH2 = 1375.8 ( −5 )−1
(1 + z) 10 band photometric data points used here are summarized in
A10 S[C I] ∆v Table 1.
×( −7 −1 )−1 Q−1
10 M . (1)
10 s Jy km s−1 Following Morishita et al. (2019), we use synthetic
spectral templates generated by fsps (Conroy et al.
The equation consists of two steps: conversion from ob-
2009), based on the MILES spectral library with the
served [C I] intensity to atomic carbon mass, and then to
Salpeter (1955) initial mass function, with age pixels of
molecular hydrogen mass. The conversion involves a cou-
[0.01,0.03,0.1,0.3,0.5,0.7,1.0,1.5,2.0,3.0] / Gyr, and metallic-
ple of parameters. We adopt the excitation factor Q10 = 0.5
ity of [-0.8,0.6] / log Z , the same parameter setups as in
as a fiducial value, assuming local thermodynamic equilib-
Morishita et al. (2019). The Calzetti et al. (2000) dust attenu-
rium (i.e. optically thin). Q10 ranges from 0 to 1, depending
ation model is adopted. We calculate FIR dust emission tem-
on the temperature, density and radiation field, though none
plates based on the recipe provided by Draine & Li (2007).
of these values can be constrained without line ratios to other
Due to the limited number of FIR data points, we limit the
excitation levels. We adopt a molecular [C I]-to-H2 conver-
calculation to their LMC model with qPAH = 2.37%.
sion factor, X[C I] = 5 × 10⁻⁵ following the median value
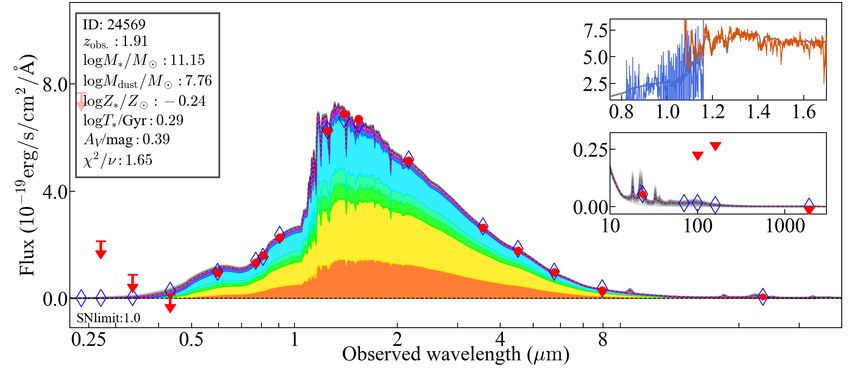
In Fig. 5, we show the best-fit SED and star formation his-
in Weiß et al. (2005). The conversion factor is known to be
tory of GDS24569. The result indicates that GDS24569 had
as low as ∼ 2 × 10⁵ (Frerking et al. 1989; Weiß et al. 2003;
the last primary star formation activity ∼ 0.5 Gyr ago, and
Jiao et al. 2019), and thus our choice of Weiß et al. (2005)’s
then rapidly declined its star formation activity by ∼ 100 Myr
value gives a conservative upper limit. The conversion to
before the observed redshift. Such a star formation history
molecular hydrogen mass includes the mass in Helium by a
is in fact speculated from the absence of significant flux at
correction factor of 1.36 (Solomon & Vanden Bout 2005).
rest-frame UV wavelength, as well as deep 4000 Å break and
A10 = 7.93 × 10⁻⁸ s−1 is the Einstein A-coefficient, and Dl
Balmer absorption lines seen in the deep grism spectra, char-
is the luminosity distance to the source redshift, z = 1.91.
acterizing GDS24569 as a post-starburst galaxy (Dressler &
Since our input for the equation above is the upper limit
Gunn 1983). Such rapid decrease in star formation activity
for flux density, we need to assume the line width to ob-
is also seen in other massive galaxies (Belli et al. 2019; Mor-
tain a velocity-integrated line intensity, S[C I] ∆v. We set
ishita et al. 2019), while their primary quenching process re-
∆v = 200 km / s as a typical line width from the literature
mains unclear. The low gas fraction and the inferred dust
(Weiß et al. 2005; Man et al. 2019), from which we ob-
mass of the system found in this study potentially add further
tain S[C I] ∆v ∼ 28 mJy km / s / beam as a 3σ upper limit in
constraints on the primary quenching mechanism (Sec. 4).
the position of GDS24569. By substituting this in the equa-
It is worth noting that the derived metallicity of
tion above, we obtain an upper limit on molecular hydrogen
GDS24569, log Z∗ /Z ∼ −0.2 dex, is ∼ 0.4 dex below the
mass to ∼ 1.5 × 10⁹ M , characterizing a significantly low
mean relation of massive, non-compact quenched galaxies at
gas mass fraction, < ∼ 1%. For the tentative line we found z ∼ 2 (Morishita et al. 2019). While the statistical signif-
in Sec. 3.2.2, the same conversion provides ∼ 4 × 10⁸ M ,
icance is still small due to the scatter around the mean re-
which is much smaller than a 3σ detection limit at this posi-
lation (∆ ∼ 0.2 dex), this may further provide us a hint to
tion (∼ 2 × 10⁹ M ; see the bottom panel in Fig. 2), due to
its following evolution; if GDS24569 is representative of the
its narrow line width.
compact galaxy population at this redshift, then a similarly
3.4. Panchromatic analysis of GDS24569 low metallicity trend may be seen in local compact galaxies.
Such a low metallicity implies that GDS24569 presumably
Morishita et al. (2019) investigated the star formation his-
experienced star formation of a short timescale in a relatively
tory of GDS24569 from a combined dataset of NIR spec-
trum and optical-to-NIR broadband photometry. We re-fit6
Figure 4. (Top): Tentative line detection at V ∼ 1200 km / s in Data2 is shown (left panel; red circle) in the velocity integrated map (centered
on its pointing). The position of GDS24569 is also shown (black cross). The beam size is shown at bottom-right (white ellipse). The Gaussian
fit to the tentative line is overlaid in the extracted spectrum (right panel; red dashed line). (Bottom): Same as above but for Data1. No significant
flux excess is seen at the velocity (red dashed line).
pristine gas environment (e.g., Kriek et al. 2016, see also be- log Mdust /M = 8.2+0.4−0.6 , in good agreement with the dust
low). mass estimate by gsf.
The best-fit result returns dust mass log Mdust /M = 7.8 ± No X-ray counterpart is found in the Chandra 7M sec cat-
0.8, which derives its dust-to-stellar mass ratio Mdust /M∗ ∼ alog (Luo et al. 2017) at the positions of GDS24569 or the
0.1%. While the data point of ALMA Band 5 is an up- tentative line in Sec 3.2.2. The non-detection is reasonable
per limit, strong flux excess at 24µm constrains the FIR given its passively evolving nature inferred from the SED and
component sufficiently well. The inferred fraction is much undisturbed morphology.
higher than those of local early-type galaxies, ranging from
Mdust /M∗ ∼ 10−6 to 10−5 (Smith et al. 2012; Lianou et al. 4. DISCUSSION AND SUMMARY
2016), while a similar value was found from the stacking In this study, we investigated the vicinity of a massive com-
analysis of massive galaxies at z ∼ 1.8 in Gobat et al. (2018). pact galaxy, GDS24569, for molecular gas that can induce
Such a significant amount of dust may play a critical role in star formation and lead to strong size evolution to the local
suppressing star-formation activity, by preventing formation size-mass relation. Our two independent algorithms on the
of hydrogen molecules (e.g., Kajisawa et al. 2015; Conroy unique data cubes did not confidently detect any gas clumps
et al. 2015). Our finding of the low gas mass fraction derived or continuum emission, placing a conservative upper limit on
above is consistent with this scenario. molecular hydrogen mass. The result leads to the conclu-
Our estimate of dust mass is robust to different assump- sion that GDS24569 is unlikely to be on the size relation of
tions in the SED modeling. We also fit our photomet- the early-type galaxies, at least via minor mergers, which is a
ric data points with another SED fitting code, piXedfit popularly discussed evolutionary path (Naab et al. 2009; Oser
(Abdurro’uf et al., in prep.), which adopts broader param- et al. 2010). According to the analysis presented in Morishita
eter ranges for the dust component. The code returns & Ichikawa (2016, their Fig.4), if all satellite galaxies found
in their deep images are to accrete, GDS24569 is able to in-7
Figure 5. (Top): Spectral energy distribution (SED) of GDS24569. Broadband photometry (red points for detection and arrows for upper
limits) from rest-frame UV to FIR (inset at right middle) and NIR grism spectra (inset at right top; red and blue lines for G141 and G102,
respectively) are included. Flux contribution from each lookback time is shown with different colors (filled regions), whereas the best-fit total
flux is shown with a dashed line (purple, with uncertainty in gray). (Bottom): Star formation (left), mass accumulation (middle), and metallicity
evolution (right) histories of GDS24569. Colors of symbols at each lookback time correspond to those of spectral templates in the SED plot
above. The star formation rate of the star-forming main sequence for a given stellar mass at each lookback time (Speagle et al. 2014) is shown
in the left panel (dashed line with blue hatch).
crease its size by a factor of ∼ 5 at most, which is still ∼ 2σ From these findings above, it is implied systematically ear-
below the local size-mass relation of early-type galaxies at lier evolution of compact galaxies in dense fields, which is
z ∼ 0 (e.g., Shen et al. 2003; Taylor et al. 2010; Poggianti suggested by Morishita et al. (2017) and Abramson & Mor-
et al. 2013). Since most of their satellite galaxies are not ishita (2018) from their structural analysis on cluster and field
spectroscopically confirmed, this extrapolation is rather opti- galaxies, as well as by direct comparison of stellar age of
mistic and the actual size evolution can be even less signifi- massive galaxies at z ∼ 2 (Wu et al. 2018; Estrada-Carpenter
cant. et al. 2020). In fact, the stellar metallicity of GDS24569 im-
In the local universe, on the other hand, there are a por- plied from our SED fitting analysis is ∼ 0.4 dex below the
tion of compact, passively evolving galaxies in high-density average trend of non-compact galaxies at the same redshift.
regions i.e. in galaxy clusters (e.g., Valentinuzzi et al. 2010). Assuming that GDS24569 is representative of the progenitor
These local compact galaxies, characterized by a similar light population of local compact galaxies, then we may see sys-
profile as for high-z compact galaxies, dominate a significant tematical differences in their metallicity and chemical com-
fraction of cluster member galaxies at > 3 × 10¹⁰ M , ∼ 22% position from those of other non-compact galaxies. While
(Valentinuzzi et al. 2010), whereas only ∼ 4.4% in general Taylor et al. (2010) found no significant metallicity offset of
fields (Poggianti et al. 2013). These findings imply insignif- compact galaxies in general fields, currently such systematic
icant size evolution of (at least) some of compact galaxies at comparison of local compact galaxies in dense environments
high redshift, as is found in simulations (e.g., Wellons et al. has not been established.
2016). Poggianti et al. (2013) also found that compact galax- Lastly, we revisit possible quenching mechanisms that
ies in dense environments consist of older stellar populations could occur in GDS24569. Our observations found an ex-
than those in general fields. tremely low gas mass fraction in the system, < ∼ 1%, whereas
the fraction ranges from ∼ 50% to ∼ 100% for the main se-8
quence star-forming galaxies at similar redshifts (Daddi et al. concluded that the star formation is likely caused by posi-
2010; Tacconi et al. 2018; Hayashi et al. 2018). Such a low tive feedback from the AGN activity. This positive feedback
gas mass fraction of passive galaxies is not a surprise. For scenario seems possible given a higher fraction of compact
example, Bezanson et al. (2019) reported a conservative up- star forming galaxies host AGN than the overall star-forming
per limit of <
∼ 7% in a galaxy at z = 1.522. Furthermore, the population (e.g., Kocevski et al. 2017; Wisnioski et al. 2018).
extremely low gas fraction of GDS24569 is worth comparing On the other hand, such high efficiency in star formation
with those of compact galaxies at an earlier phase, or blue can also be induced without AGN activity (Dekel & Burk-
nuggets (Barro et al. 2013; Williams et al. 2014; van Dokkum ert 2014; Semenov et al. 2018), leaving the conclusion still
et al. 2015). Barro et al. (2017) reported a short depletion pending.
time (∼ 27 Myr) of a star-forming compact galaxy at z = 2.3 Given that the scenarios above are derived from one
from their CO observations with ALMA. The galaxy is in- galaxy, we are still far from getting a general consensus on
tensively forming stars at ∼ 500M / yr, which is somewhat primary quenching mechanisms in compact massive galax-
comparable to the peak star formation rate of GDS24569 ies. Nonetheless, in this study we showed that even non-
(Fig. 5).1 From this perspective, gas depletion by the past detection of molecular gas and dust emission, in combination
intense star formation activity can reasonable be considered with a wide wavelength data coverage, sheds light on the na-
as the primary cause of quenching for GDS24569. ture of high-z passive galaxies. Application of this new ap-
We did not find gas clumps, disturbed gas structure, or proach to archival data will immediately improve statistical
dust emission in and around GDS24569. Given that the arguments.
last primary star forming activity occurred relatively recently
(∼ 0.5 Gyr), this suggests that the past star formation activity
was at least not caused by a galaxy-galaxy scale merger, and ACKNOWLEDGEMENTS
that gas was consumed inside the system rather than being T.M. is grateful to Kate Rowlands and Takuya Hashimoto
ejected. This is consistent with a scenario derived from the for helpful discussion and advice on ALMA data reduction.
local galaxies using stellar metallicity as an indicator (Peng Software: Astropy (Astropy Collaboration et al. 2013,
et al. 2015). It is yet unclear what caused such intense star 2018), numpy (Oliphant 2006; Van Der Walt et al.
formation from our study. For example, Talia et al. (2018) 2011), python-fsps (Foreman-Mackey et al. 2014), EMCEE
observed an AGN-hosting compact star forming galaxy, and (Foreman-Mackey et al. 2013).
REFERENCES
Abramson, L. E., & Morishita, T. 2018, ApJ, 858, 40 Calzetti, D., Armus, L., Bohlin, R. C., et al. 2000, ApJ, 533, 682
Astropy Collaboration, Robitaille, T. P., Tollerud, E. J., et al. 2013, Carollo, C. M., Bschorr, T. J., Renzini, A., et al. 2013, ApJ, 773,
A&A, 558, A33 112
Astropy Collaboration, Price-Whelan, A. M., SipHocz, B. M., Cassata, P., Giavalisco, M., Guo, Y., et al. 2011, ApJ, 743, 96
et al. 2018, aj, 156, 123 Cimatti, A., Daddi, E., Renzini, A., et al. 2004, Nature, 430, 184
Barro, G., Faber, S. M., Pérez-González, P. G., et al. 2013, ApJ, Conroy, C., Gunn, J. E., & White, M. 2009, ApJ, 699, 486
765, 104
Conroy, C., van Dokkum, P. G., & Kravtsov, A. 2015, ApJ, 803, 77
Barro, G., Kriek, M., Pérez-González, P. G., et al. 2017, ApJL,
Conselice, C. J. 2014, ARA&A, 52, 291
851, L40
Currie, M. J., Berry, D. S., Jenness, T., et al. 2014, in Astronomical
Belfiore, F., Maiolino, R., Tremonti, C., et al. 2017, MNRAS, 469,
Society of the Pacific Conference Series, Vol. 485, Astronomical
151
Data Analysis Software and Systems XXIII, ed. N. Manset &
Belli, S., Newman, A. B., & Ellis, R. S. 2019, ApJ, 874, 17
P. Forshay, 391
Bezanson, R., Spilker, J., Williams, C. C., et al. 2019, ApJL, 873,
L19 Daddi, E., Renzini, A., Pirzkal, N., et al. 2005, ApJ, 626, 680
Brammer, G. B., Whitaker, K. E., van Dokkum, P. G., et al. 2009, Daddi, E., Bournaud, F., Walter, F., et al. 2010, ApJ, 713, 686
ApJL, 706, L173 D’Amato, Q., Gilli, R., Prandoni, I., et al. 2020, A&A, 641, L6
Buitrago, F., Trujillo, I., Conselice, C. J., et al. 2008, ApJL, 687, Damjanov, I., McCarthy, P. J., Abraham, R. G., et al. 2009, ApJ,
L61 695, 101
Dekel, A., & Burkert, A. 2014, MNRAS, 438, 1870
1 Our SFR estimates are time-averaged at each pixel, and actual values Draine, B. T., & Li, A. 2007, ApJ, 657, 810
could be higher if star formation activity is more instantaneous. Dressler, A., & Gunn, J. E. 1983, ApJ, 270, 79
Table 1. Photometric fluxes of GDS24569, in units of µJy.
F125W F140W F160W F225W F275W F336W F435W F606W F775W F814W F850LP
KS IRAC CH1 IRAC CH2 IRAC CH3 IRAC CH4 MIPS 24µm MIPS 70µm PACS 100µm PACS 160µm ALMA Band 5
3.26 ± 0.02 4.49 ± 0.03 5.30 ± 0.03 < 0.14 < 0.05 < 0.03 < 0.01 0.11 ± 0.01 0.26 ± 0.01 0.35 ± 0.01 0.62 ± 0.02
7.99 ± 0.09 11.18 ± 0.07 11.98 ± 0.06 10.65 ± 0.42 6.09 ± 0.44 9.84 ± 2.72 < 8538.11 < 2203.38 < 6610.15 < 21.40
N OTE— 1σ errors are quoted for those with S/N > 1, and 1σ upper limits for the rest of the data points.
Elbaz, D., Dickinson, M., Hwang, H. S., et al. 2011, A&A, 533, Man, A. W. S., Lehnert, M. D., Vernet, J. D. R., De Breuck, C., &
A119 Falkendal, T. 2019, A&A, 624, A81
Ellison, S. L., Sánchez, S. F., Ibarra-Medel, H., et al. 2018, Marchesini, D., van Dokkum, P. G., Förster Schreiber, N. M., et al.
MNRAS, 474, 2039 2009, ApJ, 701, 1765
Estrada-Carpenter, V., Papovich, C., Momcheva, I., et al. 2020, Mármol-Queraltó, E., Trujillo, I., Pérez-González, P. G., Varela, J.,
ApJ, 898, 171 & Barro, G. 2012, MNRAS, 422, 2187
Fagioli, M., Carollo, C. M., Renzini, A., et al. 2016, ApJ, 831, 173 McDermid, R. M., Alatalo, K., Blitz, L., et al. 2015, MNRAS, 448,
Fan, L., Lapi, A., De Zotti, G., & Danese, L. 2008, ApJL, 689, 3484
L101 Morishita, T., & Ichikawa, T. 2016, ApJ, 816, 87
Foreman-Mackey, D., Hogg, D. W., Lang, D., & Goodman, J. Morishita, T., Ichikawa, T., & Kajisawa, M. 2014, ApJ, 785, 18
2013, PASP, 125, 306 Morishita, T., Ichikawa, T., Noguchi, M., et al. 2015, ApJ, 805, 34
Foreman-Mackey, D., Sick, J., & Johnson, B. 2014, Morishita, T., Abramson, L. E., Treu, T., et al. 2017, ApJ, 835, 254
doi:10.5281/zenodo.12157 —. 2019, ApJ, 877, 141
Frerking, M. A., Keene, J., Blake, G. A., & Phillips, T. G. 1989, Muzzin, A., Marchesini, D., Stefanon, M., et al. 2013, ApJ, 777, 18
ApJ, 344, 311 Naab, T., Johansson, P. H., & Ostriker, J. P. 2009, ApJL, 699, L178
Gallazzi, A., Charlot, S., Brinchmann, J., White, S. D. M., & Naab, T., Johansson, P. H., Ostriker, J. P., & Efstathiou, G. 2007,
Tremonti, C. A. 2005, MNRAS, 362, 41 ApJ, 658, 710
Gobat, R., Daddi, E., Magdis, G., et al. 2018, Nature Astronomy, 2, Newman, A. B., Ellis, R. S., Bundy, K., & Treu, T. 2012, ApJ, 746,
239 162
Hayashi, M., Tadaki, K.-i., Kodama, T., et al. 2018, ApJ, 856, 118 Nipoti, C., Treu, T., Auger, M. W., & Bolton, A. S. 2009, ApJL,
Hopkins, P. F., Hernquist, L., Cox, T. J., Keres, D., & Wuyts, S. 706, L86
2009, ApJ, 691, 1424 Nipoti, C., Treu, T., Leauthaud, A., et al. 2012, MNRAS, 422, 1714
Ichikawa, T., Kajisawa, M., Yamada, T., et al. 2010, ApJ, 709, 741 Oliphant, T. E. 2006, A guide to NumPy, Vol. 1 (Trelgol Publishing
Illingworth, G., Magee, D., Bouwens, R., et al. 2016, ArXiv USA)
e-prints, arXiv:1606.00841 Oser, L., Ostriker, J. P., Naab, T., Johansson, P. H., & Burkert, A.
Illingworth, G. D., Magee, D., Oesch, P. A., et al. 2013, ApJS, 209, 2010, ApJ, 725, 2312
6 Papadopoulos, P. P., Thi, W. F., & Viti, S. 2004, MNRAS, 351, 147
Jiao, Q., Zhao, Y., Lu, N., et al. 2019, ApJ, 880, 133 Papovich, C., Labbé, I., Quadri, R., et al. 2015, ApJ, 803, 26
Kajisawa, M., Morishita, T., Taniguchi, Y., et al. 2015, ApJ, 801, Patel, S. G., van Dokkum, P. G., Franx, M., et al. 2013, ApJ, 766,
134 15
Kauffmann, G., Heckman, T. M., White, S. D. M., et al. 2003, Peng, Y., Maiolino, R., & Cochrane, R. 2015, Nature, 521, 192
MNRAS, 341, 33 Poggianti, B. M., Calvi, R., Bindoni, D., et al. 2013, ApJ, 762, 77
Khochfar, S., & Silk, J. 2006, ApJL, 648, L21 Salpeter, E. E. 1955, ApJ, 121, 161
Kocevski, D. D., Barro, G., Faber, S. M., et al. 2017, ApJ, 846, 112 Semenov, V. A., Kravtsov, A. V., & Gnedin, N. Y. 2018, ApJ, 861,
Kriek, M., Conroy, C., van Dokkum, P. G., et al. 2016, Nature, 4
540, 248 Shen, S., Mo, H. J., White, S. D. M., et al. 2003, MNRAS, 343, 978
Lianou, S., Xilouris, E., Madden, S. C., & Barmby, P. 2016, Skelton, R. E., Whitaker, K. E., Momcheva, I. G., et al. 2014,
MNRAS, 461, 2856 ApJS, 214, 24
Luo, B., Brandt, W. N., Xue, Y. Q., et al. 2017, The Astrophysical Smith, M. W. L., Gomez, H. L., Eales, S. A., et al. 2012, ApJ, 748,
Journal Supplement Series, 228, 2 12310
Solomon, P. M., & Vanden Bout, P. A. 2005, ARA&A, 43, 677 van der Wel, A., Franx, M., van Dokkum, P. G., et al. 2014, ApJ,
Speagle, J. S., Steinhardt, C. L., Capak, P. L., & Silverman, J. D. 788, 28
2014, ApJS, 214, 15 van Dokkum, P. G., Abraham, R., Merritt, A., et al. 2015, ApJL,
Szomoru, D., Franx, M., van Dokkum, P. G., et al. 2010, ApJL, 798, L45
714, L244 van Dokkum, P. G., Franx, M., Kriek, M., et al. 2008, ApJL, 677,
Tacconi, L. J., Genzel, R., Saintonge, A., et al. 2018, ApJ, 853, 179 L5
Talia, M., Pozzi, F., Vallini, L., et al. 2018, MNRAS, 476, 3956 van Dokkum, P. G., Whitaker, K. E., Brammer, G., et al. 2010,
Taylor, E. N., Franx, M., Glazebrook, K., et al. 2010, ApJ, 720, 723 ApJ, 709, 1018
Thomas, D., Maraston, C., & Bender, R. 2003, MNRAS, 339, 897 Wagg, J., Wilner, D. J., Neri, R., Downes, D., & Wiklind, T. 2006,
Tomczak, A. R., Quadri, R. F., Tran, K.-V. H., et al. 2014, ApJ, ApJ, 651, 46
783, 85 Weiß, A., Downes, D., Henkel, C., & Walter, F. 2005, A&A, 429,
Treu, T., Ellis, R. S., Liao, T. X., & van Dokkum, P. G. 2005, L25
ApJL, 622, L5 Weiß, A., Henkel, C., Downes, D., & Walter, F. 2003, A&A, 409,
Trujillo, I., Conselice, C. J., Bundy, K., et al. 2007, MNRAS, 382, L41
109 Wellons, S., Torrey, P., Ma, C.-P., et al. 2016, MNRAS, 456, 1030
Trujillo, I., Ferreras, I., & de La Rosa, I. G. 2011, MNRAS, 415, Whitaker, K. E., Rigby, J. R., Brammer, G. B., et al. 2014, ApJ,
3903 790, 143
Trujillo, I., Förster Schreiber, N. M., Rudnick, G., et al. 2006, ApJ, Williams, C. C., Giavalisco, M., Cassata, P., et al. 2014, ApJ, 780, 1
650, 18 Williams, J. P., de Geus, E. J., & Blitz, L. 1994, ApJ, 428, 693
Valentinuzzi, T., Fritz, J., Poggianti, B. M., et al. 2010, ApJ, 712, Wisnioski, E., Mendel, J. T., Förster Schreiber, N. M., et al. 2018,
226 ApJ, 855, 97
Van Der Walt, S., Colbert, S. C., & Varoquaux, G. 2011,
Wu, P.-F., van der Wel, A., Bezanson, R., et al. 2018, ApJ, 868, 37
Computing in Science & Engineering, 13, 22You can also read