A market leader in retail logistics - Logistics evolved: Agility and Ability - 2018 Interim Results Presentation 6 December 2018
←
→
Page content transcription
If your browser does not render page correctly, please read the page content below

A market leader in retail logistics
   2018 Interim Results Presentation
   6 December 2018

Logistics evolved: Agility and Ability

Disclaimer

This presentation includes statements that are, or may be deemed to be, “forward-looking statements”. These forward-looking statements
can be identified by the use of forward-looking terminology, including the terms “believe”, “estimates”, “plans”, “projects”, “anticipates”,
“expects”, “intends”, “may”, “will”, or “should” or, in each case, their negative or other variations or comparable terminology. These
forward-looking statements include matters that are not historical facts and include statements regarding the Company’s intentions,
beliefs or current expectations.

Any forward-looking statements in this presentation reflect the Company’s current expectations and projections about future events. By
their nature, forward-looking statements involve a number of risks, uncertainties and assumptions that could cause actual results or
events to differ materially from those expressed or implied by the forward-looking statements. These risks, uncertainties and assumptions
could adversely affect the outcome and financial effects of the plans and events described herein. Forward-looking statements contained
in this presentation regarding past trends or activities should not be taken as a representation that such trends or activities will continue in
the future. You should not place undue reliance on forward-looking statements, which speak only as of the date of this presentation. No
representations or warranties are made as to the accuracy of such statements, estimates or projections.

Please note that the Directors of the Company are, in making this presentation, not seeking to encourage shareholders to either buy or
sell shares in the Company. Shareholders in any doubt about what action to take are recommended to seek financial advice from an
independent financial advisor authorised by the Financial Services and Markets Act 2000.

                                                                                                                                                   2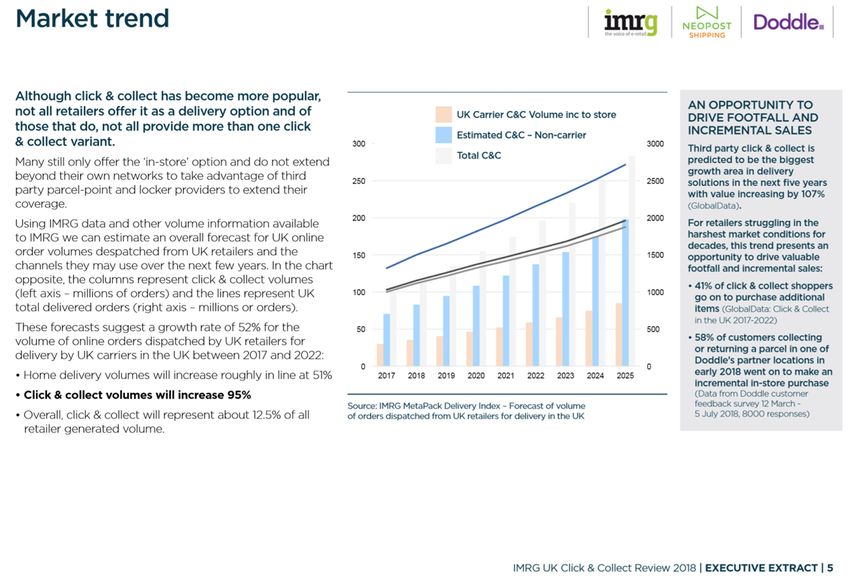
Agenda

 1   Highlights – Steve Parkin

 2   Financial review – David Hodkin

 3   Operational review – Tony Mannix

 4   Summary and Q&A – Steve Parkin

                                        3
1 Highlights
Highlights

  Group revenue growth of 14.1% to £227.9m (H1 FY18: £199.7m)

  Group EBIT growth of 16.1% to £10.7m (H1 FY18: £9.2m)

  Group EPS growth of 14.3% to 7.2p per share (H1 FY18: 6.3p)

  Interim dividend of 3.2p per share, up 14.3% (H1 FY18: 2.8p)

  Strong growth in e-fulfilment and returns management, with revenue up 40.7% (excluding Clicklink)

  Clicklink well positioned to enhance earnings due to new customer wins and rate enhancements

  Non e-fulfilment EBIT in H1 adversely impacted by activity levels, offset by property-related income.
  New contract wins provide positive earnings momentum into H2

  European operations growing strongly, driven by e-fulfilment and returns management

  Commercial vehicles EBIT reduced due to lack of manufacturer support on new vehicle sales

  Strong pipeline of new business opportunities in logistics

                                                                                                          5
2 Financial review
Financial Highlights
   Group revenue growth of 14.1% to £227.9m (H1 FY18: £199.7m), driven by strong growth in logistics

   Group EBIT growth of 16.1% to £10.7m (H1 FY18: £9.2m):

    o E-fulfilment and returns management services – EBIT of £6.2m, up 17.1% (H1 FY18: £5.3m)

    o Non e-fulfilment logistics – EBIT of £7.3m, up 16.4% (H1 FY18: £6.3m) including property related
      advisory service fees of £2.8m (H1 FY18: £nil)

    o Commercial vehicles – EBIT of £0.9m, down 36.9% (H1 FY18: £1.4m)

   Profit before tax and amortisation up 17.3% to £9.9m (H1 FY18: £8.4m)

   EPS of 7.2p, up 14.3% (H1 FY18: 6.3p)

   Interim dividend of 3.2p per share, up 14.3% (H1 FY18: 2.8p)

Note: The highlights are for the 6 months ended 31 October 2018, as compared to the 6 months ended 31 October 2017 (“H1 FY18”)   7
Summary Income Statement

£m                                                             6m to 31 October     Change    Year to 30
                                                                  2018      2017      %       April 2018

                                                                                                           •   Strong top-line performance in the period
Revenue                                                          227.9     199.7      14.1%       400.1
                                                                                                               driven by e-fulfilment & non e-fulfilment
Cost of sales                                                   (164.9)   (142.1)                (283.3)       business units

Gross profit                                                      63.0       57.6      9.3%       116.8    •   Key EBIT metric saw continuing growth of
Other net gains                                                    0.1        0.1                    2.4       16.1%, again driven by logistics, including
                                                                                                               property-related advisory fees
Admin expenses                                                   (52.3)    (48.3)                 (98.4)
Operating profit before share of equity-accounted                                                          •   Finance costs up slightly, due to prior year
                                                                  10.8        9.4     14.6%         20.8       acquisitions
investees, net of tax
Share of equity-accounted investees, net of tax                   (0.6)     (0.6)                  (0.9)
                                                                                                           •   Profit before tax and amortisation up 17.3%
Operating profit                                                  10.3        8.8     15.9%         19.9       to £9.9m (H1 FY18: 8.4m)
EBIT                                                              10.7        9.2   16.1%           20.9
                                                                                                           •   Profit before tax ahead by 16.9% to £9.3m
Less: amortisation of other intangible assets                     (0.6)     (0.5)                  (1.1)       (H1 FY18: £7.9m)

Share of tax and finance costs of equity-accounted investees       0.2        0.1                    0.1   •   EPS ahead by 14.3% to 7.2p (H1 FY18:
Operating profit                                                  10.3        8.8                   19.9       6.3p)

Net finance costs                                                 (1.0)     (0.9)                  (1.9)   •   Interim dividend up 14.3% to 3.2p (H1
                                                                                                               FY18: 2.8p)
Profit before income tax                                           9.3        7.9   16.9%           18.0

Income tax                                                        (1.9)     (1.7)                  (3.7)

Profit for the financial period                                    7.3        6.3                   14.3

Basic earnings per share (p)                                       7.2        6.3   14.3%           14.2

Interim dividend per share (p)                                     3.2        2.8   14.3%              -

                                                                                                                                                              8
Segmental performance
Revenue
• Strong organic growth in e-fulfilment driven by:
£m 6m to 31 October Change
o Continued migration online and consequent growth in activity
2018 2017 %
levels on established customers – e.g. ASOS, Wilko, Browns
E-fulfilment & returns management services 107.1 76.1 40.7% o Benefit of prior year contract wins - e.g. M&S returns, River
Non e-fulfilment logistics 76.1 65.7 15.8% Island, ASOS Poland
Total value-added logistics services 183.2 141.8 29.2% o New contract wins in FY19 – e.g. Pretty Little Thing, Ginger Ray
Commercial vehicles 45.4 58.8 -22.8% • Clicklink: loss of £0.7m (H1 FY18: £0.7m loss):
Inter-segment sales (0.7) (0.9) o Profitability expected to improve substantially in H2 due to:
Group Revenue 227.9 199.7 14.1% • Seasonality: 40% of annual volume in Nov-Jan
• Rate enhancements
• New customer onboarding
EBIT
• Non e-fulfilment EBIT adversely impacted by activity levels as a key
£m 6m to 31 October Change customer re-shapes their network, and a reduction in tobacco activity,
offset by property-related advisory fees of £2.8m (H1 FY18: nil):
2018 2017 %
o Contract wins and increased tobacco activity will provide
E-fulfilment & returns management services 6.2 5.3 17.1% earnings growth into H2 and beyond
Non e-fulfilment logistics 7.3 6.3 16.4%
• Commercial vehicles EBIT down due to lack of manufacturer support:
Central logistics overheads (2.5) (2.5)
o Cost base addressed
Total value-added logistics services 11.0 9.1 21.2%
Commercial vehicles 0.9 1.4 -36.9%
• Continued investment in solutions development and IT infrastructure
Head office costs (1.2) (1.3) • Share based payment credit £0.7m (H1 FY18: charge £0.6m)
Group EBIT 10.7 9.2 16.1%
9Summary cash flow statement
£m 6m to 31 October Year to 30
2018 2017 April 2018
EBIT 10.7 9.2 20.9 • EBITDA ahead 14.5%
Depreciation & Amortisation 3.8 3.4 6.9
Other non-cash items1 0.3 1.2 (0.1) • Working capital outflow due to higher than
normal accrued revenue
Change in working capital (4.4) (1.2) (3.2)
Cash generated from operations 10.1 12.6 24.5 • Strong underlying cash flow and cash
Net interest paid (1.0) (0.9) (1.9) conversion
Tax paid (1.9) (2.0) (4.0)
Net cash flows from operating activities 7.2 9.7 18.6 • Majority of capex is back-to-back with
agreements by customers to repay the capital
through open-book contract mechanisms
Net capital expenditure (7.4) (3.6) (1.0)
Acquisition of subsidiaries (0.5) (11.8) (11.8)
Net cash flows from investing activities (7.9) (15.4) (12.8)
Loan advance to joint venture - - (0.5)
Net drawdown of bank loans 8.5 14.1 8.1
Finance leases advanced 0.3 - -
Repayment of capital on finance leases (3.4) (3.7) (7.3)
Shares issued 0.1 0.2 1.6
Dividends paid (5.7) (4.8) (7.6)
Net cash flows from financing activities (0.2) 5.8 (5.7)
Net increase / (decrease) in cash & cash equivalents
(0.9) 0.1 0.1
1. Other non cash items comprise share of equity-accounted investees, share based payments
and exchange differences
2. EBITDA calculated as EBIT plus depreciation and amortisation
10Summary balance sheet
£m 6m to 31 October Year to 30
2018 2017 April 2018
• Investment in fixed assets largely to support new
Intangible assets 37.7 36.8 37.2
open-book contracts under which capital will be repaid
Property, plant & equipment 51.2 46.7 45.0 over the term of the contract
Interest in equity-accounted investees 0.7 1.6 1.3
Non-current financial assets 1.9 1.4 1.9 • Net debt £42.1m, slightly lower than the Board’s
Non-current assets 91.5 86.5 85.4 expectations
Inventories 24.7 30.9 22.1
Trade & other receivables 94.7 70.8 73.4
Cash & cash equivalents 2.1 0.9 2.3
Current assets 121.5 102.6 97.8
Trade & other payables 120.7 110.6 102.4
Borrowings 10.6 7.8 9.2
Short term provisions 0.1 0.3 0.1
Current tax liabilities 2.9 1.9 2.5
Current liabilities 134.3 120.6 114.2
Borrowings 35.5 33.3 26.7
Long term provisions 1.6 1.4 1.5
Deferred tax liabilities 0.9 1.3 1.5
Non-current liabilities 38.0 36.0 29.7
Net assets 40.7 32.5 39.3
113 Operational review
Customer strategy
Review of strategy, progress to date and future plans
Clipper’s key strategies for customer retention & growth

   Become the omni-channel fulfilment provider to customers where we only
   currently manage the e-commerce channel

   Continue to target pureplay e-tailers for both fulfilment and returns operations

   Increase our revenues from the major UK retailers in our existing customer
   base through cross-selling services

                                                                                      14
E-commerce is still on the rise
2013/14 European e-commerce valued at no more than EUR 307 billion
2017 European e-commerce turnover increased by 11% in the year - valued at EUR 534 billion
2018 Expected European e-commerce growth rate of 13% - valued at EUR 602 billion
The United Kingdom (€178 billion), France (€93.2 billion) and Germany (€93 billion) are the three biggest e-commerce
markets in Europe
Together, they account for over two-thirds of the total European e-commerce turnover
38% of all online shoppers in Europe ordered abroad in 2017, with half of them ordering goods or services over the
internet from sellers from other EU countries
Online retail sales continue to soar E-commerce in UK grew to €15.6 billion in 2017
Mintel research suggests that 45% of online customers returned The business-to-consumer e-commerce turnover in the United
at least one item last year, representing a significant cost to Kingdom has increased to 13.7 billion pounds (15.6 billion
retailers. euros), last year. This is a 13.65% increase and for next year, a
growth rate of 14.3% is predicted, which means e-commerce in
the UK could be worth 17.8 billion euros.
Financial Times, January 2018 Ecommerce, May 2018
Source: Ecommerce, July 2018 15Progress in 2018
Pureplays
o Launched in July 2018
o 615k sq. ft. warehouse in Sheffield
o Peak shipping 200k+ items per day
o Fastest growing retailer in UK
o Moved from Worsley to Selby
o Launching new crafts and anticipated growth in 2019
is +30%
Key Customer Growth
o Clicklink went live in 2018 for all store deliveries
o Expanded to include Zara Home o Clipper also supported ‘pop up’ stores launch
o Now occupy 300% more space since
go-live
o Significant growth in account in 2018 o Clicklink went live in 2018 for all
o New same day moped delivery Superdry store deliveries
service launched o Robotics launched
o Planning move to dedicated site to o Partnership recognised at Supply
support growth in 2019 Chain Excellence awards
16Enhancing and Developing new Services Review of strategy, progress to date and future plans
Enhancing and Developing new services

 1. Further develop the Click and Collect network
                                                    4. Grow our consolidation capability using our transport
 to support more complex stocking and
                                                    network and click and collect technologies
 replenishment strategies

 2. Explore options for software propositions to    5. Develop a solution for tobacco fulfilment for the UK
 support customer returns strategy                  major multiples

                                                    6. Target growing relationships with OEMs to provide a
 3. Develop a Clicklink branded customer parcel
                                                    wrap-around after-sales Returns, Repair & Service
 shop app and in store proposition
                                                    proposition

                                                                                                               18
Evolving Supply Chain Needs
19The paid click-and-collect model will increasingly C&C tracks the effectiveness of a marketing budget –
count against a retailer, especially as online-only and improves loyalty
services look to make delivery costs free, or keep
them low, to compete in kind.
Putting a human face on an
You get another opportunity to sell otherwise faceless experience
2018 State of Omnichannel Retail report,
customers picking up a C&C order in store could Those that see paid-for click and collect as
spend an average of 12% more – while returns dispensation for logistical outlays are the ones
recoup added a further 18%, as you’re keeping an that will suffer in the next round of retail closures.
engaged customer in a purchase loop.
Opportunity knocks: Free C&C removes
another barrier to purchase certainty
20
Source: Shift Nov 2018Boomerang
Evolving Supply Chain Needs

Online retailers face “ returns tsunami” as try-before-you-buy trends Intensifies

   Returns are costing UK retailers £60 billion a year

   76% of consumers would “definitely” or “maybe” purchase more items if offered a try-before-you-buy
   option – with shoppers ordering on average three extra items each month, only to return them without
   ever paying a penny

   40% of retailers have seen a marked increase in “intentional returns” over the past 12 months when
   customers deliberately over-order multiple items knowing returns are free or cheap

   69% of retailers are not deploying any technology solutions to process returns, despite shoppers
   increasingly wanting their returns to be processed faster. For many retailers, the new trend will result
   in customers returning on average three items a month, potentially tripling the cost of returns if they
   continue to take no action

   Source: Retail Gazette, March 2018

                                                                                                              22
“Enhanced” Integrated Clicklink & Boomerang in 2019
Boomerang triage carried out in store Store based systems to link with returns centre to
Item can either be fast tracked through returns centre allow for rapid reuse of “grade A” inventory
for re-sale OR
Fulfilled from store to customer
Reduced handling costs
Improved stock availability
23Use data insight on customer behaviour to drive new revenue streams
Clipper is working in partnership with Leeds University and one of our major customers to use fulfilment and returns
to develop predictive analytics. This can help retailers’ decision making for ranging, merchandising, promotions and
pricing strategies
Analy o Analyse customer behaviour and trends
Fulfilment Data se
o Within season, week, day, hour time parameters
Plan
Predict o Replaces traditional cumbersome forecasting &
& replenishment tools
Propose
Returns Data
o More responsive, based on actual customer
behaviour and feedback
24Technical Services
Technical services – Progress in 2018

  Hi-sense: Combined power of RepairTech and Servicecare now delivering
  multi-channel TV repair solutions

  Vestel: Clipper Technical Services nominated as ‘brown goods repair partner’

  Argos: Renewed contract for 2 years

  Amazon: Extended contract and new territory (Germany)

  Richer Sounds: 5 year contract extension

                                                                                 26
Geography
Growth in Europe

  Second warehouse opened in Poznan, Poland to support Westwing Retail:
   o 350k sq ft new build facility
   o 4 level pick tower

  Expanded geography with Amazon to operate a Returns and Repair centre from within a Clipper Germany
  facility

  Strengthened relationship with s.Oliver with potential for further future growth

  Exploring potential European acquisitions

                                                                                                        28
Ensuring continuity of labour
Influencing Factors Key strategies
1. Net migration continues to fall. Shift in labour strategy from a high temp to perm ratio to a
• Significant decrease in Polish more stable perm headcount with seasonal flex – pooling
population in the UK. across site locations
• Uncertainty of employment and
right to remain post-Brexit
Solid Framework Agreements in place with key agencies
2. Decreasing number of labour providers in and a robust PSL
the UK post-Brexit
3. Confidence around competitive Full compensation and benefits review of all job levels -
Compensation and Benefits strategy top to January – March 2019
bottom
30Clipper Fresh Start
FRESH START launched in May 2018
8 Key Partners including: Mencap, Scope, Remploy, Reed in Partnership, Tempus Novo
150+ people recruited directly since launch – with a target to get to 300 by end of FY
Small start project with the potential for growth
Significant profile for Clipper Logistics
Key Labour Agencies engaged
Significant CSR project for the Group
Finalists in the 2018 in-house recruitment awards (Nov 2018)
31Technology
Developing technology capability
We will work with retailers to assess ‘fit for purpose’ automation solutions
We will explore AI solutions for retail supply chain applications
Progress in 2018
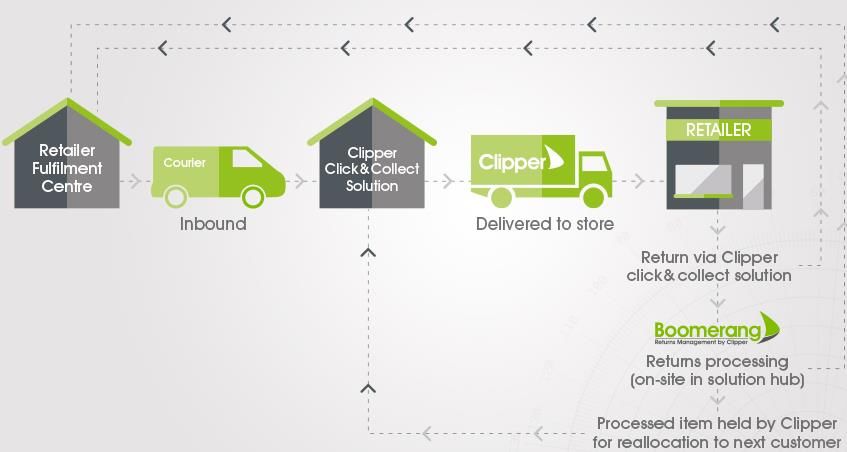
Autoboxer and conveyors installed in Ollerton to support Wilko e-commerce growth
Robotic returns launched at the Superdry facility
Experienced Automation Engineer recruited.
33Black Friday 2018
More UK retailers than ever before participated in Black Friday Sales this year in the face of ongoing
tough trading.
Ecommerce sales were up 46% compared with last year on Black Friday itself, while footfall dropped 5.4% on
2017, Springboard reports.
Participation rates from retailers reached record levels and the discounts were deeper than previous years,
research from sales aggregator LovetheSales.com found. A total of 72% more UK retailers took part in Black
Friday this year than in 2017 and price cuts were deeper – an average discount of 37%, compared with 33% in
2017 and 30% in 2016.
Source: Springboard & LovetheSales.com– Drapers 27th Nov 18
344 Summary and Q&A
You can also read