A Nanocomposite of Graphitic Carbon Nitride and Carbon Dots as a Platform for Sensitive Voltammetric Determination of 2- chlorophenol in Water
←
→
Page content transcription
If your browser does not render page correctly, please read the page content below
Int. J. Electrochem. Sci., 16 (2021) Article ID: 210560, doi: 10.20964/2021.05.15

                                                                        International Journal of
                                                                        ELECTROCHEMICAL
                                                                                SCIENCE
                                                                               www.electrochemsci.org

A Nanocomposite of Graphitic Carbon Nitride and Carbon Dots
as a Platform for Sensitive Voltammetric Determination of 2-
chlorophenol in Water
Theo H.G. Moundzounga1, Moses G. Peleyeju1*, Saheed O. Sanni, Michael J. Klink1,2,
Ekemena Oseghe3, Elvera Viljoen1, Augustine E. Ofomaja
1
  Department of Chemistry, Vaal University of Technology, Andries Potgieter Boulevard,
Vanderbijlpark, 1911, South Africa
2
  Biotechnology, Vaal University of Technology, Andries Potgieter Boulevard, Vanderbijlpark, 1911,
South Africa
3
  School of Science, Engineering and Technology, Nanotechnology and Water Sustainability
(NanoWS) Reserach Unit, University of South Africa, Johannesburg, South Africa.
*
 E-mail: mgpeleyeju@gmail.com, mosesp@vut.ac.za

Received: 20 December 2020 / Accepted: 8 February 2021 / Published: 31 March 2021

Herein, we report the preparation, characterisation and application of graphitic carbon nitride/carbon
nanodots nanocomposite (g-C3N4/CDs) as a platform for the sensing of 2-chlorophenol in water. The g-
C3N4/CDs was prepared via microwave irradiation and characterised by transmission electron
microscopy (TEM), Fourier transform infrared spectroscopy (FTIR) and X-ray diffraction (XRD). The
electrochemical properties of modified glassy carbon electrodes were studied using cyclic voltammetry
(CV). In comparison to unmodified GCE, there was a marked enhancement of the oxidation peak of the
analyte when GCE modified with the nanocomposite material was used. The composite modifier also
performed better than the single-component modifiers. The oxidation peak currents varied linearly with
the concentrations in the range 0.5 to 2.5 μM with a detection limit of 0.67 μM. The sensor was used to
determine the analyte in real water samples with good recoveries.

Keywords: Graphitic carbon nitride, Carbon nanodots, 2-Chlorophenol, Electrode modifiers,
Electroanalysis.

1. INTRODUCTION

        The presence of organic pollutants such as phenols and substituted phenols in water can pose
health risks to humans and animal populations [1; 2]. Chlorophenols (CPs), for instance, are widely used
in industries to manufacture chemical substances for the control of weeds, pests, insects and so on. They
are also produced during the disinfection of municipal water using chlorination method [3]. CPs often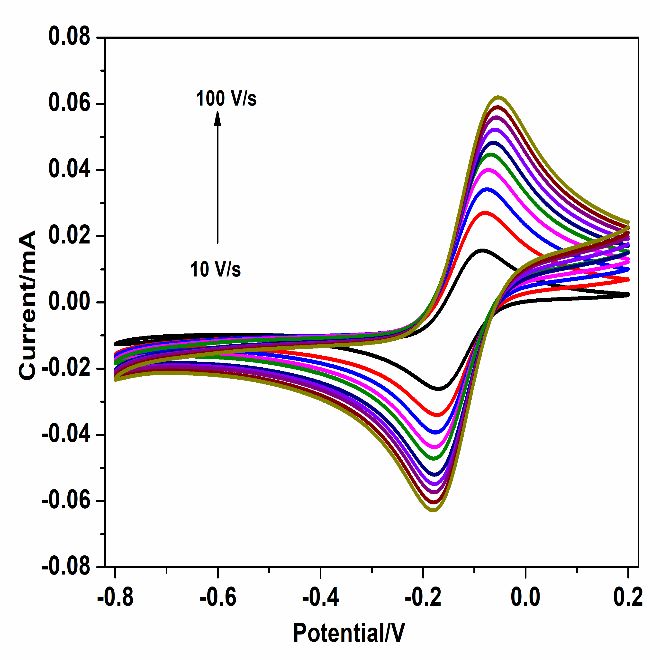
Int. J. Electrochem. Sci., 16 (2021) Article ID: 210560                                                  2

find their way into the aquatic environments via various routes. Consequently, CPs such as 2-
chlorophenol, 2,4-dichlorophenol and 2,4,6-trichlorophenol have been detected in tap water and
environmental waters [4; 5]. Owing to their potential to induce debilitating biological effects, CPs are
classified as priority organic pollutants and maximum permissible amounts in drinking water have been
set by many countries and organisations including the United States Environmental Protection Agency
(EPA) and the European Union [6]. It is thus necessary to monitor their presence in environmental
waters. Due to the low contamination level and severe toxicity of 2-chlorophenol, the development of
sensitive, simple and reliable analytical method is required. Various methods such as high performance
liquid chromatography (HPLC), gas chromatography, gas chromatography-microwave-induced plasma
atomic emission spectroscopy (GC-MIP-AES) and gas chromatography-tandem mass spectroscopy are
commonly used to monitor organic pollutants including chlorophenols. [7-9]. These methods can be
very sensitive and accurate. However, they do have some drawbacks which include high cost and
complexity of analytical equipment, non-portability of the equipment and tedious sample preparation
process amongst others [10]. As a result, it is necessary to develop alternative methods in which these
drawbacks are circumvented. In this regard, electrochemical devices offer simple, inexpensive and rapid
means for the determination of electrochemically active organic pollutants in aqueous media. It is worth
mention that electrochemical sensors are also well suited for onsite analysis because of their small sizes.
In fabricating an electrochemical sensor, the sensing platform (i.e. the electrode surface) can be designed
to maximise communication between the analyte and the sensor. In this way, high sensitivity and
considerable selectivity can be achieved [11]. The modification of the surface of commercial electrode
such as the glassy carbon electrode (GCE) to obtain enhanced signal when used to analyse organic
pollutants has been the subject many scientific reports. Materials possessing nanometric dimensions
have been used as modifiers to achieve this goal. The choice of nanomaterials is often informed by their
beneficial properties including electrical conductivity, high surface area, catalytic activity, and so on.
Some of the materials also have functionalities that promote interaction between the target pollutant and
the modified electrode. Carbon nanomaterials, metal and metal oxide nanoparticles [12], nanofibres, etc.
have been explored as electrode modifiers to detect and quantify various analytes in water.
        Recently, graphitic carbon nitride (g-C3N4), a polymeric material comprising mainly carbon and
nitrogen atoms, has been receiving attention as a promising material for electrochemical applications. It
has been indicated to have sites that may mediate redox processes [13; 14]. Liu et al. reported the non-
enzymatic determination of glucose using a composite electrode modifier containing g-C3N4 [15]. The
authors suggested that the presence of g-C3N4 promotes the accumulation of the glucose molecules on
the surface of the electrode. This accumulation can lead to improved electrochemical signal. Tia et al.
also prepared a bi-component electrode modifier with g-C3N4 and reported that the sensing platform
exhibited considerable catalytic activity for H2O2 [16]. The stability of g-C3N4 in aggressive media and
high adsorption capacity are beneficial for electroanalysis. The abundant pi bonds in the polymeric
material may also offer benefits in the determination of aromatic compounds such as phenols. Its low
conductivity, however, is a disadvantage [17]. Thus, most electrochemical investigations in which g-
C3N4 is used as electrode material/modifier incorporated other materials which can enhance conductivity
[18; 19].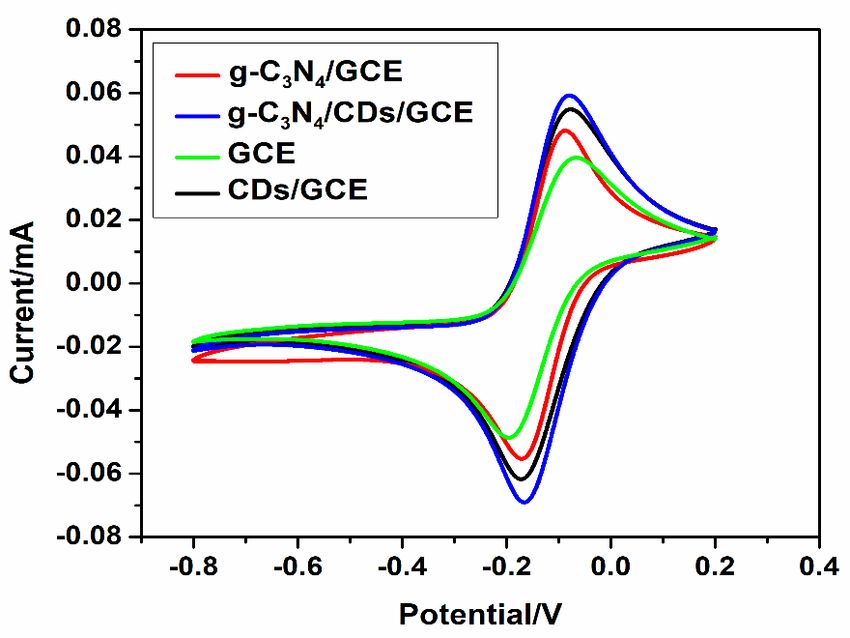
Int. J. Electrochem. Sci., 16 (2021) Article ID: 210560 3
In this study, a composite of g-C3N4 and carbon dots was prepared and used as an electrode
modifier. Carbon dots are a stable and electrically conductive carbon materials whose sizes are below
10 nm. They have been indicated as having excellent electrocatalytic properties and thus have been
employed in a variety of electrochemical studies [20; 21]. It is thought that a sensing platform consisting
of g-C3N4 and carbon dots (CDs) would be markedly sensitive to phenolic compounds in aqueous
solutions, and produce reproducible current signals which could be correlated to the amounts of the
analytes in solution. Studies on the use of g-C3N4 as electrode modifier for monitoring organic pollutants
in water are still sparse and this is the first report to investigate the voltammetric determination of 2-
chlorophenol using a nanocomposite of g-C3N4 and carbon nanodots.
2. EXPERIMENTAL
2.1 Reagents and materials
Thiourea, 2-chlorophenol, dimethylformamide (DMF), potassium chloride (KCl), sodium
chloride (NaCl), sodium hydrogen phosphate (Na2HPO4), potassium dihydrogen phosphate (KH2PO4),
bisphenol, 4-nitrophenol, phenol, 4-chloro-3-methyl-phenol were purchased from Sigma Aldrich (South
Africa). The pine cones (from which carbon dots were obtained) were collected from pine trees in
Vanderbijlpark (26°42’37.91”S 27°51’39.35”E), South Africa.
2.2. Characterisations
The electron images of the pristine and composite materials were obtained on transmission
electron microscope (JEOL JEM-2100) at 200 kV. The X-ray diffraction patterns were recorded using
the Shimadzu-XRD 700 diffractometer with Cu Kα radiation ( = 1.154056 Å), at a scan rate of 1° per
min and a current and a voltage of 30 mA and 40 kV respectively. Electrochemical experiments were
conducted on a Bio-Logic SP-240 potentiostat electrochemical workstation. Unmodified and modified
glassy carbon electrodes were used as the working electrodes, while a platinum wire and Ag/AgCl (3.0
M KCl) were used as the counter electrode and the reference electrode respectively. FTIR spectra were
recorded on Perkin Elmer 400 spectrophotometer in the range of 600 - 4000 cm-1.
2.3. Synthesis of g-C3N4
Approximately 10 g of thiourea was weighed and transferred into an alumina crucible, 5 mL of
distilled water was added, and the mixture was heated in a microwave oven at 600 W for 15 min. The
resulting material was calcined in air in a tube furnace at a heating rate of 5 °C/min. The furnace was
maintained at 550 °C for 1 h. The yellow powder obtained after calcination was kept for use.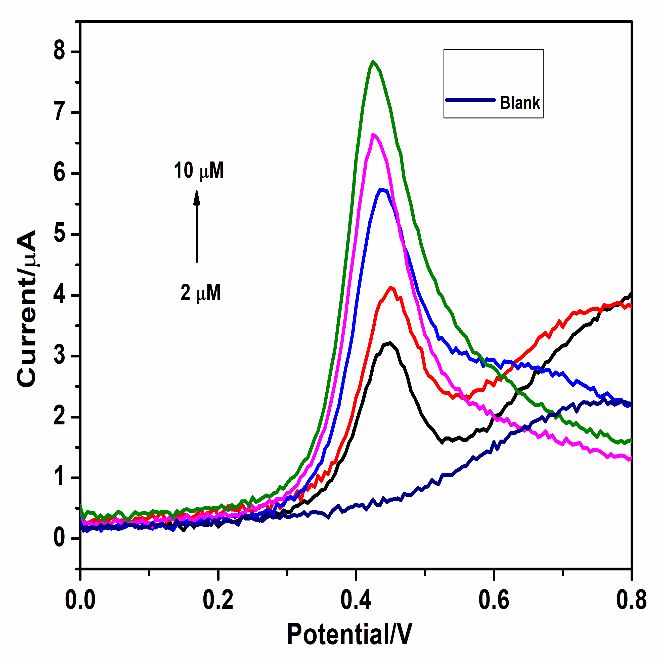
Int. J. Electrochem. Sci., 16 (2021) Article ID: 210560 4
2.4. Synthesis of Carbon dots
CDs was prepared by a facile one-pot hydrothermal method using pine cone as the carbon source.
Exactly 10 g of pine cone weighed into 50 mL ultrapure water and the dispersion was placed in a 100
mL Teflon-lined stainless steel autoclave. The autoclave was subsequently maintained at a temperature
of 180 °C for 24 h in an air oven. The dispersion was filtered and the residue obtained was dried for 48
h.
2.5. Synthesis of g-C3N4/CDs
About 10 g of thiourea was weighed and mixed with 5 mL of carbon dots dispersion in an alumina
crucible. The crucible was then transferred into a microwave oven and heated at 600 W for 15 min. The
resulting solid material was calcined in a tube furnace under atmospheric condition at a heating rate of
5 °C/min to 550 °C for 1 h.
2.6. Preparation of the working electrode
Prior to modification, the bare GCE was polished with alumina slurries (0.05 and 1 microns),
followed by sonication with anhydrous alcohol and distilled water for 1 min. For electrochemical studies,
15 μL of the g-C3N4/CDs dispersion (dispersed in dimethylformamide) was placed on the surface of
GCE and left to dry. This new modified GCE was denoted as g-C3N4/CDs electrode. The dispersions of
g-C3N4 and CDs were used to modify GCE electrodes following the same procedure.
2.7. Electrochemical detection of 2-chlorophenol
Different concentrations of the analytes were prepared in 0.1M phosphate buffer solution (pH
=7.6), and 10.0 mL of the analyte solution was transferred into an electrochemical cell and the electrodes
were dipped in the cell to record all electrochemical signals using differential pulse voltammetry (DPV).
3. RESULTS AND DISCUSSION
3.1 Characterisations of the CDs, g-C3N4, and g-C3N4/CDs
3.1.1 Morphology
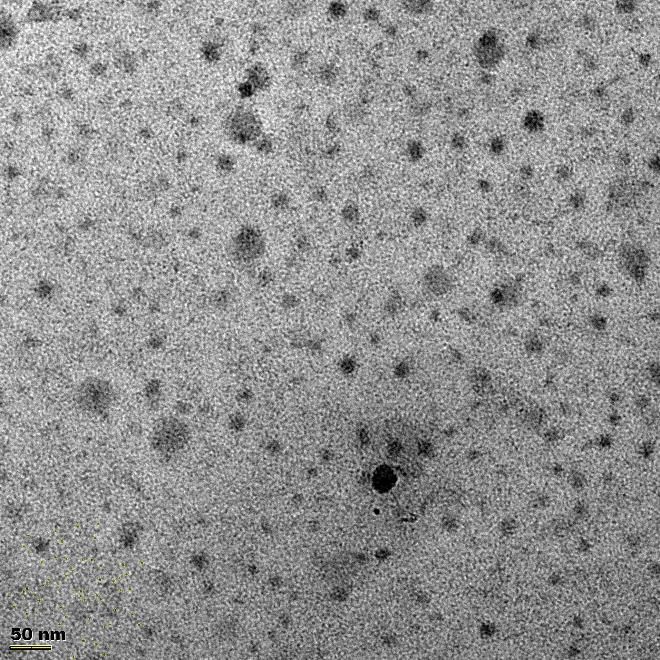
The morphologies of CDs, g-C3N4 and g-C3N4/CDs were investigated by TEM. The electron
images of CDs (Figure 1(a)) show well-dispersed particles, while the image of g-C3N4/CDs (Figure 1(b))
reveal sheets with many voids and pores, but CDs cannot be distinguishably observed on the g-C3N4
nanosheet.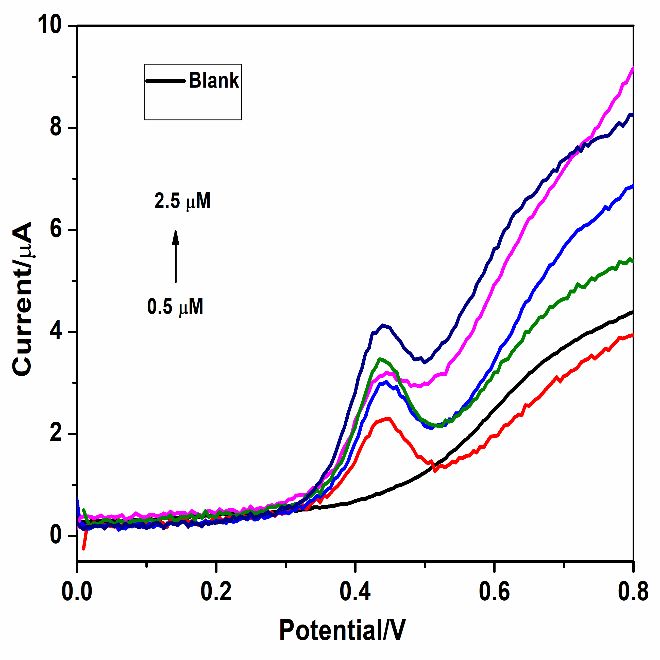
Int. J. Electrochem. Sci., 16 (2021) Article ID: 210560                                               5

   (a)                                              (b)

                          Figure 1. TEM image of (a) CDs, (b) g-C3N4/CDs

3.1.2 XRD

                      Figure 2. XRD patterns of CDs, g-C3N4 and g-C3N4/CDs

       Figure 2 shows the XRD patterns of CDs, g-C3N4 and g-C3N4/CDs. In the pattern for CDs, a
broad peak at around 2θ = 20.96° which corresponds to (002) lattice spacing of carbon can be observed.
The broadness of the peak indicates that the carbon material is amorphous. The g-C3N4 sample exhibits
one pronounced peak at 27.75° which corresponds to the diffraction signal of graphitic carbon materials,
and results from the interlayer stacking of aromatic segments, (JCPDS card no.066-0813) [22]. From the
XRD pattern of g-C3N4/CDs nanocomposite, the characteristic peak of g-C3N4 is observed and left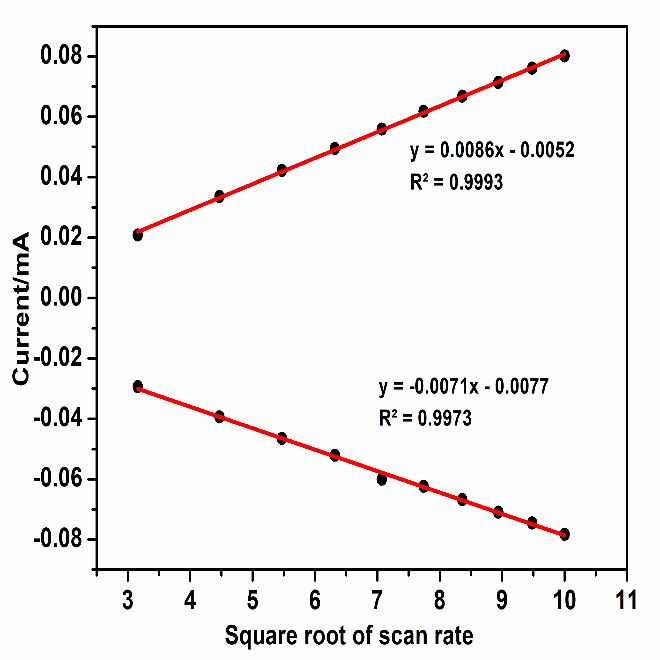
Int. J. Electrochem. Sci., 16 (2021) Article ID: 210560                                                  6

shifted to 27.61° with less intensity, while the characteristic band of CDs is much less prominent. This
may be because of its relatively small quantity in the nanocomposite.

3.1.3 Electrochemical characterisations

        As displayed in Figure 3, a well-defined pair of redox peaks on g-C3N4/CDs/GCE could be
observed with higher peak currents in comparison with other electrodes (g-C3N4/GCE and CDs/GCE).
The higher peak current recorded on the g-C3N4/GCE indicates that the composite material provided
more redox sites for the probe and the electron transfer was enhanced. This suggests a good synergy
between CDs and g-C3N4. The electro-active surface areas of the electrodes were calculated using the
Randles-Sevcik equation:
        iP = 2.69 × 10⁵ n3/2 v1/2 D1/2AC
        Where n is the number of electrons, v (mV/s) is the scan rate, A (cm2) the area of the electrode,
C is the concentration in mol/L and D (cm2/s) is the diffusion coefficient of [Fe(CN)6]3-/4- in KCl at room
temperature which has been reported to be 6.3 × 10⁻⁶ cm2/s, and iP (A) is the peak current. The g-
C3N4/CDs/GCE exhibits the largest active surface area of 0.082 cm2 compared to 0.072 cm2 and 0.052
cm2 for g-C3N4/GCE and bare GCE respectively. High electroactive surface area is expected to offer
benefits for electroanalysis of compounds.

Figure 3. CVs of GCE, g-C3N4/GCE and g-C3N4/CDs/GCE in 5mM [Fe(CN)6]3-/4- (prepared in 0.1 M
       KCl) at scan rate of 50 mV/s.

       The kinetics of the redox probe on the surface of g-C3N4/CDs/GCE was studied. As shown in
Figure 4(a), both anodic and cathodic peak currents were found to be proportional to the scan rate in the
range 10 to 100 mV/s, suggesting a diffusion-controlled process. This implies that the quantitative
analyses of the compound can be successfully achieved using the electrode [20].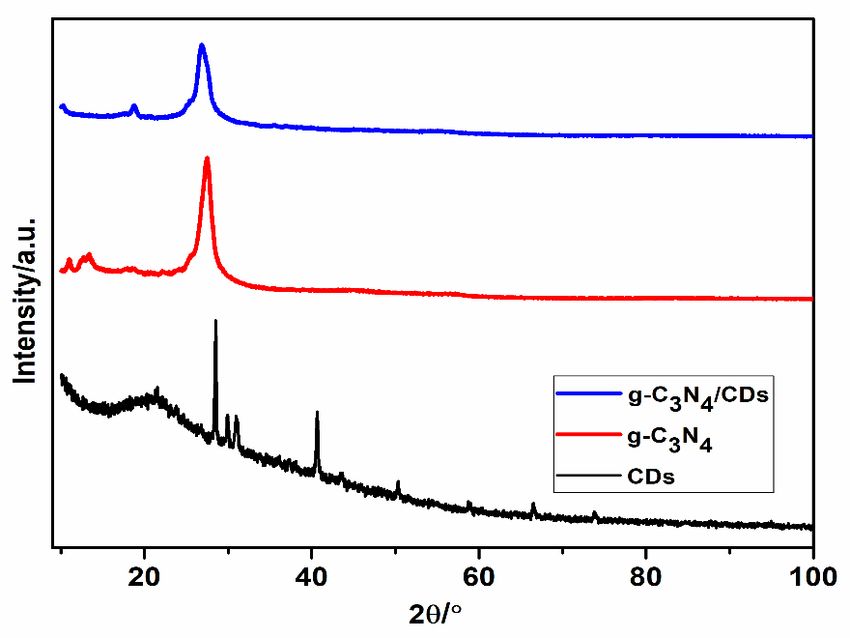
Int. J. Electrochem. Sci., 16 (2021) Article ID: 210560                                                  7

   (a)                                               (b)

Figure 4. (a) CV of g-C3N4/CDs/GCE in 5mM [Fe(CN)6]3-/4- (prepared 0.1 M KCl), (b) The linear plot
       of peak current vs square root of scan rate

3.2 Optimization of detection condition

3.2.1 Optimization of pH

       pH is known to affect transfer of proton in redox processes, and the interaction between the
analyte of interest and the electrode modifier [23]. As a result, the effect of pH on the electro-oxidation
of 2-CP on g-C3N4/CDs/GCE was investigated from pH 3.0 to 9.0 using differential pulse voltammetry
(DPV) in 0.1 M PBS (Figure 5). The peak current is most pronounced at near neutral pH values, with
highest current value at pH 7.6. The current value decreased at pH > 7.6. Consequently, the analyte was
prepared in PBS and the pH adjusted to 7.68 for all analyses.

Figure 5. The effect of pH value on the oxidation current of 2 mM 2-CP in 0.1 M in PBS on the g-
       C3N4/CDs/GCE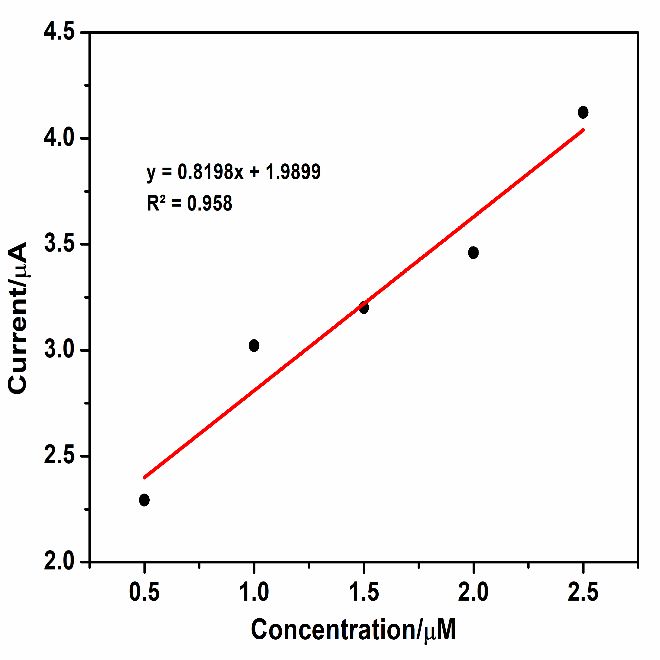
Int. J. Electrochem. Sci., 16 (2021) Article ID: 210560                                                 8

3.2.2 Effect of the amount of g-C3N4/CDs on the GC electrode

        To determine the amount of the modifier on the surface of GCE that would give the highest peak
current for 2-CP, 5 to 25 μL of the modifier suspension was pipetted onto the GCE. As can be seen in
Figure 6, the oxidation peak current of 2-chlorophenol gradually increases with increasing amount of g-
C3N4/CDs. The current response began to decline when the amount of the modifier was greater than 15
μL. Thus, the surface of GCE was modified with 15.0 μL of the nanocomposite for all analyses in this
study.

Figure 6. Effect of the amount of the g-C3N4/CDs suspension on the oxidation peak current of 2mM 2-
       chlorophenol

3.3 Voltammetric determination of 2-chlorophenol

        Owing to its better sensitivity and higher signal resolution than cyclic voltammetry, differential
pulse voltammetry (DPV) was utilised for the analysis of 2-chlorophenol using the g-C3N4/CDs/GCE
sensor under optimised conditions. It is evident in Figure 7 that the peak current of 2-chlorophenol
exhibits linear increment with concentrations of the analyte, in the ranges 0.5 to 2.5 μM and 2 to 10 μM.
The calibration graphs plotted for the two concentration ranges are shown in Figures 7(b) and 7(d).
        The limit of detection (LOD) was calculated using the relation, LOD = 3σ/m [24],
where σ is the standard deviation and m is the gradient of the linear calibration plot. The LOD was
calculated as 0.67 μM.
        The excellent performance of the g-C3N4/CDs modified GCE can be ascribed to the good
conductivity of CDs and the high electroactive area of g-C3N4. The extensive π-conjugation bonds in g-
C3N4 could also aid rapid electron transfer between the analyte and the electrode. The synergy between
the two materials could also be beneficial for the electrochemical process. Compared to other
electrochemical sensors in the table below (Table 1), the sensor proposed in this study exhibited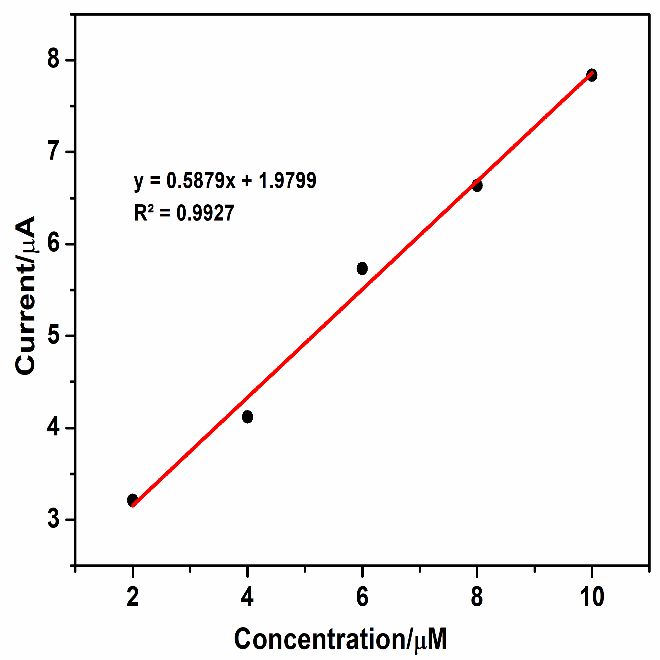
Int. J. Electrochem. Sci., 16 (2021) Article ID: 210560                                                9

considerably high sensitivity, and lower oxidation potential. The lower oxidation potential suggests that
the composite modifier showed some electrocatalytic characteristic.

   (a)                                              (b)

   (c)                                              (d)

Figure 7. (a) Differential pulse voltammograms of 2-CP in 0.1 M PBS at pH 7.6 ( [2-CP] = 2 - 10 μM)
       on g-C3N4/CDs/GCE (b) The linear plot of peak current vs concentration of 2-CP (2-10 μM) (c)
       Differential pulse voltammograms of 2-CP in 0.1 M PBS at pH 7.6 ( [2-CP] = 0.5 – 2.5 μM) on
       g-C3N4/CDs/GCE (d) The linear plot of peak current vs concentration of 2-CP (0.5 – 2.5 μM)
Int. J. Electrochem. Sci., 16 (2021) Article ID: 210560 10
Table 1. Comparison of the sensor proposed in this study with previously reported sensors for the
analysis of 2-chlorophenol in water
Sensors Linear range Detection pH Oxidation Ref.
(μM) limit (μM) potential
AB-DHP/GCE 0.2 – 40 0.05 7 0.62 [25]
f-CNTs/ RhB/GCE 0.05 – 125 0.028 3 0.74 [26]
CD/GRs/CPE 0.5-40 0.2 5.5 0.78 [27]
HRP-SDBS-HT-GC 0.005-0.05 0.002 7 - [28]
IL-Pd-graphene 4 - 800 1.5 7.4 0.6 [29]
MWNT-DCP 0.1 – 20 0.04 6 0.63 [30]
film-coated GCE
Poly(GMA-co- 1.6 - 68.8 0.249 7 - [31]
MTM)/PPy/CNT
CNT/PPy/HRP 1.6 – 8 0.26 7 - [32]
g-C3N4/CDs/GCE 0.5 – 10 1.50 7.6 0.4 This
work
3.4 Interference studies
A drawback of 2-chlorophenol detection using voltammetry or amperometric methods is that it
could be susceptible to interference from various compounds which are oxidized at the same or almost
the same potential with it. This leads to increase in the current signal of 2-chlorophenol. To study the
effect of potential interfering compounds/species on the current signal of 2-chlorophenol, 2 µM of the
analyte was used and a 5-fold higher concentration of each potentially interfering specie/molecule was
added. A wide range of inorganic ions including Cd2+, Hg2+, Fe2+, Pb2+, As3+, Zn2+, Mn2+, Fe3+, Cd2+ ,
Ag+, Na+, Mg2+ were found not to have significant effect on the current signal of 2-chlorophenol. The
addition of 5-fold higher concentration of the ions did not cause up to 5% change in the signal of the
analyte. Furthermore, phenol and some substituted phenols including bisphenol A, 4-nitrophenol and 4-
chloro-3-methylphenol were also investigated for their influence on the oxidation current of 2-
chlorophenol. It was found that 4-nitrophenol and bisphenol A showed no substantial interference on the
oxidation signal of 2-chlorophenol, but phenol and 4-chloro-3-methylphenol caused signal changes of
about +63 and +103% respectively.
3.5 Analysis of real water samples
To assess the suitability of the sensor for real life application, water samples were collected from
a river in the Vanderbijlpark and from a water tap in the University. The results from the analysis of the
water samples are shown in table 2. These results demonstrate that the sensor is promising for real
analytical measurements.Int. J. Electrochem. Sci., 16 (2021) Article ID: 210560 11
Table 2. Recovery of 2-chlorophenol in water samples (n = 3)
Water sample Amount of Amount of Recovery (%) Relative
analyte added analyte found standard
(µM) (µM) deviation (%)
River water 3.00 2.81 93.7 2.61
5.00 3.93 78.6 1.66
7.00 7.34 104.9 2.97
Tap water 3.00 3.80 126.7 3.94
5.00 6.32 126.4 3.95
7.00 7.47 106.7 2.28
4. CONCLUSION
An electrochemical sensor for the analysis of 2-chlorophenol in aqueous media was developed
based on g-C3N4/CDs/CGE. The individual characteristics and the synergy between g-C3N4 and CDs
were found to be beneficial for the detection and quantification of the analyte. Under optimised
conditions, the analyte concentrations varied linearly with the current signals, and a relatively low limit
of detection was obtained. This work provides a simple and sensitive device for monitoring 2-
chlorophenol in water.
ACKNOWLEDGEMENT
The National Research Foundation, South Africa, is gratefully acknowledged for financial support (grant
number 121191).
References
1. J. Jiang, H. Zhao, S. Sun, Y. Wang, S. Liu, Q. Xie, X. Li, Sci. Total Environ., 622 (2018) 1.
2. H. Frederiksen, O. Nielsen, H.M. Koch, N.E. Skakkebaek, A. Juul, N. Jørgensen, A.-M. Andersson,
Int. J. Hyg. Environ. Health, 223 (2020) 93.
3. M.A. Mazhar, N.A. Khan, S. Ahmed, A.H. Khan, A. Hussain, F. Changani, M. Yousefi, S. Ahmadi,
V. Vambol, J. Clean. Prod., 273 (2020) 23159.
4. H. Asiabi, Y. Yamini, M. Shamsayei, RSC Adv., 6 (2016) 94564.
5. F. Gao, X. Chen, X. Li, J. Li, H. Liu, L. Chen, Electrophoresis, 40 (2019) 1771.
6. D. Vlastos, M. Antonopoulou, I. Konstantinou, Sci. Total Environ., 551 (2016) 649.
7. M. Mehraban, M. Manoochehri, Sep. Sci. Plus, 3 (2020) 150.
8. F. Ghaemi, A. Amiri, J. Chrom. A, 1626 (2020) 461386.
9. X. Li, Y.-Y. Cui, C.-X. Yang, X.-P. Yan, Talanta, 208 (2020) 120434.
10. N.I. Ikhsan, P. Rameshkumar, N.M. Huang, Electrochim. Acta, 192 (2016) 392.
11. M.G. Peleyeju, A.O. Idris, E.H. Umukoro, J.O. Babalola, O.A. Arotiba, ChemElectroChem, 4
(2017) 1074.
12. Z. Keivani, M. Shabani-Nooshabadi, H. Karimi-Maleh, J. Colloid Interface Sci., 507 (2017) 11.
13. J. Liu, H. Wang, M. Antonietti, Chem. Soc. Rev., 45 (2016) 2308.
14. S. Vinoth, R. Ramaraj, A. Pandikumar, Mater. Chem. Phys., 245 (2020) 122743.
15. L. Liu, M. Wang, C. Wang, Electrochim. Acta, 265 (2018) 275.Int. J. Electrochem. Sci., 16 (2021) Article ID: 210560 12
16. H. Tian, H. Fan, J. Ma, L. Ma, G. Dong, Electrochim. Acta, 247 (2017) 787.
17. Y. Luo, Y. Yan, S. Zheng, H. Xue, H. Pang, J. Mater. Chem. A, 7 (2019) 901.
18. J.K. Rajput, J. Electroanal. Chem., 878 (2020) 114605.
19. C. Rajkumar, P. Veerakumar, S.-M. Chen, B. Thirumalraj, K.-C. Lin, ACS Sustain. Chem. Eng., 6
(2018) 16021.
20. K. Liang, L. Wang, Y. Xu, Y. Fang, Y. Fang, W. Xia, Y.-N. Liu, Electrochim. Acta, 335 (2020)
135666.
21. M. Bonet-San-Emeterio, M. Algarra, M. Petković, M. Del Valle, Talanta, 212 (2020) 120806.
22. J. Tashkhourian, S.F. Nami-Ana, M. Shamsipur, Anal. Chim. Acta, 1034 (2018) 63.
23. Y. Lianga, L. Yua, R. Yanga, X. Li, L. Qua, J. Li, Sensors Actuat. B: Chem.,240 (2017) 1330
24. P.J. Mafa, A.O. Idris, N. Mabuba, O.A. Arotiba, Talanta, 153 (2016) 99.
25. D. Sun, H. Zhang, Water Res., 40 (2006) 3069.
26. X. Zhu, K. Zhang, N. Lu, Y. Yu, X. Yuan, J. Guan, Chemosphere, 196 (2018) 514.
27. M. Wei, D. Tian, S. Liu, X. Zheng, S. Duan, C. Zhou, Sensors Actuat. B: Chem., 195 (2014) 452.
28. L. Fernández, I. Ledezma, C. Borrás, L.A. Martínez, H. Carrero, Sensors Actuat. B: Chem., 182
(2013) 625.
29. J.-J. Shi, J.-J. Zhu, Electrochim. Acta, 56 (2011) 6008.
30. C. Li, Microchim. Acta, 157 (2007) 21.
31. S.K. Ozoner, F. Yilmaz, A. Celik, B. Keskinler, E. Erhan, Current Appl. Phys., 11 (2011) 402.
32. S. Korkut, B. Keskinler, E. Erhan, Talanta, 76 (2008) 1147.
© 2021 The Authors. Published by ESG (www.electrochemsci.org). This article is an open access
article distributed under the terms and conditions of the Creative Commons Attribution license
(http://creativecommons.org/licenses/by/4.0/).You can also read