A NEW SUBURBIA CASE STUDIES OF SUCCESSFUL SUBURBAN EXPANSION - Suburban Alliance
←
→
Page content transcription
If your browser does not render page correctly, please read the page content below
A NEW
SUBURBIA
CASE STUDIES OF SUCCESSFUL SUBURBAN EXPANSION
PREPARED FOR Suburban Alliance
February 2020

                                                1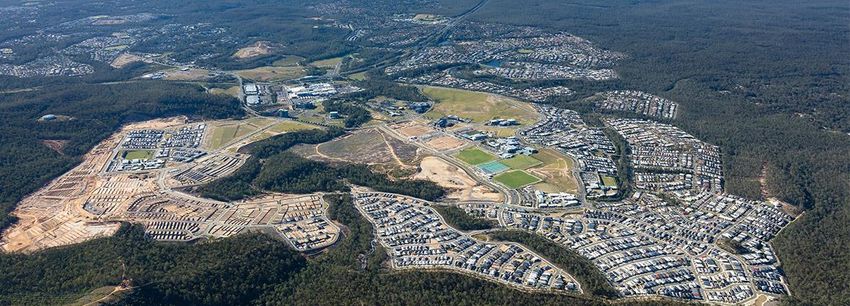
A NEW SUBURBIA
CASE STUDIES OF SUCCESSFUL SUBURBAN EXPANSION

Important Notice
© MacroPlan Holdings Pty Ltd All Rights Reserved. No part
of this document may be reproduced, transmitted, stored in a
retrieval system, or translated into any language in any form
by any means without the written permission of
MacroPlan Holdings Pty Ltd. All Rights Reserved. All
methods, processes, commercial proposals and other
contents described in this document are the confidential
intellectual property of MacroPlan Holdings Pty Ltd and may
not be used or disclosed to any party without the written
permission of MacroPlan Holdings Pty Ltd.

MacroPlan staff responsible for this report:

Mark Courtney, General Manager – QLD
Yvette Burton, Senior Consultant
Harry Courtney, Analyst
Jack Courtney, Analyst

Contact

Level 1
310 Edward Street
Brisbane QLD 4000
(07) 3221 8166
info@macroplan.com.au

                                                                2
A NEW SUBURBIA
CASE STUDIES OF SUCCESSFUL SUBURBAN EXPANSION

ABOUT THE SUBURBAN ALLIANCE
www.suburbanalliance.com.au

The Suburban Alliance is a not-for-profit collaboration of   Research project sponsor:
people and businesses who believe that opportunities for     The Residential Development
greater suburban quality of life, business opportunity and
                                                             Council
economic expansion could get more attention and
support than they currently do. We are not a lobby group
but instead intend to promote leading ideas, world-class
thinking, and local issues that relate to the enhancement
and vitality of suburban centres and their future
prospects.

Our Mission                                                  The Residential Development Council is a division of
To promote a better understanding of the important           the Property Council of Australia. It is the leading
role of the suburban economy in the life of our cities,      representative for the country's largest residential
through shared insights, information and analysis.           developers, providing powerful advocacy on behalf of
                                                             the industry that drives Australia's economy. It seeks
                                                             to promote an evidence based approach to
Our Vision                                                   understanding the role of the residential development
Progressive cities where quality social and economic         sector in the economic life of Australia, and in
infrastructure is equitably distributed across both          providing Australians with homes in which to live.
suburban and inner urban locations.

Our Goal
Equitable quality of life for suburban residents by
facilitating greater employment, leisure and retail
choices closer to where people live.

Corporate Members
Supporting the research efforts and public
engagement activities of The Suburban Alliance:

                                                                                                                      3
A NEW SUBURBIA
CASE STUDIES OF SUCCESSFUL SUBURBAN EXPANSION

Table of contents
Key findings                              5

Introduction                              6

Regional and local context                7

Amenity & infrastructure                  9

Population profile                      11

Demographic profile                     12

Worker profile                          14

Property market indicators              15

Energy use & sustainability             16

                                                4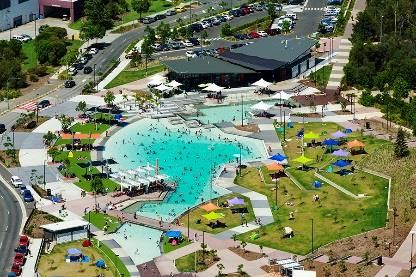
A NEW SUBURBIA
CASE STUDIES OF SUCCESSFUL SUBURBAN EXPANSION

Key findings
On behalf of the Suburban Alliance, Macroplan have undertaken an evidenced-based assessment of new suburban
communities. Below are the key findings for the master-planned communities of North Lakes and Greater Springfield,
in comparison to Brisbane Inner suburbs.

LOCAL AMENTIY & INFRASTRUCTURE

              •   Significant variance in the amount of                   •   Every      day   needs         are    well
                  open space enjoyed by residents                             accommodated       for    –     transport,
              •   Commute time to Brisbane CBD just                           education, medical, retail, sporting
                  45 mins                                                     and entertainment facilities.

POPULATION & DEMOGRAPHICS
              •   Strong historic population growth as                    •   Larger average household size with
                  the suburbs have developed and                              a higher proportion of traditional
                  continue to develop                                         families
              •   Lower population density covering a                     •   Higher percentage of couples with
                  larger geographic area                                      just one person employed full-time
              •   Younger average age, with a higher                      •   Comparable household incomes
                  % of children                                           •   Higher average household spend on
              •   Higher dependency on cars for                               groceries,   household        goods   and
                  getting to work and driving kids to                         general retail
                  school and sport

EMPLOYMENT

        10%
              •   Only ~10% of residents commute to                       •   Retail sector top employer
                  Brisbane Inner for work                                 •   Higher percentage of the workforce
              •   The majority (65-70%) work either                           are female
                  locally or within the surrounding area                  •   Higher percentage of the workforce
                                                                              are under 30 yrs of age

RESIDENTIAL PROPERTY

 50%          •   Affordable housing with house prices                    •   Lower vacancy rates
                  up to 50% cheaper and comparable                        •   Higher rental yields
                  to Bris Inner unit prices

ENERGY USE
              •   Similar to Brisbane Inner, however                      •   Households in Springfield 4.4 times
                  Springfield     residents   consume                         and North Lakes 2.4 times more
                  around 10% more on ave. per month                           likely to use solar energy

                                                                                                                           5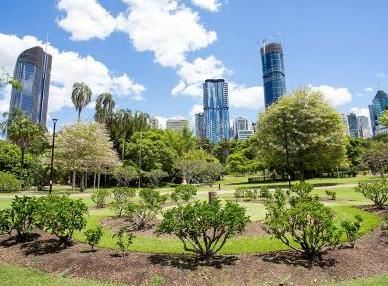
A NEW SUBURBIA
CASE STUDIES OF SUCCESSFUL SUBURBAN EXPANSION

Introduction
In some urban planning circles, suburbs are viewed as inferior to inner urban areas for a host of reasons: from
economic, to environmental, to traffic/congestion, and cultural and social. New suburban development has been
pejoratively labelled “sprawl” and is widely regarded as a less desirable form of urban growth.

The Suburban Alliance believes an evidence-based assessment of new suburban communities will reveal that many
of these anti-suburban prejudices are not justified. We have chosen North Lakes and Springfield in the Brisbane
region as two case studies of new suburban development because they were both “masterplanned” suburban
communities which started from nothing, and both have had more than 20 years to develop and mature.

The Suburban Alliance engaged Macroplan to prepare an evidence based assessment of new suburban
communities in order to facilitate and inform discussion around urban and regional development, with North Lakes
and Greater Springfield chosen as case studies.

The report includes the following for each case study community:
•   A review of the regional and local context of the areas, including a brief history of the community and masterplan
    background;
•   A review of the demographic profiles, based on the latest Census data;
•   An overview of the residential property market profiles;
•   A review of the employment profiles of each community;
•   A review of commuting patterns for each community;
•   A review of environmental and open space attributes for each community; and
•   An overview of local services and amenity of each community.

    “Suburbia is not a condition that needs to be cured. It is not an
    ailment.

    Indeed, in many respects, new suburban developments offer
    enhanced quality of life, environmental and economic
    outcomes to their residents.

    A more balanced appreciation of the characteristics of new
    suburban developments is what we hope to achieve via
    research projects such as this.”

                                                                  The Suburban Alliance. February 2020.

                                                                                                                         6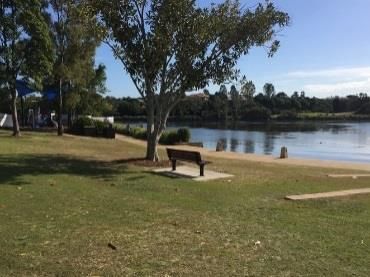
A NEW SUBURBIA
CASE STUDIES OF SUCCESSFUL SUBURBAN EXPANSION

Regional and local context
    NORTH LAKES
•   North Lakes is located within the Moreton Bay       •   Local amenity is set to improve with a new
    Regional Council area, approximately 27km north         lifestyle and commercial precinct, Laguna North
    of Brisbane and 10km inland of Redcliffe.               Lakes, with construction due to commence mid-
                                                            2020.
•   Residential development of the master-planned
    community began in the late 1990’s with new         •   The $250 million precinct will include a further
    residents calling the suburb home at the start of       5,000 sq.m of retail, 10,500 sq.m of commercial
    2000.                                                   space, 140-room hotel, 2,000 sq.m gym, lagoon-
                                                            style swimming pool and learn to swim pool plus
•   Originally part of Mango Hill, North Lakes was
                                                            3,000 sq.m poolside restort-style hospitality
    gazetted as a separate suburb in 2006.
                                                            venue.
    Continued residential development would see the
    resident population grow strongly by an average     •   Residents also benefit from access to Moreton
    13% per annum for the 10 years following.               Bay’s first university campus newly completed in
                                                            early 2020 in the nearby suburb of Petrie, of
•   North Lakes, home to an estimated 36,650
                                                            which is readily accessible by train. The new
    residents in 2019, was developed as a place
                                                            University of Sunshine Coast campus had its first
    where people could live, work and play with
                                                            intake of students in Semester 1 2020, with the
    around 30 percent of the suburb dedicated to
                                                            campus forming part of the first stage of the 10.5
    open space, including waterways, parklands and
                                                            hectare, ‘The Mill’, educational and cultural
    recreational facilities.
                                                            precinct.
•   Now a well-established community, residents
                                                        •   For the purposes of this assessment, the North
    have access to a variety of schools, health
                                                            Lakes – Mango Hill SA2 has been used, which
    precinct and hospital as well as multiple retail
                                                            also includes the suburb of Mango Hill, another
    facilities including Westfield North Lakes, sub-
                                                            masterplanned community, which was largely
    regional shopping centre, an Ikea and
                                                            established when development in North Lakes
    Queensland’s only Costco outlet.
                                                            began.

     North Lakes
     Source: stockland.com.au

                                                                                                                 7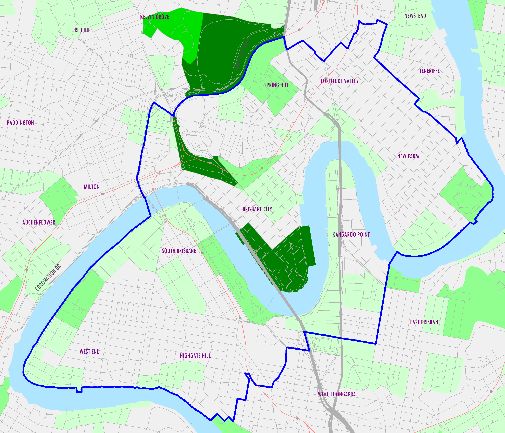
A NEW SUBURBIA
CASE STUDIES OF SUCCESSFUL SUBURBAN EXPANSION
Regional and local context
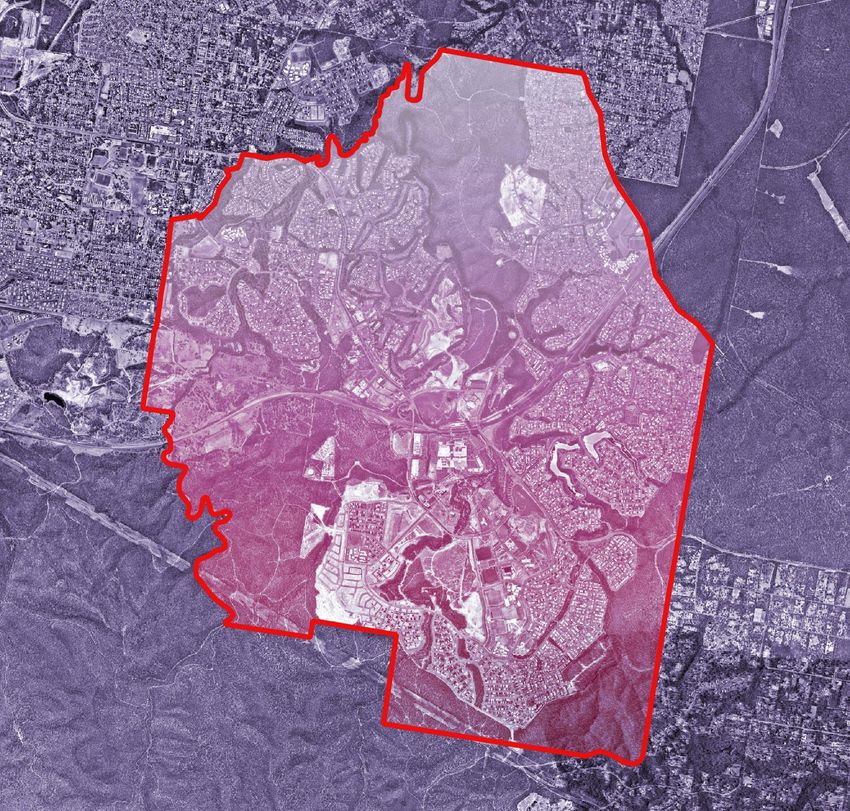
GREATER SPRINGFIELD
• Greater Springfield (Springfield) is located within
the Ipswich City Council area, approximately
30km southwest of Brisbane and 20km southeast
of Ipswich CBD.
• Encompassing 2,860 hectares Springfield is
Australia’s largest and first privately developed
satellite city, situated in one of SEQ’s fastest
growing corridors and includes the suburbs of
Springfield, Springfield Central, Springfield Lakes,
Augustine Heights, Spring Mountain and Springfield Central
Brookwater. Source: greaterspringfield.com.au
• The master-planned community is centralised • In addition to a growing town centre, residents
around the town centre of Springfield Central, also have access to a significant amount of
which currently accommodates a sub-regional parklands and recreational facilities, with 30
shopping centre, Orion Springfield, Orion percent of Springfield to be dedicated to outdoor
swimming lagoon as well as commercial, space. This currently includes the 24ha Robelle
educational and health precincts, including a Domain parklands, White Rock - Spring Mountain
Mater Private Hospital and University of Southern Conservation Estate, Springfield Central Sports
Queensland campus. Complex (opened 2019) and Brookwater Golf
Club as well as a number of parks and children’s
• Once fully developed, Springfield Central’s playgrounds.
390-ha CBD will accommodate 2.6 million square
metres of mixed use space, including • Some key developments proposed for Springfield
commercial, retail and educational uses, along include a 1,200-bed Mater Public hospital, and a
with 22,850 residential units. Brisbane Lion’s AFL stadium (due for completion
2021).
• Since residential development first began in the
late 1990s, Springfield’s population has grown • As the city continues to develop, sustainability will
significantly with the resident population continue to be paramount, with the city aiming to
increasing by an average of 10.1% per annum achieve zero net energy by 2038 as well as
over the 10 years to 2016. integrating sustainable design into buildings and
the landscape.
• With an estimated resident population of
approximately 36,000 in 2019, Springfield’s
population is forecast to increase to nearly So how do these two
120,000 by 2036.
• Residents have access to a variety of schools
master-planned regions
offering both primary and secondary, public and really compare to the likes
private education as well as a TAFE and a
number of child care centres.
of Brisbane’s Inner
• Springfield is supported by bus services as well
suburbs?
as two train stations located at Springfield Central
and Springfield. The region is also easily
accessible via the Centenary Highway as well as
Why are more and more
the Logan and Ipswich motorways, providing people choosing to live in
connections to Brisbane, Ipswich and the Gold
Coast.
the New Suburbia?
8A NEW SUBURBIA
CASE STUDIES OF SUCCESSFUL SUBURBAN EXPANSION
Comparing amenity & infrastructure
Open space
Public space - % of total geographic area
30% 9%
42%
North Lakes Springfield Bris Inner
• Residents in North Lakes and Springfield enjoy a Private space Public space
0.41
much higher percentage, 30% and 42%
respectively, of the suburb dedicated to open 800
0.22
space, compared to just 9% in Brisbane Inner 535
445
• On per capita basis, North Lakes and 0.02
Springfield enjoy 10 to 20 times more public
open space to that of Brisbane Inner residents Ave. lot sizes (sq.m) Sq.km / 1000 residents
• Residents also enjoy a greater amount of North Lakes Springfield Bris Inner
private space, with larger average lot sizes.
Source: Australian Bureau of Statistics, Brisbane City, Ipswich and Moreton Bay Regional councils, macroplan
Parks, recreation areas & sporting facilities
Public space in masterplanned communities tends to be provided for by developers. In the inner city, it is provided
by tax payers via state of local government instruments.
North Lakes: Springfield: Brisbane Inner:
• Town Park Lake Eden • Robelle Domain • South Bank Parklands,
• North Lakes Golf Course • Orion Lagoon and parklands • Botanic Gardens (CBD),
• Halpine Lake Reserve • Springfield Sports Complex, • Roma Street Parklands,
• Melaleuca Lakes and Parklands • White Rock - Spring Mountain • New Farm Park,
• North Lakes Environmental Park Conservation Estate, • Kangaroo Point Cliffs
• North Lakes Aquatic Centre • Brookwater Golf Club,
North Lakes Environmental Park Orion Lagoon Brisbane Botanic Gardens
Source: weekendnotes.com.au Source: greaterspringfield.com.au Source: brisbane.qld.gov.au
9A NEW SUBURBIA
CASE STUDIES OF SUCCESSFUL SUBURBAN EXPANSION
Comparing amenity & infrastructure
Social Infrastructure
North Lakes Springfield Bris Inner
Hospitals 1 1 9
Medical centres 8 3 49
Child Care 16 8 35
Primary School 12 9 11
Secondary School 9 6 14
Universities 0 1 6
Tafe 0 1 3
Public transport Major Developments
North Lakes
Brisbane
Inner • Laguna project (p) - $250m
North Lakes Lifestyle and
Springfield 40-45 minute commute to CBD Commercial precinct to include:
5,000 sq.m of retail,
North 45 minute commute to CBD 10,500 sq.m commercial space,
Lakes 140-room hotel,
2,000 sq.m gym,
lagoon-style swimming pool and
learn to swim pool plus
Sporting clubs & facilities 3,000 sq.m poolside restort-style
hospitality venue.
Due to commence mid-2020,
North Lakes Springfield
with completion by 2022.
AFL Y Y
AUS Kick Y Y
Basketball Y Y Springfield
Bowls N N • 75% of Greater Springfield yet to
Cricket Y Y
be developed, with planning
Cycling Y Y
approval for a further ~2.685
Golf Y Y
million sq.m of mixed use
Indoor sports centre Y Y
Little Athletics N Y development (worth ~$70bn).
Martial arts (Boxing, Karate, etc.) Y Y • Mater Hospital, 1,200 beds (p)
Netball Y Y • 18 ha education precinct
Park run Y Y • Brisbane Lions stadium &
Performing Arts / Dance Y Y training facility (p)
Public pool / Aquatic centre Y Y
Rowing / sailing / canoing N Y
Brisbane Inner
Rugby Y Y
Rugby League Y Y • Queens Wharf (UC)
Soccer Y Y • Cross River Rail (UC)
Tennis Y Y • Brisbane Live (p)
Touch Y Y • Brisbane Metro (p)
Walk/Bikeways Y Y
UC – under construction
Source: flaticon.com.au, macroplan p - proposed
10A NEW SUBURBIA
CASE STUDIES OF SUCCESSFUL SUBURBAN EXPANSION
Comparing population profile
Historic and projected population Average annual growth
140 13.0%
Thousands
120 10.1%
100
80 6.1%
60
40 3.0% 3.2%
2.4%
20
-
2006 2016 2036 (f) 2006-2016 2016-2036
North Lakes Springfield Bris Inner North Lakes Springfield Bris Inner
• Historically, North Lakes recorded the strongest
Population density (persons / sq.km)
growth @ 13% AAGR
• Springfield is set to continue strong growth and North Lakes Springfield Bris Inner
by 2036 accommodate a resident population
similar to Brisbane Inner, but at nearly two and 2016
half times less in density.
2036
- 2,000 4,000 6,000 8,000
Source: Australian Bureau of Statistics, flaticon.com, macroplan
Source: communities.lendlease.com
11A NEW SUBURBIA
CASE STUDIES OF SUCCESSFUL SUBURBAN EXPANSION
Comparing demographic profile
Household type & size North
Springfield
Brisbane
Lakes Inner
• Traditional families (couples with dep't child.) the
more predominant type in suburban areas, with 60% 62% 27%
an average household size of 3 compared to 2 in
Brisbane Inner
18% 16% 37%
• Households without children make up 60% of
families in Brisbane Inner 5% 4% 23%
• With a higher proportion of young families, the Ave.
household 3 3.1 2
average age of North Lakes and Springfield size
residents is considerably lower than Brisbane
Inner 100% 37 40
32
29
Average age 63%
50%
• Higher average age for Brisbane Inner reflective 50%
46%
20
34% 35%
of higher proportion (~50%) aged between 20 and 24%
20%
40yrs and ~24% aged 50 and over. 15% 13%
• Over a third of residents in North Lakes and 0% 0
North Lakes Springfield Bris Inner
Springfield are infant and school aged children (0- 0-19 20-50 50+ Ave Age
19yrs) compared to ~13% in Brisbane Inner
Source: Australian Bureau of Statistics, flaticon.com, macroplan
Ethnic origin Average incomes, employment &
education level
5%
Bris Inner 55% 19% $116,295
4% Household $124,508
$116,876
Springfield 66% 5% 9% 10%
$38,945
Per capita $39,796
North Lakes 65% 9% 9% 7% $57,219
Australian UK NZ Asia Other
• Higher proportion of Australian-born residents in
45% 44%
Springfield and North Lakes
36%
• Of those born overseas currently living in North 23%
26% 27%
Lakes the majority are from either the UK or New
Zealand, compared to a higher proportion of
Asian-born residents in Brisbane Inner
Both employed FT One employed FT
• Lower per capita incomes relative to Brisbane
Inner, however household incomes on par or
higher which, as further indicated by the 42%
32% 32%
employment status of ‘couple families’, reflects a 21%
21% 21% 19% 19%
greater opportunity for one partner to either stay- 16%
at-home or be employed part-time
• Only 21% have a Bachelor degree or higher Bachelor degree or Diploma / Cert Year 12
higher
compared to 42% of Brisbane Inner residents
North Lakes Springfield Bris Inner
• North Lakes and Springfield residents are more
likely to have a Diploma or Certification (~32%) Source: Australian Bureau of Statistics, flaticon.com, macroplan
12A NEW SUBURBIA
CASE STUDIES OF SUCCESSFUL SUBURBAN EXPANSION
Comparing demographic profile
Retail Spend
• Similar to average incomes, per capita retail Household spend compared to Brisbane Inner
spend is lower in North Lakes and Greater
Springfield, compared to Brisbane Inner, however Food Catering
average household retail spend is between 16
Retail Services
and 20 percent higher.
General Retail
Household Goods
Household
Other Food & Groceries
Fresh Food
Per capita -25% 0% 25% 50%
North Lakes Springfield
North Lakes Springfield Bris Inner
• Higher household expenditure and the type of • Household spending is considerably higher on
retail categories on which it is spent is reflective fresh food and groceries (30-45%), household
of higher average household size and proportion goods (20-30%) and general retail (40-50%),
of traditional families. whilst lower on food catering (-20%) and retail
services (up to -20%).
Source: Australian Bureau of Statistics, flaticon.com, macroplan
Modes of transport
Car ownership How residents get to work
100% 2.1 2.4
1.9 2.2 Walk/Bicycle
28%
1.6 2.0
1.8
1.6
1.4 Private car
50% 1.2 38%
1.0
0.8
0.6 Public transport
0.4 20%
0.2
0% - 0% 50% 100%
North Lakes Springfield Bris Inner
North Lakes Springfield Bris Inner
% 0 Cars % 1 Car % 2 + Cars Ave. no. of people per car
• There is a higher proportion of multiple car • High car ownership is reflected in a higher
ownership in North Lakes and Springfield, with proportion of North Lakes and Springfield
over 50% owning 2 or more cars, compared to a residents using a car as their primary mode of
thirdd of Brisbane Inner households. This is transport to and from work (~75%)
reflective of traditional families where a car is • Brisbane Inner residents have a stronger
needed for multiple purposes (school drop off, preference for walking/cycling to work and a
kids sport, etc.) relatively higher profile for public transport
• High car ownership is also reflected in a higher
proportion of NL and GS residents using a car as
their primary mode of transport to and from work
Source: Australian Bureau of Statistics, flaticon.com, macroplan
13A NEW SUBURBIA
CASE STUDIES OF SUCCESSFUL SUBURBAN EXPANSION
Comparing worker profile
Where residents work
56%
48% 48% Reside: Work:
Study area Brisbane Inner Local area Surrounding area
34% North Lakes SA3 Within study Brisbane north side
area and Moreton Bay
22%
17%
Springfield SA3 Within study Brisbane south side,
16%
11%
12%
10% area Ipswich and Logan
9% 7%
5% 6% Bris Inner n/a - refer local Within study Rest of Brisbane
area area LGA
Brisbane Local area Surrounding Elsehwere in Elsehwere in
Inner area Greater Qld &
Brisbane interstate
North Lakes Springfield Bris Inner
• Percentage of residents that live and work in their • North Lakes and Springfield residents
local and surrounding area: are just as likely to work elsewhere in
Greater Brisbane or somewhere else in
• North Lakes = 70% Queensland as they would Brisbane
• Springfield = 65% Inner.
• Brisbane Inner = 90%
• The proportion of residents that work
• For both North Lakes and Springfield, only within their local area has increased by
around a tenth of residents commute to 4-5% for both North Lakes and
Brisbane Inner for work. Springfield between 2011 and 2016.
Source: Australian Bureau of Statistics, macroplan
Local workforce profile North Lakes Brisbane
& Springfield Inner
100%
75%
~50%
50% ~50% aged Female
25% Over 30% ~60% 30-50yrs
0% aged 40% less ~$93,000 Prof. tech &
Retail trade
• The workforce in both North Lakes and #1 employer
services
~20%
Springfield have a higher proportion (over 30%) ~20-25%
of workers who live locally (ie within the same
catchment as their workplace), compared to
75.0%
Brisbane Inner (11%).
• Between 2011 and 2016, the size of North Lakes’ 50.0%
and Springfield’s workforces doubled, compared
Brisbane Inner’s increasing by only 7 percent. 25.0%
• Even with a doubling in workforce size, North 0.0%
Lakes and Springfield’s rate of self-sufficiency Unemployed Full time Part Time Male Female
(i.e. employing those who live locally) remained North Lakes Springfield Bris Inner
relatively unchanged at ~30% and ~48%
respectively Source: Australian Bureau of Statistics, flaticon.com, macroplan,
14A NEW SUBURBIA
CASE STUDIES OF SUCCESSFUL SUBURBAN EXPANSION
Comparing property market indicators
Housing affordability Dwelling typology & ownership
Unoccupied
≈
Unit
$485,000 - $390,000-
House
$525,000 $530,000
North Lakes & Brisbane
Springfield Inner Rent
HOUSE UNIT
Mortgaged
• The median sale price for a unit in Brisbane Inner
Owned
is comparative to a house in North Lakes and
Springfield
0% 25% 50% 75% 100%
• Median house prices in North Lakes and
North Lakes Springfield Bris Inner
Springfield are up to 50% cheaper than Brisbane
Inner.
• Detached houses are the predominant dwelling • While the proportion of dwellings rented is
type for both North Lakes (77%) and Springfield typically high in Brisbane Inner, North Lakes and
(86%), compared to higher density dwellings Springfield have around 45% of dwellings that are
(71%) in Brisbane Inner. rented, with a lower unoccupied rate’ indicating
healthy tenant demand.
• Average lot sizes larger than Brisbane Inner
‘As at 2016 census night
Source: CoreLogic RP Data, Australian Bureau of Statistics, flaticon.com, macroplan
Yields and Vacancy rates
Indicative yields
North Lakes Springfield Bris Inner
Vacancy rates
7.5%
5.0% 5.4%
5.0% 4.4%
4.1%
4.8%
2.5% 2.7%
3.5%
2.0%
0.0%
2014 2015 2016 2017 2018 2019 Houses Units
• Vacancy rates have averaged ~3% for both North • With strong tenant demand, indicative yields are
Lakes and Springfield (2014-2019) compared to also stronger for both houses and unit compared
~5.5% for Brisbane Inner to Brisbane Inner
Source: CoreLogic RP Data, SQM research, macroplan
15A NEW SUBURBIA
CASE STUDIES OF SUCCESSFUL SUBURBAN EXPANSION
Comparing energy use & sustainability
Residential energy & solar
Per capita energy use Households using solar
172 Springfield (4300)
157 5,522
152 North Lakes (4509)
Bris Inner
3,070
1,264
North Lakes Springfield (4300) Bris Inner 2009 2010 2011 2012 2013 2014 2015 2016 2017
(4509)
Usage ratio to Brisbane Inner
• Energy usage on a per capita basis is relatively
similar compared to Brisbane Inner. Springfield
residents consume around 10% more electricity 4.4 X Solar usage
Springfield
on average per month.
2.2 X Pools
• We assume Springfield households likely
consume more energy due to a higher number of
North
2.4 X Solar usage
pools.
Lakes
• Growth in solar usage has outstripped that of 1.6 X Pools
Brisbane Inner, with households in Springfield 4.4
times and North Lakes 2.4 times more likely to Energy usage and pool counts are based upon Energex data by
postcodes 4509, 4300 and an aggregate of postcodes 4000, 4101
use solar energy.
and 4005 for Brisbane Inner.
Source: Energex, Australian Bureau of Statistics, flaticon.com, macroplan
Sustainability
North Lakes: Springfield:
• Sustainable building practices: • Sustainable building practices – 5-green-star
The Corso – first commercial building in rated:
Australia to be awarded a 5-green-star Springfield Tower,
rating GE Building
North Lakes Business Park designed • Dedicated integration of uses with the natural
around sustainability design guidelines environment and provision of open space
North Lakes Sports Club powered by 1,000 • Zero net energy target by 2038:
solar panels renewable energy generation;
storage infrastructure
district energy schemes
green mobility solutions
energy efficiency initiatives
water saving
sustainable living practices
16SYDNEY MELBOURNE BRISBANE GOLD COAST PERTH Level 10 Level 16 Level 1 Level 2 Level 1 580 George Street 330 Collins Street 310 Edward Street 89 - 91 Surf Parade 89 St Georges Terrace Sydney NSW 2000 Melbourne VIC 3000 Brisbane QLD 4000 Broadbeach QLD 4218 Perth WA 6000 (02) 9221 5211 (03) 9600 0500 (07) 3221 8166 (07) 3221 8166 (08) 9225 7200 www.macroplan.com.au
You can also read