A Novel Compression Framework for Electro Cardiac Signals
←
→
Page content transcription
If your browser does not render page correctly, please read the page content below

Journal of Physics: Conference Series

PAPER • OPEN ACCESS

A Novel Compression Framework for Electro Cardiac Signals
To cite this article: B Siva Kumar Reddy et al 2021 J. Phys.: Conf. Ser. 1964 062038

View the article online for updates and enhancements.

 This content was downloaded from IP address 46.4.80.155 on 12/09/2021 at 13:24
ICACSE 2020 IOP Publishing
Journal of Physics: Conference Series 1964 (2021) 062038 doi:10.1088/1742-6596/1964/6/062038

A Novel Compression Framework for Electro Cardiac Signals

 B Siva Kumar Reddy*, Raja Krishnamoorthi, and Ch Priyanka
 Department of Electronics and Communication Engineering, CMR Engineering
 College, Hyderabad, India
 Email: *bsivakumar100@gmail.com

 Abstract. Electrocardiography (ECG) is a method of measuring cardiovascular electrical
 movement over a span of time using skin-situated electrodes. In patient surveillance, large
 volumes of ECG information must be preserved. So as long as we essential to track a patient
 heart working condition, we should have to save more facts. However, it is very expensive to
 storage, transmit in addition distribute bandwidth. A powerful compression strategy has been
 practical to solve this problem so that all the excellent scientifically important functionality can
 be conserved. We used the MIT-BIH ECG information base for ECG research.
 Keywords: ECG data, Fourier transform, Fast Fourier Transform, DCT, DWT, Walsh hadamard
 transform and MIT-BIH ECG database

1. Introduction
The measurement of electrical heart action [1] checks how the heart functions. Persons with cardiac-
related complications have a long background for diagnosable ECGs, so vast number of storage facilities
are essential. Subsequently there is a requirement for a framework which contains ECG pressure
indicators alongside ECG investigation [2]. ECG pressure is a superior technique for minimize
computational many-sided quality as far as storage. Flag pressure in addition flag check-up have demand
in many application areas mostly in biomedical sector [3]. ECG indications are varied for every
individual. The ECG design acknowledgment is a standout amongst the utmost dependable coronary
illness recognizable proof strategies. The cathodes linked to the body recognise the electrical move of
the heart. Each and every terminal the ECG will record in addition store for a drawn out stretch of time.
[5]. In this, QRS complex is most essential part which demonstrates the electrical depolarization of the
ventricle muscles in the heart. The duration also stature of QRS gives critical measure of data to doctor
in this manner he/she can undoubtedly comprehend the state of heart. A cardiovascular patient with the
historical backdrop of heart diseases will constantly have to keep up a huge load of ECG reports while
going to a specialist for meet. We will probably layout a structure which incorporates pressing factor of
ECG for requesting average also odd classes of ECG indications. Digitalising the ECG banner will deal
with the capacity problem besides it moreover will be reasonable when originates to sharing also finding.
The graphical recording of bioelectrical possibilities generated by heart on the surface of the body is
called ECG (Electro-Cardiogram). An ordinary mechanized flag handling framework gets a lot of data
that is hard to store and transmit. Here comes the significance of data pressure. Data pressure is the way
toward recognizing and disposing of redundancies in a given data set [4]. Through this data pressure
method framework needs to accomplish greatest data volume lessening while protecting noteworthy
data’s. The requirement for flag pressure in many applications those are required for transmission and
storage. Expansive measure of ECG information needs to effectively store in healing facilities for
monitoring reasons. The ECG monitoring gadget must have a memory limit of 200 Mbytes for three
lead recordings. For all intents and purposes proficient data pressure might be accomplished just with
 Content from this work may be used under the terms of the Creative Commons Attribution 3.0 licence. Any further distribution
 of this work must maintain attribution to the author(s) and the title of the work, journal citation and DOI.
Published under licence by IOP Publishing Ltd 1
ICACSE 2020 IOP Publishing
Journal of Physics: Conference Series 1964 (2021) 062038 doi:10.1088/1742-6596/1964/6/062038

loss pressure techniques. On account of ECG flag pressure, the primary target is to accomplish less
number by safeguarding the significant indicative in the recreated flag. There is an expanding interest
for long haul persistent monitoring of a patient's ECG and action, which offers the chance to assess the
execution of the cardiovascular framework [6].

2. Related Work
In past, explores have proposed change techniques, for example, Fast Fourier Transform, Discrete
Cosine Transform [10] also Discrete Wavelet Transform. FFT has the preferred standpoint that it lessens
the quantity of calculations. FFT is utilized for the ECG flag pressure alongside zero associating
limitation. For the most part ECG flag decay is thought to be time differing because of some heart
variations from the norm. By utilizing general FFT conditions the Fourier arrangement coefficients are
computed, and this procedure must be performed on each recognized cycle. These Fourier arrangement
coefficients are utilized to incorporate the first flag [11]. The block chart demonstrates the pressure and
reproduction arranges in the method. The primary stage is the change computation. At that point apply
edge condition on change coefficients on the premise of vitality pressing effectiveness of coefficients
[7], that makes settled number of edge esteem is set to zero. Versatile thresholding settled thresholding
or edge set by physically is likewise embraced. This esteem can be picked by considering the most
extreme estimation of coefficient. Next stage is applying uniform quantization on these coefficients. The
progression estimate esteem is acquired from the most extreme and minimum estimation of the flag
framework. By setting step estimate the quantization levels are made and relating quantization tables
are made to reproduce the first flag. The quantized data contains repetitive data which causes wastage
of space.
 With a specific end goal to defeat this disadvantage entropy encoding strategy known as Huffman
coding is utilized [13]. The heart beat sensor TCRT1000 is used for continuous monitoring the heart
beats of a user per minute. The blood pressure is the quantity of beats per minute measured and the
heart rate measured. In this stage the probabilities of event of the symbol in the flag are figured and in
view of this esteem make another Table. [12] This Table esteem gives the packed adaptation of ECG
flag. For the characterization and investigation handle the table must save the information's with respect
to the R peak and RR interval. From this, it is straightforwardly comprehending that quantized table is
subject to the first ECG flag.

2.1. Fourier Transform
 The sign can be breaking down more adequately in frequency area than the time space, in light of the
fact that the qualities of a sign will be more in frequency space. One conceivable approach to change
over or transform the sign from time to frequency space is Fourier transform (FT) [14].
 FT is a methodology which separates the sign into various frequencies of sinusoids, and it is
characterized as a scientific methodology for transforming the sign from time space to frequency area.
FT has a downside that it will work out for just stationary signs, which won't change with the time frame.
Since, the FT connected for the whole flag however not portions of a sign, on the off chance that we
consider non-stationary sign the sign will fluctuate with the time frame, which couldn't be transformed
by FT. also, one more downside that we have with the FT is we can't say that at what time the specific
occasion will has happened.

2.2. Short-Time Fourier analysis
To adjust the inadequacy in FT, Dennis Gabor in 1946 presented another technique called windowing,
which can be connected to the sign to investigate a little area of a sign. This adjustment has been called
as the Short-Time Fourier Transform (STFT)[15], in which the sign will be mapped into time and
frequency information. In STFT, the window is altered. In this way, we this window won't change with
the time of the sign i.e., for both tight resolution and wide resolution. Also, we can't anticipate the
frequency content at every time interim segment.

 2
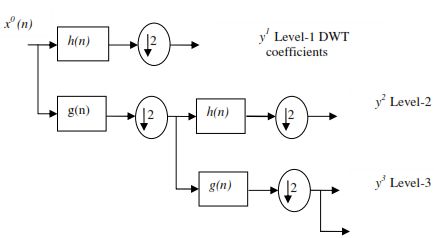
ICACSE 2020 IOP Publishing
Journal of Physics: Conference Series 1964 (2021) 062038 doi:10.1088/1742-6596/1964/6/062038

2.3. Discrete Cosine Transform
DCT was one of the processes used to disintegrate a host signal into many frequency ranges. This made
it much simpler to compact the meta data where even the data can be translated to a spatial domain and
broken into 8x8 blocks. The DCT is given in two dimensions
 1
C(0,0) = ∑M−1 N−1
 x=0 ∑y=0 f(x, y) (1)
 N
 1
C(u, v) = ∑M−1 ∑N−1
 y=0 f(x, y) ∗ [cos(2x + 1)uπ] ∗ [cos(2y + 1)vπ] (2)
 2N3 x=0

Where,u = 0,1,2, … . , M − 1, v = 0,1,2, … . , N − 1 and j = √−1. The inverse DCT (IDCT) is given
by
 1 1
f(x, y) = C(0,0) + 3 ∑M−1 N−1
 x=0 ∑y=0 f(u, v) ∗ [cos(2x + 1)uπ] ∗ [cos(2y + 1)vπ] (3)
 N 2N

2.4. Wavelet Analysis
A wavelet technique i.e., variable windowing has been introduced to overcome the STFT drawbacks.
Wavelet analysis makes the use of time periods, how we want detailed info with less frequencies, and
shorter areas wherever we want knowledge with higher frequencies.

 Figure1. Wavelet Decomposition Tree

 In above Figure 1, it is shown that the decomposition of input using wavelet transform and how the
analysis of transformation will apply to get the frequency information of input signal. We can observe
that it shows more number of features. Wavelet is also called as multi resolution analysis (MRA).

3. Proposed Methodology

 Figure2. Sample of Fast WHT using DCA

Heart ailments are the genuine compassion for some people. So, discovery of the heart related issues
and neutralizing activity of the equivalent has at by and large importance. The inspection of
electrocardiogram banner is the normal test for perceiving issue of the heart. This paper exhibited the
use of parcel besides vanquish computation for the assessment of ECG waveform. People with a heart
connected issue get a long history of ECG for controlling reasons, which implies that much stockpiling

 3
ICACSE 2020 IOP Publishing
Journal of Physics: Conference Series 1964 (2021) 062038 doi:10.1088/1742-6596/1964/6/062038

limit are required. ECG pressure is an unrivaled strategy for limit computational complex nature to the
extent stockpiling. Thus, developed an automated assurance structure for specialists especially
cardiologist for straightforward finding of ECG assortments also portrayal of the ECG wave forms under
conventional also bizarre classes. By developing such a structure with pressing factor then multiplication
limit the memory need issue also can be discarded.

 The Walsh-Hadamard Discrete Transform (WWT) is an orthological transition that breaks
down a signal into a group of linear analagous wavelengths called Walsh Components [8]. Only binary
value +1 or -1 is used to convert Hadamard. The forward and reverse DWHT pair is described as follows
for a signal X(t) of length N , In above Figure 2.
 1
 yn = ∑N−1 i=0 x i AL(n, i), n = 1,2, . . . . , N − 1 (4)
 N

 xi = ∑N−1
 n=0 yn AL(n, i), i = 1,2, . . . . , N − 1 (5)

 Where x(n) besides y(n) are the original and reconstructed signals. Characterizing non-linear
signals, multiplexing also coding in communications, rational design in addition analysis besides solving
non-linear differential equations. A division and conquer algorithm (DCA) [9] operate by the remedial
breakup of an issue into 2 or more subsets or same similar kind, since these are relatively easy for
immediate resolution. The answer to the issues eventually is mixed in order to answer the initial issue.
Fast Walshhadamard is a DCA that recursively breaks down a WHT of size N into 2 smaller WHTs of
sizeN⁄2.This implementation follows the 2N × 2N Hadamard matrix recursive definition.
 1 H HN−1
 HN = [ N−1 ] (6)
 √2 HN−1 HN−1

 The series ordered, also called Walsh ordered, is quickly converted into Walsh – Hadamard, FWHTw
and then rearranged by measuring the FWHTh as above. The normalisation variables for each point can
be placed together or even ignored.

 Algorithm
 Input Signal of ECG = O
 Compressed Signal of ECG = Y
 Reconstructed Signal of ECG = R
 Step1: Read an input ECG ‘O’ from MIT-BIH
 Step2: Duplicate it to make more data ‘Or’
 Step3: Improve some random noise to the ‘Or’ through a variance of 0.1 to get the ‘X’
 Step4: Now, apply DCA to the ‘X’ to get the Walsh hadamard coefficients by smaller number of
 computations
 Step5: Study only first 1024 coefficients out of 4096, which has utmost of the signal energy also
 supply it in ‘Y’
 Step6: Now, rebuild the ECG using ‘Y’ by applying inverse DCA
 Step7: In conclusion, comparation the ‘O’ also ‘R’ to perceive the density of ECG information in
 which the storing memory has been summary from 32,678 bytes - 8200 bytes.

4. Experimental Results
 This part manages the test investigation of planned DCA calculation to pack the ECG indication
information which have been complete in MATLAB climate. MATLAB is a general specialized
registering language that is utilized to create signal handling calculations. It has numerous benefits over
traditional programming dialects like JAVA, COBALT, C, VHDL, C++, FORTAN also VERILOG. We
have careful MIT-BIH ECG information base for challenging the planned calculation. Unique. ECG

 4
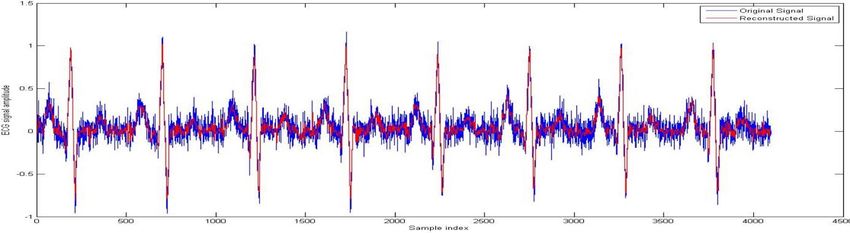
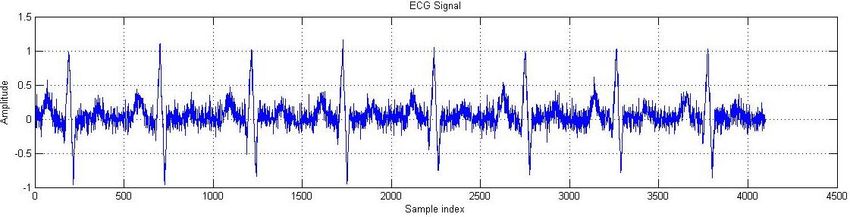
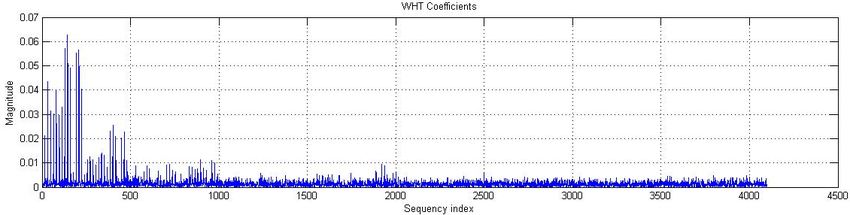
ICACSE 2020 IOP Publishing
Journal of Physics: Conference Series 1964 (2021) 062038 doi:10.1088/1742-6596/1964/6/062038

indication information has been appeared in Figure 3. Yield of DCA conspire has been appeared in
Figure 4, where the vast majority of the sign energy has been sequenced in coefficients under 1100. The
Figure 5 it has shown that the remade signal contrasted and the first sign in the wake of applying
backwards DCA plot by thinking about just 1024 coefficients, which demonstrates that the sign will be
packed very nearly multiple times to the first ECG indication information that implies the pressure
proportion is 4:1.

 Figure3. The Waveform of Input ECG

 Figure 4: Coefficients afterwards spread on DCA

 Figure5. Evaluation of original also reconstructed signal with DCA

 Variable Name Bytes
 Y 8200
 X 32768

 5
ICACSE 2020 IOP Publishing
Journal of Physics: Conference Series 1964 (2021) 062038 doi:10.1088/1742-6596/1964/6/062038

5. Conclusion
 An efficient scheme for compression electro cardiac signal information has been implemented with
compact number of computations using DCA system. Proposed system achieved outstanding simulation
outcomes concluded conventional compression system in terms of storing in number of bytes.

References
[1] https://en.wikipedia.org/wiki/Electrocardiography
[2] Bachu, S., Shalini, T., & Kumar, N. U. (2021, March). DCAECSCS: Divide and Conquer
 Algorithm Based Electro Cardiac Signal Compression Scheme. In IOP Conference Series:
 Materials Science and Engineering (Vol. 1084, No. 1, p. 012008). IOP Publishing.
[3] Fang, X., Zhang, W., Li, J., Lin, C., Chen, Z., Zhang, M., ... & Qiu, X. (2021). Signal processing
 assisted Vernier effect in a single interferometer for sensitivity magnification. Optics Express,
 29(8), 11570-11581.
[4] Katritsis, D. G., & Morady, F. (2021). Clinical Cardiac Electrophysiology-E-Book: A Practical
 Guide. Elsevier.
[5] Laudato, G., Picariello, F., Scalabrino, S., Tudosa, I., De Vito, L., & Oliveto, R. (2021).
 Morphological Classification of Heartbeats in Compressed ECG.
[6] Katritsis, D. G., & Morady, F. (2021). Clinical Cardiac Electrophysiology-E-Book: A Practical
 Guide. Elsevier.
[7] Bakiya, A., Kamalanand, K., & De Britto, R. L. J. (2021). Mechano-Electric Correlations in the
 Human Physiological System. CRC Press.
[8] Adarsh, A., Pathak, S., & Kumar, B. Design and Analysis of a Reliable, Prioritized and Cognitive
 Radio-Controlled Telemedicine Network Architecture for Internet of Healthcare Things.
[9] Al Mahadi, H. M., Yuanhao, W., Bowen, C. R., & Yang, Y. (2021). 2D Nanomaterials for
 Effective Energy Scavenging. Nano-Micro Letters, 13(1).
[10] Marks, P. (2021). Deep learning speeds MRI scans. Communications of the ACM, 64(4), 12-14.
[11] Jyothi, P., & Pradeepini, G. (2021). Review on Cardiac Arrhythmia Through Segmentation
 Approaches in Deep Learning. In International Conference on Intelligent and Smart Computing
 in Data Analytics: ISCDA 2020 (pp. 139-147). Springer Singapore.
[12] Natsuko Kodama, M. D., Yoko Yoshida, M. D., Kae Nakamura, M. D., Mitsuhiro Fujino, M. D.,
 Eiji Ehara, M. D., & Yosuke Murakami, M. D. (2021). Characteristic CMR T2-Weighted Image
 in Early Phase of Arrhythmogenic Right Ventricular Cardiomyopathy: A Case Report. Journal of
 Pediatric Cardiology and Cardiac Surgery, 5(1), 38-40.
[13] Ishaque, S., Khan, N., & Krishnan, S. (2021). Trends in Heart-Rate Variability Signal Analysis.
 Frontiers in Digital Health, 3, 13.
[14] Dhande, S. LABVIEW BASED ECG SIGNAL ACQUISITION AND ANALYSIS..
[15] Romero, F. P., Piñol, D. C., & Seisdedos, C. R. V. (2021). DeepFilter: an ECG baseline wander
 removal filter using deep learning techniques. arXiv preprint arXiv:2101.03423.

 6
You can also read