A recent paper on trends in harbour porpoises in the North Sea
←
→
Page content transcription
If your browser does not render page correctly, please read the page content below

A recent paper on trends in harbour porpoises in the
North Sea
Nachtsheim et al. 2021 Small cetacean in a human high-use area:
Trends in harbor porpoise abundance in the North Sea over two
decades. FMARS doi: 10.3389/fmars.2020.606609

 HELCOM OSPAR workshop 2021, 26. - 27.04.2021
Introduction

• Harbour porpoise (Phocoena phocoena): most common cetacean in North and Baltic Sea
• 1,50 - 1,80 m, solitary or small groups, maturity 3-5 years
• „living in the fast lane“ (Read & Hohn 1995)

• Protected under national and European legal frameworks (e.g. EU Habitats Directive)
-> obligation for monitoring of population size and trends!
In Germany: monitoring since 2002
• Observer-based surveys in North Sea + western Baltic (ITAW),
• PAM in eastern Baltic (DMM)

 © ITAW/Fjord & Baelt

27.04.2021 2
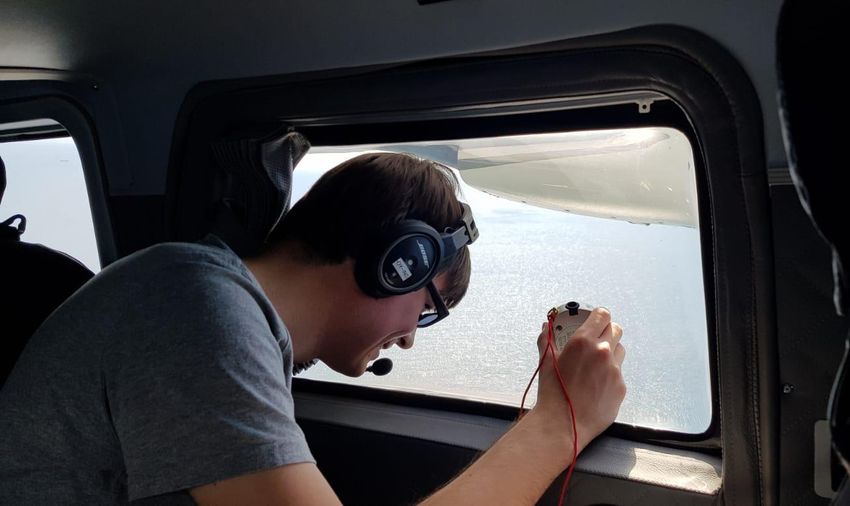
Line transect distance sampling

• distance sampling => estimation of wildlife population size (Buckland et al. 2001)
• Survey area covered by transect lines in a representative manner
• Partenavia 68 with „bubble windows“ ©ITAW

 • Altitude: 600 ft (183 m)
 • 90-100 kn (167-186 km/h)
• Correction for availability and perception bias through racetracks
 α

 600 ft (183 m)
• -> absolute density and abundance

 sighting 1 porpoise

 resighting porpoise after circling
 x

Line transect distance sampling

 ©ITAW-AW, Photo by Carolin Philipp

27.04.2021
German national monitoring: Survey areas

 2002-2016 2017-today

 New survey areas and transect design in an effort to harmonise the marine vertebrate monitoring
 (seabirds and marine mammals)

27.04.2021
German national monitoring

• Almost 20 years of data collection
• Allows comprehensive analyses, e.g. spatio-temporal / seasonal
 distribution, trend assessments, national/international reporting, effects
 of anthropogenic structures, habitat modelling, etc.
 (e.g. Gilles et al. 2009, 2011, 2016, Peschko et al. 2016)

• High variability of point estimates and uncertainty around
• -> Trend analysis should deal with this uncertainty and propagate it into
 final trend estimate
• -> Bayesian trend analysis of harbour porpoise abundance in the
 German North Sea (Nachtsheim et al. 2021)

27.04.2021
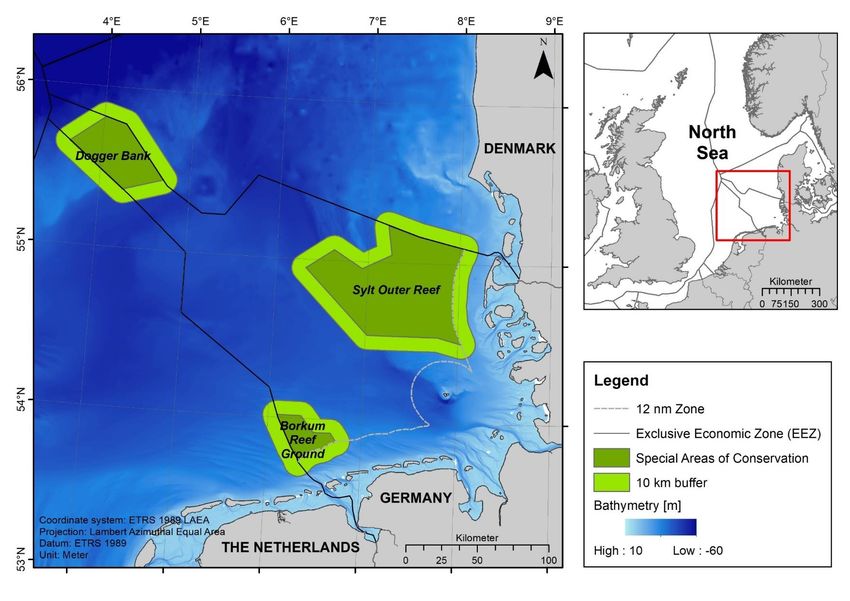
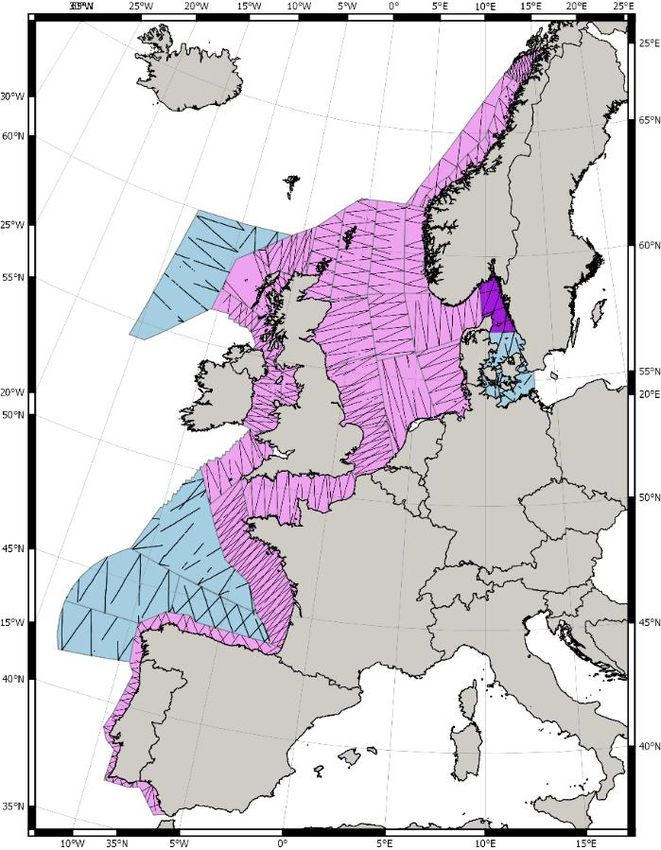
Study area

 Nachtsheim et al. 2021

27.04.2021
Bayesian trend analysis on harbour porpoise abundance

Steps in Bayesian trend analysis
• Aggregate data for each season and year
• Select your area(s) of interest (e.g. survey blocks or SACs), may requires post-stratification
• Run stratum-based abundance estimation
• Create list of a priori values, upper and lower limits
• MCMC (Monte Carlo Markov Chains) sampling of the posterior predictive distribution (agTrend, Johnson & Fritz 2014)
• -> Estimation of ‘true’ abundances and trends in abundance

• Advantages:
 a) Reliable estimates of the most probable trend (takes into account the uncertainty around the original abundance
 estimates and propagates error)
 b) Spatial and temporal scales can be chosen easily
 c) Results easy to understand (-> Management)

 27.04.2021

Bayesian trend analysis on harbour porpoise abundance MCMC chains – 10,000 iterations (i.e. values) for each year Input: stratum-based abundance estimates for a given stratum and season, plus associated observation errors (SE of 95% CI) (a priori) MCMC simulates 10,000 abundances for each year based on our input Output: 10,000 abundance values for every year (a posteriori) calculate distribution parameters (mean, median) and 95% credible intervals of these ‘true’ abundances 27.04.2021
Sylt Outer Reef, Summer, 2002-2019

 Stratum-based abundance
 + 95% CI

 Median of posteriori distribution

 Nachtsheim et al. 2021

27.04.2021
Bayesian trend analysis on harbour porpoise abundance

Identify relative change in abundance between two points in time (a, b)

 a
• Linear model to identify relative change in
 abundance (relative trend) between two
 points in time

 = + , ∙

• N: posterior distribution of abundances in
 year a and b
• ma,b: coefficient of linear model
• -> relative trend between year a and b
 (10,000 estimates) b

 27.04.2021
Probability that trend negative (95%) Probability that trend positive (5%)

 SAC Sylt Outer Reef
 (DE 1209-301)
 Summer (2002-2019)

 Distribution of relative trend estimates

 Trend:
 -3,79% per year
 (95% CI: -5,16% - +0.03%)

 Nachtsheim et al. 2021
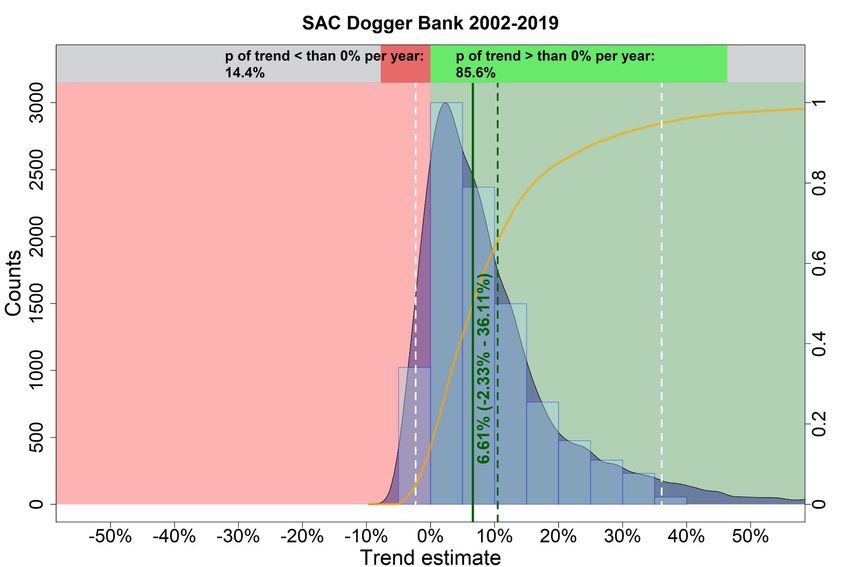
SAC Dogger Bank in summer

 Summer (2002-2019)
 SAC Doggerbank

 Nachtsheim et al. 2021
Southern German Bight in Spring

 West (F) East (E)

27.04.2021
Southern German Bight in Spring, 2002-2019
 West (F)

 East (E)

27.04.2021
North Sea, full surveys summer, 2002-2019

 2002-2015 (Sommer)
 Ohne Entenschnabel!

 Nachtsheim et al. 2021

27.04.2021
North Sea, full surveys summer, 2002-2019

2002-2019 (Sommer)
Excl. Dogger Bank

 Trend:
 -1,79% p.a.
 (-3,15% – -0,01%)

 Nachtsheim et al. 2021
27.04.2021
SCANS surveys - Small cetacean abundance European Atlantic SCANS 1994 SCANS II 2005 SCANS III 2016 © SCANS III © Ana Cañdas © Monica Arso © Ben Burville SCANS III funded by 9 countries; UK, NO, SE, DK, GE, NL, FR, ES & PO 2 aircraft 3 aircraft 7 aircraft 9 ships 7 ships 3 ships 27.04.2021
Southward shift of harbour porpoise distribution

 Hammond et al. 2002, 2013, 2017
 SCANS 1994 SCANS II 2005 SCANS III 2016
27.04.2021
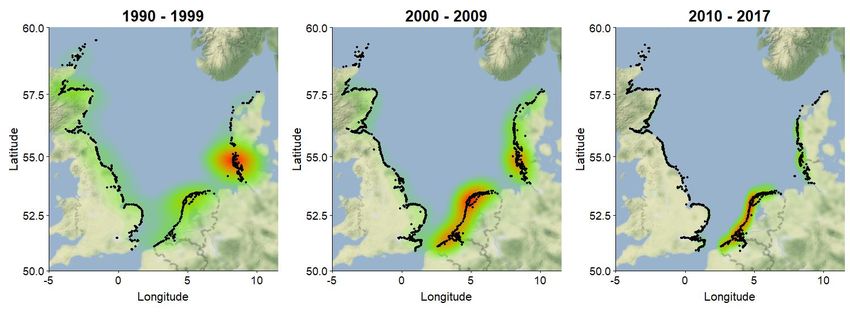
Stranding network in the North Sea UK, DK, GE, NL, BE 1990-2017 Strandings 1990-2017, n=16,181 Suggestions for further research: Neonates 1. Assessment of cause of death to evaluate impact of stressors calving 2. Collaboration across borders is vital areas 3. Stranding networks can inform about population structure and demography Juvenile males less optimal areas, potential population sink IJsseldijk & ten Doeschate et al. 2020 27.04.2021
Age – sex structure of female harbour porpoises in German waters 25 years of pathological Samples 1990-2016 (n=526 females) investigations on harbour porpoises Age range: 0 - 22 years; Higher incidence of Sexual maturity with 4.95 years severe lesions, higher pollutant burden and Average age of death shorter life expectancy in Baltic Sea: 3.67 (± 0.30) years the North Sea than in North Sea: 5.7 (± 0.27) years areas with less human impacts, e.g. Arctic Do anthropogenic stressors in the environment impact the life expectancy and reproductive sucess? Kesselring et al. 2017 PLoS ONE 27.04.2021
Anthropogenic activities and stressors
 © ITAW
• Fishery
• Offshore constructions, seismic and military operations, sand
 and gravel mining
• Acoustic and chemical pollution
• Ship traffic
• Tourism
• Climate change

 Foto: Carsten Rehder/dpa

 © ships.lv
 © av/DOTI-Matthias-Ibeler

 27.04.2021
Research needs

 • Spatio-temporal habitat-based modelling to identify
 important predictors influencing distribution and changes
 therein
 • -> anthropogenic drivers must be included!

 • Population dynamic models can inform on consequences
 of (anthropogenic) disturbances on the population level

 • Cumulative impacts must be considered!

 © ITAW, Photo by Abbo van Neer

27.04.2021
Thank you for your attention!

27.04.2021 24
You can also read