A Screening Method Using Anomaly Detection on a Smartphone for Patients With Carpal Tunnel Syndrome: Diagnostic Case-Control Study - XSL FO
←
→
Page content transcription
If your browser does not render page correctly, please read the page content below
JMIR MHEALTH AND UHEALTH                                                                                                                Koyama et al

     Original Paper

     A Screening Method Using Anomaly Detection on a Smartphone
     for Patients With Carpal Tunnel Syndrome: Diagnostic
     Case-Control Study

     Takafumi Koyama1, MD; Shusuke Sato2, BEng; Madoka Toriumi2, MEng; Takuro Watanabe2, MEng; Akimoto
     Nimura3, MD, PhD; Atsushi Okawa1, MD, PhD; Yuta Sugiura2, PhD; Koji Fujita3, MD, PhD
     1
      Department of Orthopedic and Spinal Surgery, Graduate School of Medical and Dental Sciences, Tokyo Medical and Dental University, Tokyo, Japan
     2
      School of Science for Open and Environmental Systems, Graduate School of Science and Technology, Keio University, Kanagawa, Japan
     3
      Department of Functional Joint Anatomy, Graduate School of Medical and Dental Sciences, Tokyo Medical and Dental University, Tokyo, Japan

     Corresponding Author:
     Koji Fujita, MD, PhD
     Department of Functional Joint Anatomy
     Graduate School of Medical and Dental Sciences
     Tokyo Medical and Dental University
     1-5-45, Yushima, Bunkyo-ku
     Tokyo, 1138519
     Japan
     Phone: 81 3 5803 5279
     Email: fujiorth@tmd.ac.jp

     Abstract
     Background: Carpal tunnel syndrome (CTS) is a medical condition caused by compression of the median nerve in the carpal
     tunnel due to aging or overuse of the hand. The symptoms include numbness of the fingers and atrophy of the thenar muscle.
     Thenar atrophy recovers slowly postoperatively; therefore, early diagnosis and surgery are important. While physical examinations
     and nerve conduction studies are used to diagnose CTS, problems with the diagnostic ability and equipment, respectively, exist.
     Despite research on a CTS-screening app that uses a tablet and machine learning, problems with the usage rate of tablets and data
     collection for machine learning remain.
     Objective: To make data collection for machine learning easier and more available, we developed a screening app for CTS
     using a smartphone and an anomaly detection algorithm, aiming to examine our system as a useful screening tool for CTS.
     Methods: In total, 36 participants were recruited, comprising 36 hands with CTS and 27 hands without CTS. Participants
     controlled the character in our app using their thumbs. We recorded the position of the thumbs and time; generated screening
     models that classified CTS and non-CTS using anomaly detection and an autoencoder; and calculated the sensitivity, specificity,
     and area under the curve (AUC).
     Results: Participants with and without CTS were classified with 94% sensitivity, 67% specificity, and an AUC of 0.86. When
     dividing the data by direction, the model with data in the same direction as the thumb opposition had the highest AUC of 0.99,
     92% sensitivity, and 100% specificity.
     Conclusions: Our app could reveal the difficulty of thumb opposition for patients with CTS and screen for CTS with high
     sensitivity and specificity. The app is highly accessible because of the use of smartphones and can be easily enhanced by anomaly
     detection.

     (JMIR Mhealth Uhealth 2021;9(3):e26320) doi: 10.2196/26320

     KEYWORDS
     carpal tunnel syndrome; anomaly detection; machine learning; smartphone; screening; thumb; diagnostic; data collection; app;
     algorithm

     https://mhealth.jmir.org/2021/3/e26320                                                           JMIR Mhealth Uhealth 2021 | vol. 9 | iss. 3 | e26320 | p. 1
                                                                                                                    (page number not for citation purposes)
XSL• FO
RenderX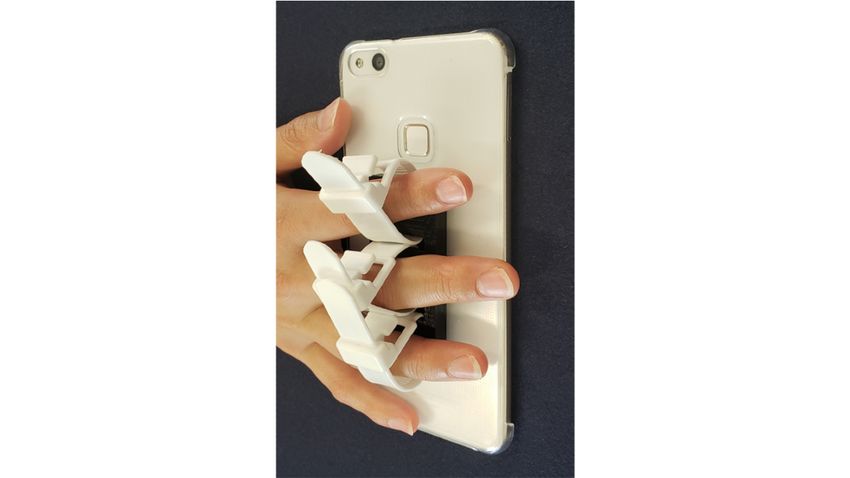
JMIR MHEALTH AND UHEALTH                                                                                                           Koyama et al

                                                                          machine learning; however, these are difficult to collect due to
     Introduction                                                         the low prevalence of CTS.
     Carpal tunnel syndrome (CTS) is a medical condition caused           To address these concerns, we developed a screening app for
     by compression of the median nerve in the carpal tunnel due to       CTS using a smartphone and an anomaly detection algorithm
     aging or hand overuse [1]. Patients with CTS develop numbness        [22] because the usage rate of smartphones is higher than that
     from the thumb to the ring finger and, in severe cases, thenar       of tablets [20,21] and anomaly detection algorithms need only
     muscle atrophy [2]. Because the symptoms impair thumb                easily collected data sets of healthy controls. We aimed to
     motions, CTS can impede everyday movements, such as holding          examine whether our system was a useful screening tool for
     a pen or chopsticks and handling buttons on clothes [3,4]. The       CTS.
     prevalence of CTS is approximately 2% to 14%, and it affects
     more women than men [5,6]. Since most patients with CTS are          Methods
     aged 40 years or older [5,6] and the number of older people is
     increasing worldwide, the number of patients with CTS is             Recruitment
     expected to increase. Nonsurgical therapy, such as a wrist brace     This study was approved by the Institutional Review Board of
     [7] or steroid injection into the carpal tunnel [8], is typically    Tokyo Medical and Dental University. Written informed consent
     prescribed, but surgery is often necessary for severe symptoms       was provided by all participants.
     [2]. Patients often delay seeking medical attention until the
     numbness worsens and thenar atrophy develops. The symptoms           We recruited 21 preoperative patients (36 hands) with CTS at
     in severe cases recover slowly postoperatively [9,10]; therefore,    the Tokyo Medical and Dental University Hospital as the CTS
     early diagnosis of CTS and surgery before the symptoms worsen        group and 15 healthy volunteers (27 hands) at an osteopathic
     is important.                                                        clinic as the non-CTS group from July 2018 to May 2019.
                                                                          Experienced hand surgeons diagnosed CTS based on symptoms,
     Physical findings, such as the Tinel sign or Phalen test, may be     physical findings such as the Tinel sign and Phalen test, x-ray
     used; however, their sensitivity and specificity are not high        images of the hands, and NCSs measured by Neuropack X1
     [11,12]. Although a nerve conduction study (NCS) is considered       (Nihon Kohden). Patients were classified based on the Bland
     useful for diagnosing CTS [13,14], the equipment is expensive        classification [23]. Patients with a history of other hand injury
     and the process can be painful and long (up to an hour). In          or surgery, recurrence after release surgery of the carpal tunnel,
     addition, a skilled technician must perform the detailed NCS         positive imaging findings indicative of first carpometacarpal or
     [15]. Due to impaired access to NCSs, diagnosis is largely           thumb metacarpophalangeal osteoarthritis (which could affect
     performed subjectively by doctors in clinics and small hospitals     thumb motion), or suspicion of a disease of the cervical spine
     in which there are neither hand surgeons nor specialized             were excluded. In the non-CTS group, volunteers were excluded
     equipment, contributing to delayed diagnosis.                        if they had a history of wrist, hand, or finger disease, injury, or
     In recent years, cameras and sensors in mobile devices have          surgery; finger numbness; thumb pain; or positive physical
     become smaller and more sophisticated and can now measure            findings of CTS.
     the state of the user. Various studies have been conducted on
                                                                          App Design
     the use of mobile devices to acquire physical information and
     diagnose diseases [16-18]. Fujita et al [19] developed an app        We used a Huawei P10 Lite (Huawei Technologies) phone and
     for screening CTS with an accuracy of 83% using a tablet and         developed the app using Unity software (Unity Technologies).
     support vector machine, utilizing a machine learning technique.      We also created a finger guide, which was attached to the back
     However, as patients with CTS are mainly aged 40 years and           of the smartphone to fix the position of the fingers other than
     older and the rate of use of tablets in this age group is not high   the thumb (Figure 1). The guide consisted of a component
     [20,21], the system may be difficult to introduce. Furthermore,      created with a 3D printer and 3 binding bands. The length of
     the machine learning for the binary classification used in the       the binding band could be adjusted to adapt to the participant’s
     aforementioned app needs 2 data sets, both from healthy controls     finger thickness.
     and from patients. Large data sets are needed to enhance

     https://mhealth.jmir.org/2021/3/e26320                                                      JMIR Mhealth Uhealth 2021 | vol. 9 | iss. 3 | e26320 | p. 2
                                                                                                               (page number not for citation purposes)
XSL• FO
RenderX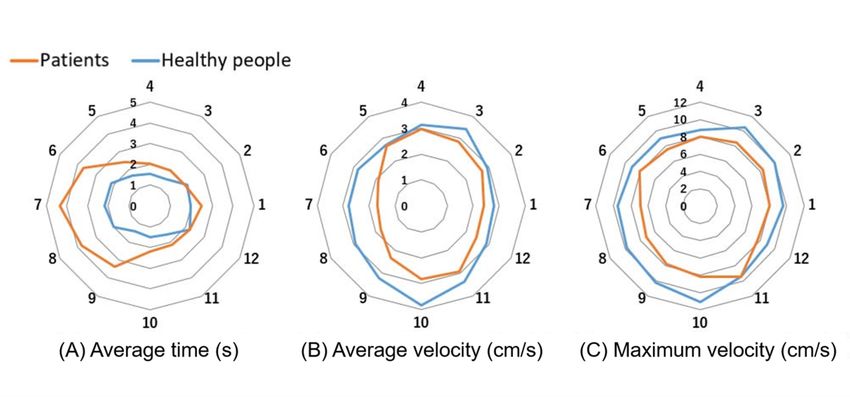
JMIR MHEALTH AND UHEALTH                                                                                                                      Koyama et al

     Figure 1. A finger guide attached to the back of the smartphone to fix the position of the fingers other than the thumb.

     In this app, the player controlled a rabbit character with their             not collected within 5 seconds, it disappeared and then
     thumb and collected vegetables (carrots, radishes, or eggplants)             reappeared at another place. In the practice phase, vegetables
     that appeared on the screen (screen A in Figure 2). When                     appeared randomly in 4 directions. Subsequently, in the
     vegetables were hidden by the thumb, broad markers that                      measurement phase, the game ended after 2 sequences of
     indicated the direction of the vegetable were also displayed.                vegetable appearances in 12 directions. The participants played
     The vegetables appeared sequentially in 12 directions along a                the game in the app twice. The position of the thumb and the
     circle with a 2-cm radius in a random order (screens B and C                 time were recorded, and the average time, average velocity, and
     in Figure 2). The vegetables appeared alternatively in one of 12             maximum velocity of the thumb movement for the 12 directions
     directions and at the center, and the user collected them in each            were calculated.
     direction and in the center in turn (Figure 3). If a vegetable was
     Figure 2. The images of the app. A rabbit character and vegetables were displayed in the green circle. Vegetables were located at the center or edge
     of the circle, and markers were also displayed when the vegetables were located at the edge (A). Vegetables appeared in 12 numbered directions, and
     the numbers were reversed depending on whether the player used the left (B) or right (C) hand.

     https://mhealth.jmir.org/2021/3/e26320                                                                 JMIR Mhealth Uhealth 2021 | vol. 9 | iss. 3 | e26320 | p. 3
                                                                                                                          (page number not for citation purposes)
XSL• FO
RenderX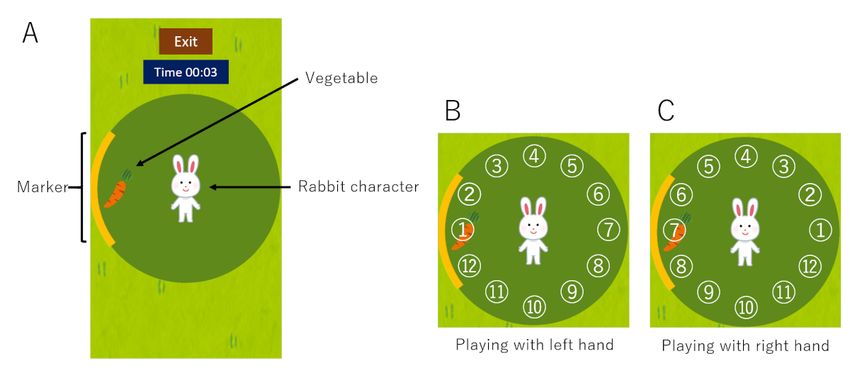
JMIR MHEALTH AND UHEALTH Koyama et al
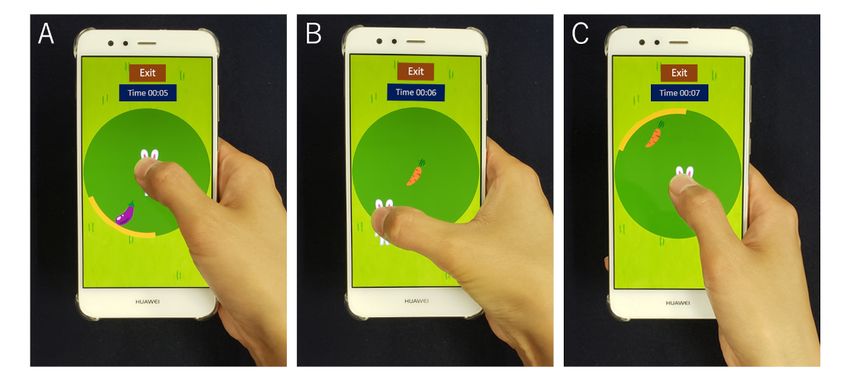
Figure 3. The images of the app while playing the game. The player touched and controlled a rabbit character with the thumb of each hand to collect
vegetables. Vegetables appeared in one of 12 directions (A). When each vegetable was collected, the next appeared alternately at the center of the circle
(B) or in another direction (C).
detection and an autoencoder (AE) [24,25]. Anomaly detection
Statistical Analysis is the process of identifying data that differ from the norm in a
We used 2-tailed Student t tests to compare the age of data set. It has the advantage that it can be learned from normal
participants, average time, average velocity, and maximum group data only. The AE is a type of neural network with a
velocity of the thumb movement for the 12 directions between 3-layer structure consisting of input, hidden, and output layers
the non-CTS and CTS groups. Chi-square tests were used to (Figure 4). The transformation of the input layer to the hidden
compare sex, playing side of the hand, and hand dominance layer is the encoder, and the attempted reconstruction of the
between the non-CTS and CTS groups. A P value below .05 hidden layer to the output layer constitutes the decoder. The
was considered to indicate statistical significance. AE performs unsupervised learning and is trained to reconstruct
To generate a screening model that classified participants as the input patterns. By reducing the number of units in a hidden
CTS and non-CTS, we analyzed data sets using anomaly layer compared with the number of units in the input layer, it
enables dimensional compression.
Figure 4. An image demonstrating how the autoencoder works. In our model, the input layer was 600 dimensions, the intermediate layer was 10
dimensions, and the output layer was 600 dimensions.
First, we calculated the distance to the center of the screen from second-lap data were used for the analysis. Next, a grayscale
the coordinate data and converted this into a value from 0 to 1. image was generated by arranging the pixel values with the
In our proposed model, the first lap was only played as practice vertical axis set as each direction and the horizontal axis set as
for the participants to get used to the app, and only the time (Figure 5). The horizontal axis consisted of 5 seconds,
https://mhealth.jmir.org/2021/3/e26320 JMIR Mhealth Uhealth 2021 | vol. 9 | iss. 3 | e26320 | p. 4
(page number not for citation purposes)
XSL• FO
RenderX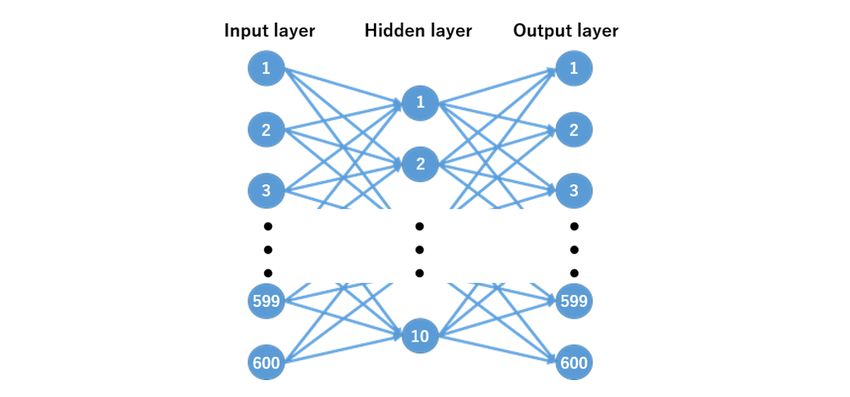
JMIR MHEALTH AND UHEALTH                                                                                                                        Koyama et al

     which is equal to 50 frames because the sampling rate was 10                  the 600 pixels of the grayscale image were used as the input
     Hz. Hence, the pixel count of the grayscale image was 600                     layer, the intermediate layer was fixed at 10 dimensions, and
     pixels (12 directions × 50 frames). Finally, we validated the                 the output layer was set to 600 dimensions (Figure 4).
     classification of non-CTS and CTS using the AE. For the AE,
     Figure 5. Grayscale image generated by the pixel values with the vertical axis set as each direction and the horizontal axis set as time. The intensity
     of the pixel was defined by the distance between the thumb and the center; the greater the distance, the lighter the intensity. Pixels of the frames when
     the thumb reached the circumference (vegetables) were white, and all pixels to the right of the frames were set to be filled with black. The vertical axis
     was set as 12 directions and the horizontal axis was set at a fixed time (50 frames).

     We used the data from 12 hands in the non-CTS group for the                   index was at its maximum in the ROC curve. Furthermore, to
     training of the AE and validated them with the data from the                  investigate which directional movements contribute to the
     36 hands in the CTS group and 15 hands in the non-CTS group                   diagnosis of CTS, we also generated modified screening models
     that were not used for the training. The reconstruction error of              that classified CTS and non-CTS using data from only 4
     the AE was calculated using the mean square error of the                      consecutive directions of the 12 directions and calculated the
     difference between the input and output. By training the AE on                AUC in the same way as above.
     non-CTS data only, we could detect patients with CTS because
     the reconstruction error was smaller for non-CTS data and larger              Results
     for CTS data. We generated a receiver operating characteristic
     (ROC) curve by adjusting the cutoff value of the mean square                  The characteristics of the participants are summarized in Table
     error and calculated the area under the curve (AUC). The                      1. There was no significant difference between the groups in
     optimal cutoff value was set at the point where the Youden                    terms of age, sex, or side of the playing hand.

     https://mhealth.jmir.org/2021/3/e26320                                                                   JMIR Mhealth Uhealth 2021 | vol. 9 | iss. 3 | e26320 | p. 5
                                                                                                                            (page number not for citation purposes)
XSL• FO
RenderX
JMIR MHEALTH AND UHEALTH Koyama et al
Table 1. Characteristics of participants in the CTS and non-CTS groups.
Characteristic Non-CTSa CTS P value
Participants, n 15 21 N/Ab
Age (years), mean (SD) 63.5 (17.6) 64.3 (12.2) .87
Sex (female), n 12 16 .63
Hand dominance (right), n 15 21 >.99
Hands, n 27 36 N/A
Side (right), n 15 17 .69
Bland classification, n N/A
Grade 1 N/A 5
Grade 2 N/A 6
Grade 3 N/A 15
Grade 4 N/A 0
Grade 5 N/A 9
Grade 6 N/A 1
a
CTS: carpal tunnel syndrome.
b
N/A: not applicable.
Figure 6 shows the average time taken to collect vegetables and longer to collect the vegetable in directions 6 to 9, and both the
the average and maximum velocities in each direction. average and maximum velocities of the patients were
Compared with healthy people, the patients took significantly significantly slower in all directions.
Figure 6. Representation of the average time taken to collect vegetables (A) and the average (B) and maximum (C) velocities in each direction.
The results of the screening model are shown in Table 2. The sensitivity and 67% specificity. The ROC curve of the
participants with and without CTS were classified with 94% classification model is shown in Figure 7; the AUC was 0.86.
https://mhealth.jmir.org/2021/3/e26320 JMIR Mhealth Uhealth 2021 | vol. 9 | iss. 3 | e26320 | p. 6
(page number not for citation purposes)
XSL• FO
RenderXJMIR MHEALTH AND UHEALTH Koyama et al
Table 2. The result of the screening model. People with and without CTS were classified with 94% sensitivity and 67% specificity.
True label Predicted label, n
Non-CTSa CTS
Non-CTS 10 5
CTS 2 34
a
CTS: carpal tunnel syndrome.
Figure 7. ROC curve of the screening model. The area under the ROC curve was 0.86. The black point indicates the optimal cutoff value, and the
sensitivity and specificity at that point were 0.94 and 0.67, respectively. ROC: receiver operating characteristic.
The results of the modified screening models are shown in Table AUC of 0.99 and could classify patients as CTS and non-CTS
3. The model using data from directions 8 to 11 had the highest with 92% sensitivity and 100% specificity.
Table 3. The index of the modified screening models.
Directiona Sensitivity, % Specificity, % AUCb
1-4 78 73 0.85
2-5 89 93 0.96
3-6 83 80 0.87
4-7 100 87 0.92
5-8 94 73 0.86
6-9 89 80 0.86
7-10 86 87 0.92
8-11 92 100 0.99
9-12 92 100 0.98
10-1 92 87 0.94
11-2 92 80 0.86
12-3 73 73 0.79
a
Directions are based on screens B and C of Figure 2.
b
AUC: area under the curve.
https://mhealth.jmir.org/2021/3/e26320 JMIR Mhealth Uhealth 2021 | vol. 9 | iss. 3 | e26320 | p. 7
(page number not for citation purposes)
XSL• FO
RenderXJMIR MHEALTH AND UHEALTH Koyama et al
techniques are the most common approaches to anomaly
Discussion detection, data sets often lack sufficient labeled anomalies. In
Principal Results such cases, unsupervised anomaly detection using statistical
and machine learning is more promising. The binary
In this study, we developed a smartphone app with a high ability classification used in the previous study requires 2 data sets,
to screen for CTS. The app could diagnose CTS with 94% one from healthy people and one from patients. In contrast,
sensitivity and 67% specificity and was almost equal to a tablet anomaly detection algorithms require only data sets of healthy
app in a previous study, which diagnosed CTS with 93% people. In general, large data sets are required to enhance
sensitivity and 73% specificity [19]. The result was also as good machine learning. If our app is used widely, it will be easier to
as physical examinations; the Tinel sign showed 23% to 60% collect data sets from healthy people than patients with CTS.
sensitivity and 64% to 87% specificity, and the Phalen test Thus, our system can be enhanced easily in the future.
showed 51% to 91% sensitivity and 33% to 86% specificity in
previous studies [11,12]. As we could obtain the same diagnostic Limitations
ability as physical examinations without a direct medical This study has some limitations. First, the varied sizes of the
examination, the app would be useful for screening for CTS in participants’ hands were not considered. Healthy people with
telemedicine in the circumstances of COVID-19. small hands who struggled to reach each direction may have
In the modified screening models, the model using data from been misdiagnosed with CTS. Second, because smartphone
directions 8 to 11 had the highest AUC of 0.99 and could sizes vary, the level of difficulty depends on the model.
diagnose CTS with 92% sensitivity and 100% specificity; this Therefore, it is desirable to adjust the size of the circle in the
was better than the screening model that used data in all game before playing according to the size of each player's
directions. This result suggests that thumb movement from fingers and the smartphone. Third, we used an inexpensive
directions 8 to 11 is different between the CTS and non-CTS finger guide on the back of the smartphone to fix the hand. If
groups, contributing to the diagnosis of CTS. Reaching special equipment is required, few people will be able to use
directions 8 to 11 requires a movement similar to thumb our system. It would be better to use readily available
opposition, as in screen B of Figure 3, a movement that is equipment, such as fall prevention devices for smartphones,
impaired in people with CTS [3]. This difficulty with thumb instead. Fourth, while we obtained good results in this study,
opposition was apparent when using our system. there is still room for further improvement in machine learning.
In order to take advantage of anomaly detection, it is desirable
We used a similar app as in the previous study [19] but with 2 to collect more samples. Finally, our system diagnosed only the
novel aspects. First, our system used a smartphone instead of a presence of CTS. In future work, we will improve our system
tablet. The usage rate of smartphones in Japan is approximately by collecting more data sets to enable estimation of the severity
80% in people aged 40 years or older, higher than that of tablets of CTS.
(40%) [21]. Since we intend to use this app as a screening tool
for CTS, it should be accessible to many people. Therefore, it Conclusions
is important to use common equipment. Smartphones have been We developed an app for screening patients with CTS that
used in many medical studies because of their utility and revealed the difficulty of thumb opposition for patients with
universality [16]. Second, our system used anomaly detection CTS and could screen for CTS with high sensitivity and
algorithms (instead of a binary classification), which have been specificity. The app can be used by many people because it is
studied extensively in the detection of system failures in smartphone based, and the machine learning is easy to enhance
infrastructure and factories, malware detection, and computer using anomaly detection. In future work, we will enhance our
vision [22]. Anomaly detection algorithms are also used in system by collecting more data sets to enable estimation of the
medicine, such as medical images [25,26], electrocardiograms severity of CTS.
[27], and remote medicine [28,29]. Although classification
Acknowledgments
This research was supported by JST AIP-PRISM JPMJCR18Y2 and JST PRESTO JPMJPR17J4. The authors thank the staff and
patients at Sajima Osteopathic Hospital.
Conflicts of Interest
None declared.
References
1. Bongers F, Schellevis F, van den Bosch WJHM, van der Zee J. Carpal tunnel syndrome in general practice (1987 and 2001):
incidence and the role of occupational and non-occupational factors. Br J Gen Pract 2007 Jan;57(534):36-39 [FREE Full
text] [Medline: 17244422]
2. Padua L, Coraci D, Erra C, Pazzaglia C, Paolasso I, Loreti C, et al. Carpal tunnel syndrome: clinical features, diagnosis,
and management. Lancet Neurol 2016 Nov;15(12):1273-1284. [doi: 10.1016/S1474-4422(16)30231-9] [Medline: 27751557]
https://mhealth.jmir.org/2021/3/e26320 JMIR Mhealth Uhealth 2021 | vol. 9 | iss. 3 | e26320 | p. 8
(page number not for citation purposes)
XSL• FO
RenderXJMIR MHEALTH AND UHEALTH Koyama et al
3. Kuroiwa T, Fujita K, Nimura A, Miyamoto T, Sasaki T, Okawa A. A new method of measuring the thumb pronation and
palmar abduction angles during opposition movement using a three-axis gyroscope. J Orthop Surg Res 2018 Nov 16;13(1):288
[FREE Full text] [doi: 10.1186/s13018-018-0999-3] [Medline: 30445972]
4. Wipperman J, Goerl K. Carpal Tunnel Syndrome: Diagnosis and Management. Am Fam Physician 2016 Dec
15;94(12):993-999 [FREE Full text] [Medline: 28075090]
5. Atroshi I, Gummesson C, Johnsson R, Ornstein E, Ranstam J, Rosén I. Prevalence of carpal tunnel syndrome in a general
population. JAMA 1999 Jul 14;282(2):153-158. [doi: 10.1001/jama.282.2.153] [Medline: 10411196]
6. Bland JDP, Rudolfer SM. Clinical surveillance of carpal tunnel syndrome in two areas of the United Kingdom, 1991-2001.
J Neurol Neurosurg Psychiatry 2003 Dec;74(12):1674-1679 [FREE Full text] [doi: 10.1136/jnnp.74.12.1674] [Medline:
14638888]
7. Burke DT, Burke MM, Stewart GW, Cambré A. Splinting for carpal tunnel syndrome: in search of the optimal angle. Arch
Phys Med Rehabil 1994 Nov;75(11):1241-1244. [doi: 10.1016/0003-9993(94)90012-4] [Medline: 7979936]
8. Marshall S, Tardif G, Ashworth N. Local corticosteroid injection for carpal tunnel syndrome. Cochrane Database Syst Rev
2007 Apr 18;2:CD001554. [doi: 10.1002/14651858.CD001554.pub2] [Medline: 17443508]
9. Wintman BI, Winters SC, Gelberman RH, Katz JN. Carpal tunnel release. Correlations with preoperative symptomatology.
Clin Orthop Relat Res 1996 May;326:135-145. [Medline: 8620634]
10. Gong HS, Oh JH, Bin SW, Kim WS, Chung MS, Baek GH. Clinical features influencing the patient-based outcome after
carpal tunnel release. J Hand Surg Am 2008 Nov;33(9):1512-1517. [doi: 10.1016/j.jhsa.2008.05.020] [Medline: 18984332]
11. D'Arcy CA, McGee S. The rational clinical examination. Does this patient have carpal tunnel syndrome? JAMA 2000 Jun
21;283(23):3110-3117. [doi: 10.1001/jama.283.23.3110] [Medline: 10865306]
12. MacDermid JC, Wessel J. Clinical diagnosis of carpal tunnel syndrome: a systematic review. J Hand Ther 2004;17(2):309-319.
[doi: 10.1197/j.jht.2004.02.015] [Medline: 15162113]
13. Basiri K, Katirji B. Practical approach to electrodiagnosis of the carpal tunnel syndrome: A review. Adv Biomed Res
2015;4:50 [FREE Full text] [doi: 10.4103/2277-9175.151552] [Medline: 25802819]
14. Fowler JR, Cipolli W, Hanson T. A Comparison of Three Diagnostic Tests for Carpal Tunnel Syndrome Using Latent Class
Analysis. J Bone Joint Surg Am 2015 Dec 02;97(23):1958-1961. [doi: 10.2106/JBJS.O.00476] [Medline: 26631997]
15. Sonoo M, Menkes DL, Bland JD, Burke D. Nerve conduction studies and EMG in carpal tunnel syndrome: Do they add
value? Clin Neurophysiol Pract 2018;3:78-88 [FREE Full text] [doi: 10.1016/j.cnp.2018.02.005] [Medline: 30215013]
16. Ienaga N, Fujita K, Koyama T, Sasaki T, Sugiura Y, Saito H. Development and User Evaluation of a Smartphone-Based
System to Assess Range of Motion of Wrist Joint. J Hand Surg Glob Online 2020 Nov;2(6):339-342 [FREE Full text] [doi:
10.1016/j.jhsg.2020.09.004] [Medline: 33083772]
17. Asselborn T, Gargot T, Kidziński Ł, Johal W, Cohen D, Jolly C, et al. Automated human-level diagnosis of dysgraphia
using a consumer tablet. NPJ Digit Med 2018;1:42 [FREE Full text] [doi: 10.1038/s41746-018-0049-x] [Medline: 31304322]
18. Masaki K, Tateno H, Nomura A, Muto T, Suzuki S, Satake K, et al. A randomized controlled trial of a smoking cessation
smartphone application with a carbon monoxide checker. NPJ Digit Med 2020;3:35 [FREE Full text] [doi:
10.1038/s41746-020-0243-5] [Medline: 32195370]
19. Fujita K, Watanabe T, Kuroiwa T, Sasaki T, Nimura A, Sugiura Y. A Tablet-Based App for Carpal Tunnel Syndrome
Screening: Diagnostic Case-Control Study. JMIR Mhealth Uhealth 2019 Sep 13;7(9):e14172 [FREE Full text] [doi:
10.2196/14172] [Medline: 31586365]
20. Ministry of Internal Affairs and Communications. Inspection report about time of using media and activity for information
in 2020 [Japanese]. Japan Ministry of Internal Affairs and Communications. URL: https://www.soumu.go.jp/main_content/
000708016.pdf [accessed 2020-12-11]
21. Mobile fact sheet. Pew Research Center. 2019 Jun 12. URL: https://www.pewresearch.org/internet/fact-sheet/mobile/
[accessed 2020-12-11]
22. Chandola V, Banerjee A, Kumar V. Anomaly detection. ACM Comput Surv 2009 Jul;41(3):1-58. [doi:
10.1145/1541880.1541882]
23. Bland JD. A neurophysiological grading scale for carpal tunnel syndrome. Muscle Nerve 2000 Aug;23(8):1280-1283. [doi:
10.1002/1097-4598(200008)23:83.0.co;2-y] [Medline: 10918269]
24. Chalapathy R, Chawla S. Deep Learning for Anomaly Detection: A Survey. ArXiv. Preprint posted online January 23,
2019 2021 [FREE Full text]
25. Wei Q, Ren Y, Hou R, Shi B, Lo JY, Carin L. Anomaly detection for medical images based on a one-class classification.
2018 Presented at: SPIE Medical Imaging 2018: Computer-Aided Diagnosis; Feb 10-15, 2018; Houston, TX. [doi:
10.1117/12.2293408]
26. Schlegl T, Seeböck P, Waldstein SM, Langs G, Schmidt-Erfurth U. f-AnoGAN: Fast unsupervised anomaly detection with
generative adversarial networks. Med Image Anal 2019 May;54:30-44. [doi: 10.1016/j.media.2019.01.010] [Medline:
30831356]
27. Zhang CK, Chen YY, Yin A, Wang X. Anomaly detection in ECG based on trend symbolic aggregate approximation. Math
Biosci Eng 2019 Mar 12;16(4):2154-2167 [FREE Full text] [doi: 10.3934/mbe.2019105] [Medline: 31137204]
https://mhealth.jmir.org/2021/3/e26320 JMIR Mhealth Uhealth 2021 | vol. 9 | iss. 3 | e26320 | p. 9
(page number not for citation purposes)
XSL• FO
RenderXJMIR MHEALTH AND UHEALTH Koyama et al
28. Adler DA, Ben-Zeev D, Tseng VW, Kane JM, Brian R, Campbell AT, et al. Predicting Early Warning Signs of Psychotic
Relapse From Passive Sensing Data: An Approach Using Encoder-Decoder Neural Networks. JMIR Mhealth Uhealth 2020
Aug 31;8(8):e19962 [FREE Full text] [doi: 10.2196/19962] [Medline: 32865506]
29. Jalali N, Sahu KS, Oetomo A, Morita PP. Understanding User Behavior Through the Use of Unsupervised Anomaly
Detection: Proof of Concept Using Internet of Things Smart Home Thermostat Data for Improving Public Health Surveillance.
JMIR Mhealth Uhealth 2020 Nov 13;8(11):e21209 [FREE Full text] [doi: 10.2196/21209] [Medline: 33185562]
Abbreviations
AE: autoencoder
AUC: area under the curve
CTS: carpal tunnel syndrome
NCS: nerve conduction study
ROC: receiver operating characteristic
Edited by G Eysenbach; submitted 11.12.20; peer-reviewed by S Kriventsov, A Oetomo, N Jalali; comments to author 05.01.21; revised
version received 15.02.21; accepted 27.02.21; published 14.03.21
Please cite as:
Koyama T, Sato S, Toriumi M, Watanabe T, Nimura A, Okawa A, Sugiura Y, Fujita K
A Screening Method Using Anomaly Detection on a Smartphone for Patients With Carpal Tunnel Syndrome: Diagnostic Case-Control
Study
JMIR Mhealth Uhealth 2021;9(3):e26320
URL: https://mhealth.jmir.org/2021/3/e26320
doi: 10.2196/26320
PMID:
©Takafumi Koyama, Shusuke Sato, Madoka Toriumi, Takuro Watanabe, Akimoto Nimura, Atsushi Okawa, Yuta Sugiura, Koji
Fujita. Originally published in JMIR mHealth and uHealth (http://mhealth.jmir.org), 14.03.2021. This is an open-access article
distributed under the terms of the Creative Commons Attribution License (https://creativecommons.org/licenses/by/4.0/), which
permits unrestricted use, distribution, and reproduction in any medium, provided the original work, first published in JMIR
mHealth and uHealth, is properly cited. The complete bibliographic information, a link to the original publication on
http://mhealth.jmir.org/, as well as this copyright and license information must be included.
https://mhealth.jmir.org/2021/3/e26320 JMIR Mhealth Uhealth 2021 | vol. 9 | iss. 3 | e26320 | p. 10
(page number not for citation purposes)
XSL• FO
RenderXYou can also read