Deep Mars: CNN Classification of Mars Imagery for the PDS Imaging Atlas
←
→
Page content transcription
If your browser does not render page correctly, please read the page content below
Deep Mars: CNN Classification of Mars Imagery for the PDS Imaging Atlas
                                  Kiri L. Wagstaff1 , You Lu1 , Alice Stanboli1 ,
                            Kevin Grimes1 , Thamme Gowda1,2 , and Jordan Padams1
                                  1
                                    Jet Propulsion Laboratory, California Institute of Technology
                                            4800 Oak Grove Drive, Pasadena, CA 91109
                                                {firstname.lastname}@jpl.nasa.gov
                                2
                                  Information Sciences Institute, University of Southern California
                                      4676 Admiralty Way #1001, Marina Del Rey, CA 90292
                                                            tg@isi.edu

                           Abstract                                 et al. 2014). However, they tend to require thousands to mil-
  NASA has acquired more than 22 million images from the            lions of labeled examples if trained from scratch. A com-
  planet Mars. To help users find images of interest, we devel-     mon practical solution is to use transfer learning to adapt
  oped a content-based search capability for Mars rover surface     a previously trained network to a new problem. This “fine-
  images and Mars orbital images. We started with the AlexNet       tuning” approach enables practitioners to train networks for
  convolutional neural network, which was trained on Earth im-      new problems while leveraging the base level features al-
  ages, and used transfer learning to adapt the network for use     ready inferred by the original network. However, the lim-
  with Mars images. We report on our deployment of these clas-      its of such fine-tuning are not known, and we wondered
  sifiers within the PDS Imaging Atlas, a publicly accessible       whether a network that was trained on Earth images could
  web interface, to enable the first content-based image search     successfully be adapted to operate on images from another
  for NASA’s Mars images.
                                                                    planet.
                                                                       We tackled the problem of content-based image search
                       Introduction                                 for Mars images by adapting a typical Earth-image convo-
The ongoing exploration of Mars by orbiting spacecraft and          lutional neural network to classify the content in images
surface rovers has generated an enormous amount of data             of Mars. One network, MSLNet, classifies images taken by
that continues to grow on a daily basis. A large portion of the     the Mars Science Laboratory rover, and the other network,
acquired data consists of images, which are stored and made         HiRISENet, classifies regions within large images collected
available to the public by NASA’s Planetary Data System             from Mars orbit. Both networks achieved high performance
(PDS). The PDS currently contains more than 31 million              in validation and testing, and their predictions have now
images, of which 22 million are from the planet Mars.               been integrated into the PDS Imaging Atlas to enable the
   Connecting scientists and other users to images of interest      first public content-based image search capability for the
is a major challenge. The PDS Imaging Atlas allows users to         Planetary Data System.
search by mission, instrument, target, date, and other param-
eters that filter the set of images. Previously, the searchable                           Related Work
parameters were all values that were known a priori, i.e., be-      Automated image analysis has been used for decades to au-
fore the image was collected. However, users are often inter-       tomatically detect surface features such as craters (Urbach
ested in finding images based on content (e.g., “show me all        and Stepinski 2009) and dune fields (Bandeira et al. 2011)
images containing craters”), which is known only after ac-          in orbital images. More recently, the strong performance of
quisition and must be extracted through content analysis.           convolutional neural networks (CNNs) on image classifica-
   Content-based searches can help further both science and         tion tasks (Razavian et al. 2014), as well as their ability to
mission operations. In images collected by the Mars Science         infer useful features rather than hand-coding them, has led
Laboratory (MSL) rover, engineers are interested in analyz-         to their adoption in planetary science as well. For example,
ing all images that contain the rover’s wheels so that they         CNNs recently were shown to out-perform a support vector
can monitor wheel degradation over time. While some im-             machine classifier when detecting two Mars surface features
ages are purposely aimed at the wheels, and therefore can be        of interest (volcanic rootless cones and transverse aeolian
obtained due to knowledge about the intended target of the          ridges) in orbital images (Palafox et al. 2017). They have
image, in other cases the wheel is captured serendipitously         also been applied to Mars rover images of the surface to clas-
in an image that was targeted at a nearby rock or soil. Using       sify terrain and inform navigation (Rothrock et al. 2016).
content-based analysis to find all wheel images can greatly
increase the amount of relevant images for analysis.                          Deep Learning for Mars Images
   Convolutional neural networks have achieved high perfor-         We employed transfer learning to adapt the AlexNet im-
mance on a variety of image classification tasks (Razavian          age classifier (Krizhevsky, Sutskever, and Hinton 2012) to
Copyright c 2018, Association for the Advancement of Artificial     classify images from Mars. AlexNet was trained on 1.2 mil-
Intelligence (www.aaai.org). All rights reserved.                   lion (Earth) images from 1000 classes in the ImageNet data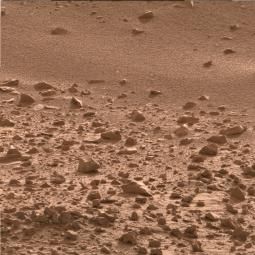
set. We adapted this network by removing the final fully
connected layer and re-defining the output classes, then re-
training the network with Caffe (Jia et al. 2014). We started
with Caffe’s BVLC reference model, which is a replication
of AlexNet that was trained for 310,000 iterations and pro-
(a) APXS (b) APXS CT (c) ChemCam CT vided by Jeff Donahue1 . Following Caffe’s recommenda-
tions for fine-tuning, we specified a small base learning rate
and stepsize (iterations between reductions in learning rate)
and a learning rate multiplier of 1 (how the rate is adjusted)
for all layers except the final layer, which was set higher.
Precise values are given below for each classifier.
We created two Mars data sets that contain images taken
(d) Chemin inlet (e) Drill (f) Drill hole from different perspectives: Mars rover images of the sur-
face and rover parts, and Mars orbital images of interest-
ing surface features. Each data set enabled the training of
a custom fine-tuned CNN that can provide classifications
of new images from the same instruments as they are col-
lected. The data and labels can be downloaded at https:
//landmarks.jpl.nasa.gov/software.shtml.
(g) DRT front (h) DRT side (i) Ground
MSL Surface Data Set
We created a data set of 6691 images of the Mars surface
environment that were collected by three instruments on the
MSL (Curiosity) rover: Mastcam Right eye, Mastcam Left
eye, and MAHLI (Mars Hand Lens Imager). These cameras
(j) Horizon (k) Inlet (l) MAHLI differ in their focal length (100 mm, 34 mm, and 18-21 mm
respectively) and resolution (150, 450, and 14 µm/pixel)),
and field of view (5 degrees, 15 degrees, and 34-39 degrees).
The data set is composed of fully calibrated RGB thumb-
nail (256x256 pixel) versions of each image. This is the im-
age size used by Krizhevsky, Sutskever, and Hinton to train
AlexNet and also sufficiently large to enable identification
(m) MAHLI CT (n) Mastcam (o) Mastcam CT of the classes of interest.
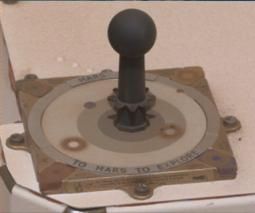
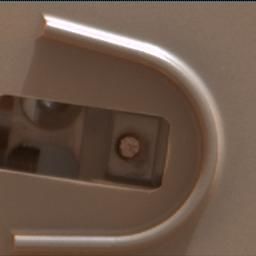
Twenty-four classes were identified by a Mars rover mis-
sion scientist. They include several instruments on the rover
(e.g., APXS, drill, DRT, MAHLI) and associated calibra-
tion targets (marked “CT”) as well as other rover parts (e.g.,
observation tray, inlet, scoop, wheel), plus two non-rover
(p) Observ. tray (q) Portion box (r) Portion tube
classes (ground and horizon). An example of each class
is shown in Figure 1. The classes are in some cases very
heterogeneous with objects imaged from different angles
and magnifications, different backgrounds and illumination,
multiple objects in the same image, objects that are out of
focus, etc. Some images are RGB, while others are single-
band (grayscale) or appear in other colors due to instrument
filters.
(s) P. tube op. (t) REMS-UV (u) Rear deck
HiRISE Orbital Data Set
Mars orbital images are collected in long strips as an in-
strument sweeps over the planet. For example, each im-
age collected by the HiRISE (High Resolution Imaging Sci-
ence Experiment) camera on the Mars Reconnaissance Or-
(v) Scoop (w) Turret (x) Wheel biter covers several square kilometers at a resolution of 30
cm/pixel. Rather than assigning labels on a per-image ba-
Figure 1: MSL (surface) image classes. “CT” indicates a cal- sis, it is more useful to identify interesting features within
ibration target. “P. tube op.” stands for “Portion tube open- 1
ing.” https://github.com/BVLC/caffe/tree/
master/models/bvlc_reference_caffenet
(a) Crater         (b) Bright dune        (c) Dark dune    (d) Dark slope streak     (e) Other             (f) Edge

                                            Figure 2: HiRISE (orbital) image classes.

                                                                    randomly presented until all images in the data set acquire
                                                                    labels, which are stored in an SQLite database and can be
                                                                    downloaded as a .csv file. Users who are unsure about the
                                                                    classification of a given image can click “Later” to skip it so
                                                                    that others can label the image (i.e., users are not forced to
                                                                    make a possibly unreliable guess).

                                                                                      Experimental Results
                                                                    We trained two classifiers to operate on different kinds of
                                                                    Mars images: (1) MSLNet: Mars surface images collected
                                                                    by the MSL rover and (2) HiRISENet: Mars orbital images
                                                                    collected by the Mars Reconnaissance Orbiter.

                                                                    MSLNet: Mars Rover Surface Images
                                                                    We divided the MSL images into train, validation, and test
                                                                    data sets according to their sol (Martian day) of acquisition.
     Figure 3: Supervising UI image labeling web tool.              This strategy is more appropriate than a random split since
                                                                    it models how the system will be used operationally with an
                                                                    image archive that grows over time. The images were col-
                                                                    lected from sols 3 to 1060 (August 2012 to July 2015); Ta-
each image and classify them. We employed dynamic land-
                                                                    ble 1 shows the division into train, validation, and test sets
marking (Wagstaff et al. 2012) to find visually salient
                                                                    by sol range. Because images are not collected with equal
“landmarks” within each HiRISE image and cropped out
                                                                    frequency by every instrument on every sol, the number of
a square bounding box around each landmark, plus a 30-
                                                                    examples in each of the data set varies.
pixel border, to create a data set for image classification.
                                                                       We fine-tuned the MSLNet classifier for 3000 iterations
Processing 168 map-projected HiRISE images yielded 3820
                                                                    with a base learning rate of 0.0001, stepsize 500, and final
grayscale landmark images, each of which we resized to
                                                                    layer learning rate multiplier 25. We compared the classi-
256x256 (Wagstaff and Lu 2017).
                                                                    fication accuracy of the trained model to that of random
   The classes of interest that we identified in these Mars or-     selection as well as a simple baseline that always predicts
bital images are craters, bright sand dunes, dark sand dunes,       the most common class observed in the training set, which
and dark slope streaks (see Figure 2). Landmarks that did not       was “ground” (see Table 2). MSLNet strongly outperformed
contain one of these features were labeled “other.” Because         both baselines. Interestingly, performance was lower on the
the landmarks were detected within map-projected HiRISE             test set than the validation set. The imbalanced class repre-
images, they also included many spurious detections of the          sentation as well as evolving mission practices in terms of
triangular black image border, which is very statistically          which items were imaged and with what instrument settings
salient. Therefore, we included an “edge” class in our la-
beled data to capture (and filter out) such images.
   We developed a web-based image labeling tool2 to facil-
itate the labeling of the thousands of images in this data           Table 1: MSL image data sets, by instrument and sol range.
set (see Figure 3). This Supervising UI server takes in a                                       Train      Val          Test
set of images and a list of class names and enables multi-                                      3–181    182–564      565–1060
ple users to simultaneously contribute labels to a given data          Mastcam Left (ML)        1491       189           202
set, thereby distributing the workload. Unlabeled images are           Mastcam Right (MR)       1935        94           373
                                                                       MAHLI (MH)                320      1357           730
  2
    https://github.com/USCDataScience/                                 Total num. images        3746      1640          1305
supervising-ui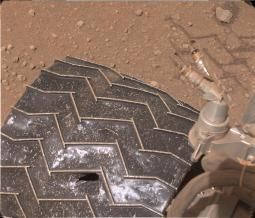
Table 2: Classification accuracy on MSL (rover) surface im-               Table 3: Classification accuracy on HiRISE (Mars orbital)
ages. The best performance on each data set is in bold.                   images. The best performance on each data set is in bold.
               Classifier                Train      Val           Test                                       Train            Val             Test
               Random                    4.2%      4.2%           4.2%      Classifier                    (n = 2734)       (n = 546)       (n = 540)
               Most common              62.5%      5.3%          19.5%      Random                          16.7%            16.7%           16.7%
               MSLNet                   98.7%     72.8%          66.7%      Most common                     51.8%            56.2%           54.4%
               MSLNet-inst              98.7%     83.7%          50.2%      HiRISENet                       99.1%            88.1%           90.6%

             1.00                                                                      1.00
                       Validation                                                                Validation
                       Test                                                                      Test
             0.95                                                                      0.98
             0.90
                                                                                       0.96

                                                                            Accuracy
             0.85
  Accuracy

                                                                                       0.94
             0.80
                                                                                       0.92
             0.75
             0.70                                                                      0.90

             0.650.0                                                                   0.880.0      0.2           0.4      0.6       0.8     1.0
                          0.2           0.4      0.6       0.8      1.0
                                    Confidence Threshold                                                      Confidence Threshold

Figure 4: MSL image classification accuracy as a function                 Figure 5: HiRISE image classification performance as a
of confidence threshold.                                                  function of confidence threshold.

are likely contributing factors. This result is evidence that it          HiRISENet: Mars Orbital Images
will be important to periodically update MSLNet by provid-                We split the HiRISE data set into train, validation, and test
ing a labeled sample of newly acquired images.                            sets by the HiRISE source image identifier, to ensure that
   The CNN provides a posterior probability for each predic-              landmark images from the same source image did not appear
tion that we employed to further increase the classifier’s op-            in more than one data set. We used 80% of the source images
erational accuracy. We specified a confidence threshold such              for training, 15% for validation, and 15% for testing.
that predictions with lower probabilities were omitted from                  We fine-tuned the HiRISENet classifier for 5300 itera-
the results. Figure 4 shows accuracy as a function of confi-              tions with a base learning rate of 0.0001, stepsize 20000,
dence threshold for the validation and test sets. Employing               and final layer learning rate multiplier 10. The results are
a confidence threshold of 0.9 elevates validation accuracy to             shown in Table 3, along with the performance expected for
94.3% and test accuracy to 84.0%. The fraction of absten-                 random predictions and the most-common baseline. In this
tions was 41% and 52% respectively. For this application,                 domain, the “other” class was the most commonly observed
users would prefer to have fewer results of higher quality                class in the training set. The HiRISENet classifier strongly
than more results with lower quality.                                     outperformed both baselines.
   We also experimented with training instrument-specific                    In comparison to the MSLNet results, performance on the
classifiers to see if they would perform better than a sin-               HiRISE data set was generally higher. The data sets were
gle generic MSL classifier. MSLNet-ML was trained using                   more balanced and representative, and the total number of
only images captured by the Mastcam Left eye camera, and                  classes (5 versus 24) was lower, so the task may be in-
the same strategy was employed to train MSLNet-MR and                     herently easier. Figure 5 shows classification accuracy as a
MSLNet-MH on their respective image data subsets. We                      function of confidence threshold (note change in y-axis scale
then evaluated classification accuracy of an ensemble model               compared to Figure 4). Applying a confidence threshold of
in which new images captured by a given instrument were                   0.9 yields a validation set accuracy of 90.3% (abstaining on
classified by the appropriate instrument’s model. The results             only 11% of the images) and a test set accuracy of 94.5%
appear in Table 2 under “MSL-inst”. We found that train-                  (abstaining on 13%).
ing accuracy was identical but that validation performance                   The most common errors in the test set were 19 images
increased significantly. However, performance on the test                 from the “other” class that HiRISENet classified as “edge”,
set instead went down. Again, the imbalanced class distri-                and 14 “bright dune” images that HiRISENet classified as
butions and evolving image characteristics likely influenced              “other.” These classes have significant conceptual overlap
the results.                                                              (e.g., how much of the black image edge must be present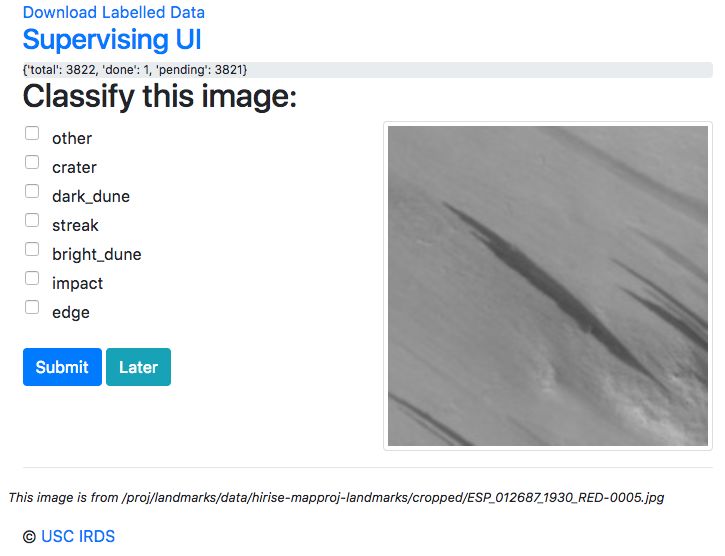
100
80
60
40
20
Recall
Precision
0 crater bright_dune dark_dune other edge
Class
Figure 6: HiRISE test set precision and recall for each class. Figure 7: PDS Imaging Atlas faceted search. Users can click
image classes (left panel) to obtain images that contain con-
tent of interest, or enter class names via free text search.
to label an otherwise featureless terrain as “edge” instead
of “other”?). Figure 6 shows the per-class precision and re-
call achieved on the test set. The “streak” class is not shown
as HiRISENet did not classify any test images into this
rare class (so precision is undefined). There are only two
streak images present in the test set; both were missed. Re-
call was highest (100%) for the “dark dune” class, while
precision was highest (100%) for the “bright dune” class.
The apparently low precision for “dark dune” occurred be-
cause HiRISENet incorrectly classified two “other” images
as “dark dune”; both predictions had low posterior probabil-
ities (0.48 and 0.70).
Deployment for the PDS Imaging Atlas
The goal of training Mars image surface and orbital classi-
fiers is to benefit scientists and members of the general pub-
lic who are interested in finding images that contain certain
types of features. Therefore, we integrated the classifier’s (a) MSL image class queries
predictions into the PDS Imaging Atlas3 , a publicly accessi-
ble search interface to NASA planetary images.
The PDS Imaging Node Atlas III provides faceted navi-
gation, an interactive style of browsing datasets that allows
users to progressively filter a set of items to those of most
interest. Faceted navigation has been utilized in the retail in-
dustry since the early 2000s (e.g., amazon.com and Google
Shopping). A facet is a distinct feature or aspect of a set of
objects (e.g., cost, size, style) or a way in which a resource
can be classified (e.g., content classification).
In the Atlas III, facets are defined by the most commonly
used search criteria for imaging datasets, including mission
name, instrument name, target, location meta-data (latitude,
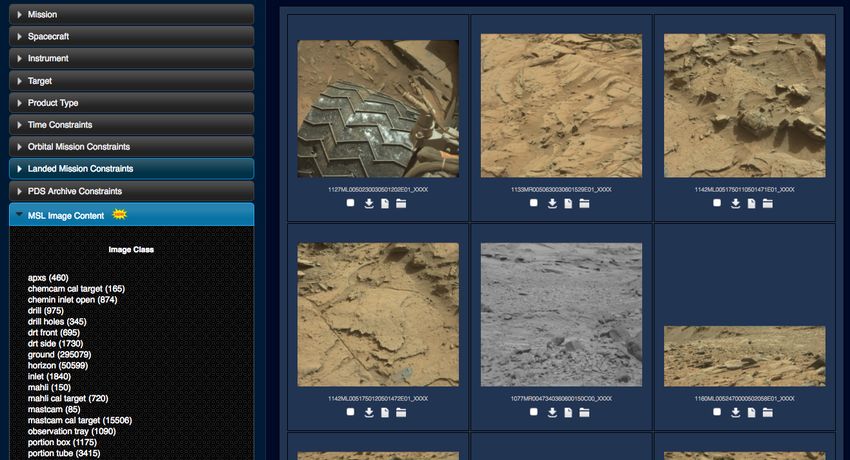
longitude), time constraints, etc. We have now added a new
facet for Image Class (see Figure 7). When the user specifies
a facet value, such as “Image Class” = “wheel”, the results
are filtered to contain only matching images, and the counts
associated with all remaining facet values are updated ac-
(b) HiRISE image class queries
cordingly. Older search systems required the user to guess
which constraint they should apply next to narrow down the
results; faceted search reduces the need for this kind of prior Figure 8: PDS Imaging Atlas queries for image classes be-
knowledge, which was a common user complaint. tween January and August 2017. Note: metrics were un-
3
available for April 2017.
https://pds-imaging.jpl.nasa.gov/search/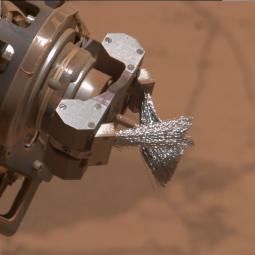
The Atlas also now provides free text search. A user can       those craters outlined with their bounding boxes. We expect
type “crater”, and the resulting crater images are displayed.     this visualization to increase the utility and interpretability
The search for crater is applied as both a facet-based query      of the classifier’s predictions.
and a free text search of the ingested label meta-data, or the
image class.                                                                         Acknowledgments
   We populated the Atlas database with classifications for       We thank Joy A. Crisp (JPL) for her assistance in identify-
the entire archive of MSL Mastcam, Navcam, and MAHLI              ing classes of interest in the MSL images and providing la-
images as well as all MRO HiRISE (calibrated) images. For         beled examples of each class. We thank Norbert Schörghofer
MSL, we stored classifications for 3.7 million images (omit-      (Planetary Science Institute / University of Hawaii) for se-
ting thumbnail images) and provided the user with a confi-        lecting relevant HiRISE images. We also thank the Plane-
dence threshold slider to filter as desired. For HiRISE, we       tary Data System (PDS) and the Multimission Ground Sys-
faced a different situation since the image classifications       tem and Services (MGSS) program for funding and enthu-
were of individual surface features within a larger image,        siastically supporting this work. This research was carried
not the entire image itself. In this setting, the number of de-   out at the Jet Propulsion Laboratory, California Institute of
tected landmarks of each class within each image is mean-         Technology, under a contract with the National Aeronau-
ingful. We generated a catalog of all HiRISE landmarks with       tics and Space Administration. Government sponsorship ac-
a posterior probability of at least 0.9 and provided the user     knowledged.
with a slider to specify the minimum number of landmarks
within each image. The high-confidence landmarks spanned                                  References
a total of 16,344 HiRISE images.
   We have compiled usage statistics by tracking Atlas            Bandeira, L.; Marques, J. S.; Sarav, J.; and Pina, P. 2011.
queries that contain search terms related to the MSLNet or        Automated detection of martian dune fields. IEEE Geo-
HiRISENet classes. As shown in Figure 8, we have seen in-         science and Remote Sensing Letters 8(4):626–630.
creasing usage since the beginning of 2017. The raw num-          Jia, Y.; Shelhamer, E.; Donahue, J.; Karayev, S.; Long, J.;
ber of queries is much higher for MSLNet classes than for         Girshick, R.; Guadarrama, S.; and Darrell, T. 2014. Caffe:
HiRISENet classes, which might be due to the richer set of        Convolutional architecture for fast feature embedding. arXiv
available classes, higher interest in rover part images in the    preprint arXiv:1408.5093.
user community, and/or our presentations to the MSL sci-          Krizhevsky, A.; Sutskever, I.; and Hinton, G. E. 2012.
ence team that directly advertised this capability.               Imagenet classification with deep convolutional neural net-
                                                                  works. In Pereira, F.; Burges, C. J. C.; Bottou, L.; and Wein-
            Conclusions and Next Steps                            berger, K. Q., eds., Advances in Neural Information Process-
In this work, we found that a convolutional neural network        ing Systems 25. Curran Associates, Inc. 1097–1105.
that was trained on Earth images can successfully be fine-        Palafox, L. F.; Hamilton, C. W.; Scheidt, S. P.; and Alvarez,
tuned to adapt to classify Mars images. The transfer learn-       A. M. 2017. Automated detection of geological landforms
ing process was successful despite significant differences in     on Mars using convolutional neural networks. Computers &
image properties, imaging conditions, and classes of inter-       Geosciences 101:48–56.
est. We deployed networks that were trained on surface and
                                                                  Razavian, A. S.; Azizpour, H.; Sullivan, J.; and Carlsson,
orbital images of Mars to the PDS Imaging Atlas to enable
                                                                  S. 2014. CNN features off-the-shelf: An astounding base-
the first content-based search of Mars images. Users have
                                                                  line for recognition. In Proceedings of the 2014 IEEE Con-
adopted this capability with enthusiasm as shown in the in-
                                                                  ference on Computer Vision and Pattern Recognition Work-
creasing number of content-based queries received by the
                                                                  shops, 512–519.
Atlas.
   An important lesson that came from our MSLNet experi-          Rothrock, B.; Kennedy, R.; Cunningham, C.; Papon, J.; Hev-
ments was that, for a mission that moves into new environ-        erly, M.; and Ono, M. 2016. Spoc: Deep learning-based ter-
ments and changes its imaging practices over time, periodic       rain classification for mars rover missions. In Proceedings
labeling of new data and updating of the trained classifier       of the AIAA SPACE Forum.
will be needed. HiRISE is in a fixed orbit and surveys the        Urbach, E. R., and Stepinski, T. 2009. Automatic detec-
entire planet, so the distribution of images over time does       tion of sub-km craters in high resolution planetary images.
not change the way MSL’s image distribution does.                 Planetary and Space Science 57:880–887.
   We are now in the process of integrating the classifiers       Wagstaff, K. L., and Lu, Y. 2017. Mars orbital im-
into the data ingestion pipeline for the Atlas. Each mission      age (HiRISE) labeled data set. https://doi.org/10.
delivers a batch of new images to the PDS on a regular            5281/zenodo.1048301.
schedule (e.g., every three months). We have classified the
                                                                  Wagstaff, K. L.; Panetta, J.; Ansar, A.; Greeley, R.; Hoffer,
entire archive of current images and will automate image
                                                                  M. P.; Bunte, M.; and Schorghofer, N. 2012. Dynamic land-
classification as new images arrive.
                                                                  marking for surface feature identification and change detec-
   We are currently developing an extension to the Atlas web
                                                                  tion. ACM Transactions on Intelligent Systems and Technol-
interface that will provide overlays for each HiRISE image
                                                                  ogy 3(3). Article number 49.
to show the location of each classified landmark. Rather than
seeing that a given image contains five craters, users will see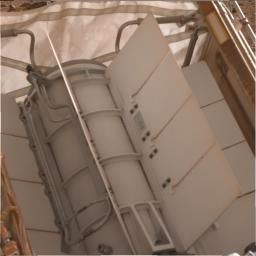
You can also read