A STUDY OF COVID-19 IN MAHARASHTRA (PART-1): The Policy Times
←
→
Page content transcription
If your browser does not render page correctly, please read the page content below
A STUDY OF COVID-19 IN MAHARASHTRA (PART-1):
Fitting An Arima Model For Its Forecast And Assessing
Maharashtra Government Response For Pre-Vaccine
Period.
Gaurav Suresh Gunnal 1
Mahir Raju Parekh 2
Komal Sureshrao Gajbhiye 3
Harshal Rohidas Pawar 4
1,2,3 and 4
MSc in Biostatistics and Demography, International Institute for Population Sciences
Abstract:
COVID-19 is an infectious disease with a catastrophic amount of unfortunate deaths and infected
individuals worldwide. The World Health Organization (WHO) on March 11, 2020, declared the
novel COVID-19 outbreak as a global pandemic affecting more than 200 countries. India is one of
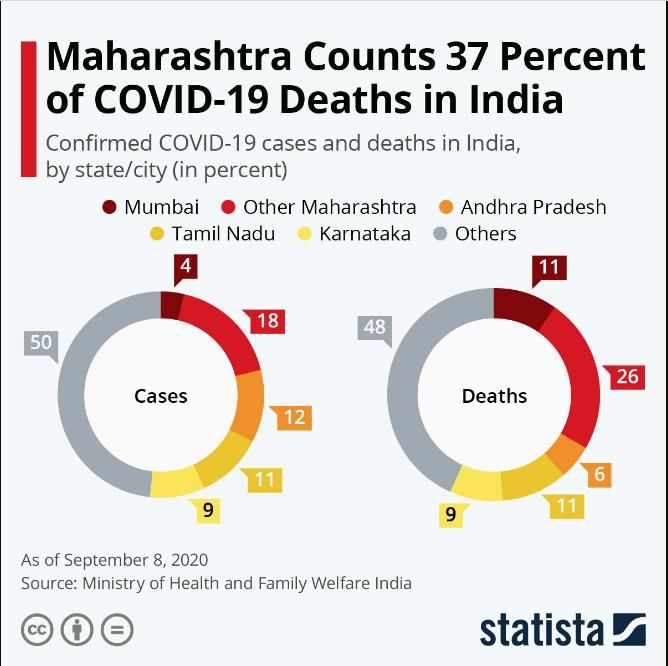
the most affected countries by COVID-19 with Maharashtra being the most affected state by with
Mumbai, Pune, Thane, Nashik, etc districts being the key contributors to the epidemic in the state.
This paper series focuses on the response of the Maharashtra State Government to the ongoing
pandemic. Part-1 is a study for the pre-vaccine (before the vaccines were introduced to the
population) situation of Covid-19 in the State whereas the upcoming Part-2 will be for the post-
vaccine situation.
Objective: To examine the trends and situation of the pre-vaccine time of COVID-19 in
Maharashtra. To forecast the confirmed cases and death cases of COVID-19 until December 2020;
using the time series ARIMA model. Conduct SWOT analysis to assess the State’s response to
tackling the pandemic.
Method: We projected the cases up to 22nd December 2020 using the ARIMA Forecasting model
and the ARIMA model fitted correlogram for the Death and confirmed cases based on data from
3 March 2020 to 23 October 2020. We have also conducted the SWOT analysis by creating a
SWOT matrix using S/O, S/T, W/O, and W/T.
Results: The analysis result shows the total confirmed and Death cases for Maharashtra.
According to our forecasts, Maharashtra will be having 1781193 confirmed cases on November
15 (95% CI: 1674032,1888355), 1878628 confirmed cases on November 30 (95% CI:
1635368,2121888), 1876058 confirmed cases on December 15 (95% CI: 1563135,2388980), andat the end of December confirmed cases are 2021525 (95% CI: 1519695,2523355) and 477632 Death cases on November 15 (95% CI: 44759, 50506), 50701 Death cases on November 30 (95% CI: 44918,56484), 53770 Death cases on December 15 (95% CI: 44451, 63089) and at the end of December Death cases is 55202 (95% CI: 44049, 66355). Discussion and Conclusion: It has been observed that with time, confirmed cases will increase at a faster rate since the vaccine for Covid-19 has still not been administered to the population. Also, all the results forecasted are quite close to the corresponding actual values that were observed by the end of December 2020. Introduction The COVID-19 pandemic in India is part of the worldwide pandemic of coronavirus disease 2019 (COVID-19) caused by severe acute respiratory syndrome coronavirus 2 (SARS-CoV-2). The Government of India confirmed India's first case of Coronavirus disease 2019 on 30 January 2020 in the state of Kerala, when a university student from Wuhan traveled back to the state. Maharashtra is a state in the western peninsular region of India occupying a substantial portion of the Deccan Plateau. Maharashtra is the second-most populous state in India with a mid-year population of 123 Million (projected by Unique Identification Aadhar India, updated 31, May 2020). It is spread over an area of 307,713 km2. The state of Maharashtra emerged as the biggest contributor to the nation with the highest amount of total confirmed cases and deaths. The first confirmed case of a novel coronavirus in Maharashtra was reported on 9 March 2020 in Pune, where a couple returning from Dubai tested positive. As of 8th September 2020, Maharashtra by itself accounted for 22% of total cases and 37% of total deaths in India. Thus it is of utmost importance to learn about the situation of Covid-19 in Maharashtra [1]. Here in this paper, we are going to discuss the trends of various parameters of the Covid-19 in Maharashtra, make projections for the later part of the pre-vaccine time, and further extend our discussion to the SWOT analysis of the handling of covid-19 in the state.
Up till 28th October 2020, Maharashtra had reported a whopping total of over 16.32 lakhs
Confirmed cases, over 14.45 lakhs Recovered cases, and over 1.43 lakhs and 43,000 Active and
Deceased                                 cases                                  respectively.
The top 3 worst performing districts are Pune, Mumbai, and Thane in the decreasing order with
their share of 20%, 15%, and 13% respectively in the total cases up till 22nd October 2020.
Trends
Before doing the projections and understanding the SWOT analysis of the Covid-19 in the state of
Maharashtra, we first need to understand certain trends of various parameters of the epidemic in
the state to get a much comprehensive and bigger picture.

       Figure 1: Cumulative Values

       Figure 2: Spikes

The above two plots tell us a lot about how covid-19 had its trend in Maharashtra. Figure-1 shows
the total confirmed cases increased very rapidly, almost exponentially till the first week of
September 2020. It then started decreasing and if the state authorities and governance can control
the epidemic in near future, the line of confirmed cases( Blue) will be asymptotic and the line may
follow a logistic curve. Thus if it happens so, it can be an indicator that the state has been successful
in controlling the epidemic. The plot for the recovered cases (Orange) also follows a similar trend
to the total cases line. The line for deceased cases is somewhat linearly increasing with a very
small slope.
As Figure-1 has helped us in understanding the overall trend up till 22 nd October 2020, Figure-2
gives us a much greater insight into the day-day action of covid-19. The highest number of incident
cases (new cases) had reached up to around 25,000 in a day in about 7 months. We are considering
it as the peak of covid-19 in the state of Maharashtra. Though the discussion about the peak should
be done only after considering other parameters like the Basic Reproductive Rate (Ro). Thus, we
will take this discussion in the next segment. The number of recovered cases per day overtook the
number of incident cases somewhere after the mid-September.
Figure 3: Situation after Unlock-1
The MHA had issued fresh guidelines for June, stating that the phases of reopening would "have
an economic focus". Lockdown restrictions were only to be imposed in containment zones, while
activities were permitted in other zones in a phased manner. This first phase of reopening was
termed "Unlock 1.0" and permitted shopping malls, religious places, hotels, and restaurants to
reopen from 8 June 2020. Large gatherings were still banned, but there were no restrictions on
interstate travel. Night curfews were in effect from 9 p.m. to 5 a.m. in all areas and state
governments were allowed to impose suitable restrictions on all activities. According to the
Maharashtra government, 60,000 industries were reopened in the state which employed about 1.5million directly[2]. But in this effort to revive the economy, the spread of covid-19 escalated. We
can see a very rampant increase in the number of incident cases for each day in Figure-3.
Important Parameters and Indicators of the Epidemic (Up until 22nd October 2020)
I. Basic Reproductive Number:
The basic reproduction number R0 is the average number of people that an infected
person could spread the virus to in their infected period. It is the ratio of the number
of new infections by the number of existing infections.
• If R0 is greater than 1, then the outbreak will lead to an epidemic
• If R0 is less than 1, then the outbreak will become extinct.
• If R0 is equal to 1, one infected person will infect exactly one other person,
and so the number of infected persons in the population will remain constant
over time and the epidemic will become endemic.
The exponential model [3] used to find the value of R0 for each day t is,
I(t)=(R0)(t/SI)
where,
I(t): number of incident cases at time t
R0: Basic Reproductive Number
SI: Serial Interval
t: Prediction TimeFigure 4: Trend for Basic Reproductive Number in Maharashtra
In the Figure-4, we can see that the value of the R0 is decreasing and is tending to
1.00 which is a great sign as the outbreak is trying to achieve the endemic status.
Now coming to the discussion of whether the Covid-19 had achieved its peak in
September or not, that we would like to draw the reader’s attention to June in
Figure-2. It had a similar situation to September where the number of recovered
people overtook the number of (new) incident cases for a particular day. It was
being speculated at that time in June that whether Maharashtra had achieved its
peak or not just like we are doing for September. Now if we compare the values of
the R0 in June and September, which are somewhere around 1.6 and 1.2
respectively, We think that it is a much safer assumption of achieving the peak of
covid-19 in September considering the value and trend of the R 0 and assuming that
no extreme event occurs.
II. Herd Immunity:
Herd Immunity(HI) is defined as resistance to the spread of an infectious disease
within a population that is based on pre-existing immunity of a high proportion of
individuals as a result of previous infection or vaccination. It is given by:
HI=1-(1/R0)III. Case Fatality Rate:
The case fatality rate also called case fatality risk or case fatality ratio,
in epidemiology, is defined as the proportion of people who die from a
specified disease among all individuals diagnosed with the disease over a certain
period. It is used to measure the severity of the disease in terms of the deaths caused
by it. It is given by
CFR(%)= (D(t)/C(t))*100
where,
D(t): Number of people Deceased at time t
C(t): Number of cases Confirmed at time t
Figure 5: Trend for Case Fatality Rate
The case fatality rate of Maharashtra on average has stayed below the global
average but has been one of the highest for a state in the nation.
IV. Number of Tests done and Test Positivity Rate:
It is very important to test a person for covid-19 for two reasons:
1) Confirm the diagnosis of the disease
2) Find asymptomatic cases to help stop the transmission of the disease
Thus it is very important to do maximum testing and screening of the diagnosed as
well as the general population and the test positivity rates tell us whether the
government or the authorities are doing enough testing or not.
Test Positivity Rate is defined as the fraction of tests having a positive result out
of the total number of tests done. The lesser the TPR, the better it is. It is given byTPR(%)=(NP(t)/TT(t))*100 where, NP(t): Number of Positive Tests at time t TT(t): Total Tests done at time t Figure 6: Trend of Tests done per day Figure 7: Trend of TPR
Figure-6 shows the number of tests done per day. We can see a clear rise in the tests done in June.
This might be because of the government guidelines of testing for covid-19 when they permitted
the private labs as well. There is also a huge spike in the amount of testing in the second week of
September. This can be associated with the cause of the launching of the policy “My Family, My
Responsibility” by the Chief Minister of Maharashtra which aimed at surveying, screening, and
if needed then testing a total of 22.5 million families twice a month [4].

Situation and Trends in Mumbai and Pune(Up till 22nd October 2020)

Mumbai and Pune are the two major business districts as well as the Urban centers of the state of
Maharashtra. Mumbai is the biggest Urban center in India with a population total of 20.4 million
people (estimated for 2020) and Pune with a population of 7.4 million (estimated for 2020). They
are the largest contributors to the burden of covid-19 in Maharashtra. Thus looking at the trends
of the epidemic and its parameters and indicators for these two districts with special consideration
is very important.

The following are the few graphical representations for the aforementioned districts of
Maharashtra:-

       Figure 8: Pune vs Mumbai

Pune being the leading contributor to the total confirmed cases in Maharashtra has a total of over
3.27 lakhs cases whereas Mumbai has a total of over 2.47 lakhs. From Figure-8, we can see that
Mumbai was quite ahead in the race of confirmed cases till mid-August. Pune overtook Mumbai
later in August. The reason for this cannot be pinpointed as numerous things were happening
altogether. Along with relaxations offered in the “Unlock 3.0”, the state was also celebrating
Ganpati, its biggest festival of the year.
Figure 9: Trend of CFR in Mumbai
Figure 10: Trend of CFR in PuneFigure 11: Trend of Basic Reproductive Number in Mumbai Figure 12: Trend for Basic Reproductive Number in Pune
Forecasting trends:
The Indian public health care system is already overstretched, and this pandemic is making things
even worse. That is why forecasting cases is necessary to meet the future demands of the health
infrastructure.

Considering the pre-vaccine time for Covid-19, the prevalence of the disease is increasing day by
day and all the scientists in the world are still doing a lot of research to stop this huge crisis that
has hit the world. It is very important to have a projection for the epidemic in the state of
Maharashtra, considering its contribution to the burden of the Covid-19 in India. The projection
helps the government in its future endeavors.

Many researchers around the world have used different mathematical models such as the
exponential method, time-series model, etc. We have used the ARIMA time series model using R
studio in this study. The ARIMA (Auto Regressive Integrated Moving Average )model is a simple
stochastic time series model and is used to understand data and predict the future. ARIMA model
is a very good model for COVID19 projection. Using this model, we have tried to estimate the
number of confirmed cases and death cases of COVID19 in the future.ARIMA model prediction
is based on different parameters. Parameters are p, d, q which evaluate Auto Regressive, integrated
and moving average respectively. ARIMA MODEL deals with stationary data, to check
stationarity A D Fuller test is used. If data is not stationary make it stationary by differencing
method, differencing is done till data become stationary that is the value of d (no of time
differencing is done), and Parameters p and q are determined based on partial Auto-correlation
function or partial Correlogram function (PACF) and Complete Auto-Correlation Function or
Complete correlogram (ACF) respectively. For different data, we get different values of P, d and
q. These parameters help to predict the future. This model not only shows the overall trend but
also shows 95% and 80% confidence intervals for point estimation.

Data and Methods
The data source[5] provides the data in cumulative form. We projected cases up to 22 December
2020 using the ARIMA Forecasting model based on data from 3 March 2020 to 23 October 2020.

The model for forecasting future confirmed and death cases of COVID-19 cases is represented as:

ARIMA (p,d,q): Xt= α1 Xt-1 + α2 Xt-2 + β1 Zt-1 + β1 Zt-2 + Zt
Zt = Xt- Xt-1
         is the predicted number of cumulative confirmed and death COVID-19 cases at the day;
from fig Xt
α1, α2, β1, and β2 are parameters whereas Zt is the residual term for the day.
Forecasted Confirmed cases of COVID-19 for Maharashtra: Table 2, shows the forecast of
confirmed cases of Maharashtra on November 15, November 30, December 15, and December 22.
The analysis result for India in Table 1 and Fig. 2 shows the total confirmed and Death cases for
Maharashtra. It has been observed that with time, confirmed cases will increase at a faster rate. According to our forecasts, Maharashtra will be having1781193 confirmed cases on November 15 (95% CI: 1674032,1888355), 1878628 confirmed cases on November 30 (95% CI: 1635368,2121888), 1876058 confirmed cases on December 15 (95% CI: 1563135,2388980), and at the end of December confirmed cases are 2021525 (95% CI: 1519695,2523355) and at mid of the December cases will start to stabilize because herd immunity among people of Maharashtra is increasing day by day so emerging new no of cases will slow down at it become stable at the end of December. Similarly, According to our forecasts, Maharashtra will be having 477632Death cases on November 15 (95% CI: 44759, 50506), 50701Death cases on November 30 (95% CI: 44918,56484), 53770Death cases on December 15 (95% CI: 44451, 63089) and at the end of December Death cases is 55202 (95% CI: 44049, 66355) Results:
Fig. 1(a) Correlogram and ARIMA Forecast for the Confirmed COVID-19 Cases in Maharashtra
Fig. 1(b) Correlogram and ARIMA Forecast for the Active COVID-19 Cases in India
ARIMA model fit for confirmed and Death cases of COVID-19 in Maharashtra Fig 1(a) & 1(b),
shows the ARIMA model fitted correlogram for the Death and confirmed cases. In these figures,
we see four subfigures that reveal the trend for the earlier and forecasted values for both confirmed
and Death cases. Forecasting based on PACF and ACF graphs helps to determine parameters p
and q. Moreover, the best ARIMA model fit is considered to have the lowest Akaike Information
Criterion (AIC) value. Fig 1(a) also shows the fitted model for total confirmed cases with ARIMA
(1,2,3) having the lowest AIC. With the help of this model, we have predicted confirmed cases
with 95% CI till December 22, 2020. Similarly, for total Death cases in Fig 1(b), we have a suitable
model with ARIMA (1,2,3), which helps to predict active cases with 95% CI till December 22,
2020. The results forecasted are quite close to the corresponding actual values that were observed
by the end of December 2020.
SWOT Analysis
The Maharashtra government undertook many initiatives to fight against the COVID-19
and also launch many programs and policies. However, to plan an effective strategy for
fighting covid-19 while minimizing risk and maximizing results, it is crucial to identify the
internal and external factors correctly.
A SWOT analysis can be done to assess the state’s current position in tackle the pandemic.
The analysis examines Maharashtra’s Strengths, Weaknesses, opportunities, and Threats
on the COVID-19 front.
Strength:
Existing infrastructure like private hospitals, NGOs, railway coaches, schools was
converted into isolation wards.
Strict lockdown, trains, buses, and international flights are closed.
Restriction of people movement from inter-district, intra-district, and state except for an
emergency.
War Against Virus: For monsoon challenges ahead which cover :
Bed strength to around 2.90 lakh.
over 8,500 ICU beds in major hospitals
more than 3,000 ventilators more than 3,000 ventilators, around half a million PPE kits, and one million N95 masks
are ready for the medical and para-medical staff in various hospitals
Jyotiba Phule Jan Arogya Yojana (MJPJAY) will provide free and cashless insurance
protection to all citizens under the state government's health scheme and cover 85% of the
population.
Mission Begin Again: strictly follow the lockdown
Chase The Virus: a COVID-19 patient will compulsorily be kept in institutional quarantine
My family my responsibility: a door-to-door survey which covers 2.25 crore families.
Maharashtra launches Project Platina, ‘world’s largest’ plasma therapy trial for covid-19
patients
Maharashtra govt launches ‘COVID-Madat' for tele-screening
The state government has decided to unveil a new policy on the registration of migrant
workers.
While the return of migrants workers who left the state during lockdown is certain, the
objective of the registration is to collect data on the number of migrant laborers, their home
states, and where they were working before they left Maharashtra. When they return, they
will be registered so that they can resume their duties or get new jobs.
Three-time meals every day are being given to seven lakh migrants labor and the homeless
along with medical assistance.
There are no restrictions for the farmer on farming activities and commodities.
As far as day-to-day activities are concerned, meals are being served at Rs 5, and wheat
and rice are provided to orange ration cardholders.
According to data of the labor department, nearly 12 lakh and 5.5 lakh migrant laborers
left for their hometown in Shramik Special trains and Maharashtra State Road Transport
Corporation (MSRTC) buses, respectively.
Of the Rs 54.75 crore sanctioned from the CM's Relief Fund for the travel of migrant
workers to their respective states by special trains, Rs 12.96 crore are earmarked for
Mumbai city and Rs 10 crore for Mumbai suburbans.
since 1 May, at least 822 Shramik special trains from Maharashtra have taken 11.86 lakh
migrant workers back to their home states.
Weakness:
Lack of testing kits, PPE, mask, and ventilators
Lack of oxygen, lack of dialysis machines
Lack of isolation and quarantine ward
As many times locals are reluctant to share their details.
Movement of people from cities to villages
Poor surveillance and active case search, cases are detected late
Lack of health workers staff for the survey.
Lack of health workers staff for the survey. Unplanned lockdown most affected migrant workers.
Shortage of trains for migrants workers.
Movement of people from cities to villages
Poor surveillance and active case search, cases are detected late.
Poor quality of resources.
As many times locals are reluctant to share their details.
Shortage of emergency healthcare infrastructure and professionals
Lack of health workers staff for the survey.
Opportunity:
Enhance measures for institutional quarantine
Contain disease in urban areas and prevent infection spilling over to rural
Beef up medical resources and infrastructure
Development of a vaccine/antidote for covid-19
Numerous web resources.
To move our classes to a different platform, introduce e-learning & develop learners'
autonomy.
Contact tracing becomes easier and this will become a better control of spreading the
coronavirus.
Lockdown and isolation important techniques on the spread of covid-19.
Health survey is to collect health details for future planning and reference & this will help
to construct a health map of Maharashtra.
Threats:
Failure in contact tracing may lead to worsening of the present situation and an increase in
the probability of being hit by the second wave of covid-19.
Higher chances of frontline workers contracting the disease.
most of the housing societies people are not allowing the campaign employees to come
inside to conduct the survey.
The elderly population getting affected.
Spread of disease from urban to rural areas.
Drastic measures like complete stoppage of the local suburban train and bus services in
key cities like Mumbai.SWOT Opportunities Threats
Matrix
Using strengths to Maximized Using strengths to Minimized
Opportunities Threats
• Health survey is to collect • Implementation of strong
Strengths health details for future policies for present and future
planning and reference & this outbreaks.
will help to construct a health • Extending health assurance
map of Maharashtra. benefits to the larger masses.
• Development of a third-tier • Now, in inter-state migration
governance system for people go through the process
educating and monitoring of registration, so we can easily
people. tracing and if people infected
• Making use of the R&D by Covid we can keep it in
ecosystem for rapid quarantine or isolation ward.
development of COVID-19
vaccine/antidote.
Using Opportunities to Minimized Prevent weaknesses from turning
weakness into threats
• Make a strong team of • In public places, like Mumbai
paramedical staff for the future. locals make sure that people
• More available of ventilators, maintaining social distancing.
Weaknesses dialysis machines, etc. • High-density population in
• Start-ups, MSMEs for the Mumbai, people's mobility is
production of PPEs, testing also high so elderly people do
kits, masks, etc. not go out in public places.
• Develop technical • Specific action to be taken for
infrastructures to ensure the people below the poverty
smooth and flexible employee line.
working arrangements to • Ensure adequate infrastructure
minimize job losses. and protect our frontline
workers and healthcare staff.
Discussions and Conclusions
The world is going through a pandemic, and almost every country is affected by it. In India,
proactive measures like nation-wide lockdown and social distancing had been taken at an early
stage of infection. India’s R0 had hit its peak on the 26th of April, 2020 during a lockdown withR0 = 2.58 but on 26 th May, it goes down to Rt = 1.50 which shows that the nation-wide lockdown
has slowed the reproduction rate of COVID-19. The daily confirmed cases were increasing day by
day during a lockdown in a slow manner and during unlocking 1,2,3 and 4 the no of confirmed
cases and death cases started increasing in a fast manner.
This rapid increase in cases has stressed most healthcare systems worldwide and has further made
outbreak response and resource planning a challenge. In response, health authorities have
attempted to forecast the trend of this pandemic, however, this has proven to be difficult as
COVID-19 is a novel disease with limited data and knowledge on the disease trends and dynamics.
This is especially observed when using compartmental and time series models to predict disease
trends, where compartmental models.
Our results are compatible with findings obtained from ARIMA models to estimate the number of
confirmed and Death cases related to the COVID-19 pandemic in Maharashtra. However, since
the results of our study are obtained from more recent data, we think that we have obtained a more
consistent forecast for the future. ARIMA models are not only effective but it’s a simple and easy
method by which COVID-19 trends can be predicted based on open access data. Also, the use of
smoothened data and independent covariates improved model accuracy.
In conclusion, ARIMA models have been created by considering the most appropriate AIC and
BIC values for Confirmed cases and death numbers for Maharashtra. According to the results,
while the number of cases in Maharashtra is expected to decrease after the vaccines are
administered, i.e., as of January end of 2021. The number of deaths in Maharashtra is expected to
be the lowest in December end of 2020. Also, it is thought that studies in which the sensitivity and
validity of these methods are tested with more cases will contribute to researchers working in this
field.
The actual numbers are close to what we had forecasted. As Maharashtra state and the central
government started focusing on these issues as deep as the individual level taking all proper
precautions and properly followed the WHO guidelines, it has most certainly helped in decreasing
the impact of the crisis to some extent before the vaccines are introduced. By the end of January,
the graph becomes stable, where we are expecting not much rise in the Cases due to the
administration of the vaccines to the population by the government in a phase-wise manner as
planned by the Central Government.
Table 1
Indicator State Mumbai Pune
Average
Test Positivity Rate(TPR) 19% - -
Basic Reproductive Number(R0) 1.3 1.38 1.34
Herd Immunity(HI) 28.13% 28.05% 25.53%
Case Fatality Rate(CFR) 3.2% 4.51% 3.24%Table 2 Forecast of Confirmed and Death Cases of COVID-19 for Maharashtra from June
24 October to December 22, 2020, Maharashtra
Date Confirme 95% Death 95%
d Cases Confidenc Cases Confidenc
e Interval e Interval
Point Lower Upper Point Lower Upper
Estimates Estimate
24th October 2020 1633244 1630684 163580 43061.86 42864.14 43259.5
4 8
25th October 2020 1641109 1636406 164581 43288.63 42987.82 43589.4
1 4
26th October 2020 1648603 1642257 165494 43508.39 43125.23 43891.5
8 4
27th October 2020 1655826 1647728 166392 43723.35 43261.93 44184.7
5 6
28th October 2020 1662853 1652692 167301 43935.03 43393.65 44476.4
3
29th October 2020 1669735 1657116 168235 44144.46 43518.86 44770.0
4 6
30th October 2020 1676513 1661010 169201 44352.36 43637.07 45067.6
6 6
31st October 2020 1683214 1664400 170202 44559.22 43748.26 45370.1
8 7
1st November 2020 1689860 1667323 171239 44765.35 43852.66 45678.0
6 5
2nd November 2020 1696464 1669816 172311 44971 43950.56 45991.4
2 4
3rd November 2020 1703039 1671913 173416 45176.31 44042.31 46310.3
6
4th November 2020 1709593 1673642 174554 45381.39 44128.24 46634.5
3 3
5th November 2020 1716131 1675032 175722 45586.31 44208.67 46963.9
9 6
6th November 2020 1722657 1676105 176920 45791.13 44283.87 47298.3
9 9
7th November 2020 1729175 1676880 178147 45995.87 44354.1 47637.6
0 4
8th November 2020 1735687 1677375 179399 46200.56 44419.58 47981.5
8 4
9th November 2020 1742194 1677604 180678 46405.22 44480.53 48329.9
4 1
10th November 2020 1748698 1677581 181981 46609.85 44537.11 48682.6
511th November 2020 1755200 1677317 183308 46814.47 44589.49 49039.4
2 6
12th November 2020 1761700 1676822 184657 47019.08 44637.81 49400.3
8 5
13th November 2020 1768198 1676104 186029 47223.68 44682.19 49765.1
3 6
14th November 2020 1774696 1675171 187422 47428.27 44722.77 50133.7
1 8
15th November 2020 1781193 1674032 188835 47632.86 44759.63 50506.1
5
16th November 2020 1787690 1672691 190268 47837.45 44792.88 50882.0
9 3
17th November 2020 1794186 1671155 191721 48042.04 44822.6 51261.4
7 8
18th November 2020 1800682 1669429 193193 48246.63 44848.89 51644.3
5 7
19th November 2020 1807178 1667519 194683 48451.21 44871.8 52030.6
8 2
20th November 2020 1813674 1665427 196192 48655.8 44891.41 52420.1
0 8
21st November 2020 1820169 1663159 197717 48860.38 44907.8 52812.9
9 6
22nd November 2020 1826665 1660719 199261 49064.96 44921.01 53208.9
1 2
23rd November 2020 1833160 1658110 200821 49269.55 44931.11 53607.9
1 9
24th November 2020 1839656 1655334 202397 49474.13 44938.15 54010.1
7 1
25th November 2020 1846151 1652397 203990 49678.71 44942.18 54415.2
6 5
26th November 2020 1852646 1649299 205599 49883.3 44943.25 54823.3
4 5
27th November 2020 1859142 1646045 207223 50087.88 44941.4 55234.3
8 6
28th November 2020 1865637 1642637 208863 50292.46 44936.69 55648.2
7 4
29th November 2020 1872133 1639077 210518 50497.05 44929.14 56064.9
8 5
30th November 2020 1878628 1635368 212188 50701.63 44918.81 56484.4
8 6
1st December 2020 1885123 1631511 213873 50906.22 44905.72 56906.7
5 1
2nd December 2020 1891619 1627510 215572 51110.8 44889.92 57331.6
7 8
3rd December 2020 1898114 1623366 217286 51315.38 44871.44 57759.3
2 34th December 2020 1904609 1619081 219013 51519.97 44850.31 58189.6
7 2
5th December 2020 1911104 1614657 220755 51724.55 44826.56 58622.5
2 3
6th December 2020 1917600 1610096 222510 51929.13 44800.24 59058.0
4 3
7th December 2020 1924095 1605399 224279 52133.72 44771.35 59496.0
1 8
8th December 2020 1930590 1600568 226061 52338.3 44739.94 59936.6
3 6
9th December 2020 1937086 1595605 227856 52542.88 44706.03 60379.7
6 3
10th December 2020 1943581 1590512 229665 52747.47 44669.66 60825.2
0 8
11th December 2020 1950076 1585289 231486 52952.05 44630.83 61273.2
3 7
12th December 2020 1956572 1579939 233320 53156.63 44589.59 61723.6
4 8
13th December 2020 1963067 1574462 235167 53361.22 44545.94 62176.4
2 9
14th December 2020 1969562 1568861 237026 53565.8 44499.93 62631.6
4 7
15th December 2020 1976058 1563135 238898 53770.38 44451.57 63089.2
0
16th December 2020 1982553 1557287 240781 53974.97 44400.87 63549.0
9 6
17th December 2020 1989048 1551318 242677 54179.55 44347.87 64011.2
8 3
18th December 2020 1995544 1545229 244585 54384.13 44292.59 64475.6
8 8
19th December 2020 2002039 1539021 246505 54588.72 44235.04 64942.3
7 9
20th December 2020 2008534 1532695 248437 54793.3 44175.25 65411.3
3 5
21st December 2020 2015030 1526253 250380 54997.88 44113.23 65882.5
6 4
22nd December 2020 2021525 1519695 252335 55202.47 44049 66355.9
5 3
References
1). https://www.statista.com/chart/21868/share-of-covid-19-cases-deaths-in-indian-states-cities
by Katharina Buccholz2). https://en.wikipedia.org/wiki/COVID-
19_pandemic_lockdown_in_India#Unlock_1.0_(1%E2%80%9330_June)
3). Assessing the Impact of Complete Lockdown on COVID-19 Infections in India and its Burden
on Public Health Facilities, Laxmi Kant Dwivedi, et al
4). https://www.maharashtra.gov.in, Maharashtra Government Official Website
5). https://covid19-api.org/
6). https://www.hindustantimes.com/india-news/maharashtra-imposes-price-cap-on-private-
hospitals-treating-covid-patients/story-cW6x7ftNQ8WQIUMlCHqAoN.html
7). https://sarkariyojana.com/my-family-my-responsibility-campaign/
8). https://sarkariyojana.com/maharashtra-coronavirus-treatment-mjpjay/
Appendix:
Fig. Trend of Forecasted Confirm COVID-19 Cases over the Period in Maharashtra
Trend of Forecasted Confirm COVID-19 Cases over the Period in Maharashtra Confirmed Cases
2500000
2000000
1500000
Confirm Cases
1000000
500000
0
12th march 2020
17th march 2020
27th march 2020
21st May 2020
31st May 2020
5th July 2020
23rd October 2020
12th November 2020
17th November 2020
27th November 2020
21st April 2020
8th September 2020
2nd November 2020
7th December 2020
1st May 2020
23rd September 2020
25th June 2020
30th June 2020
14th August 2020
19th August 2020
24th August 2020
29th August 2020
3rd October 2020
1st April 2020
11th May 2020
16th May 2020
26th May 2020
10th June 2020
15th June 2020
20th June 2020
7th November 2020
11th April 2020
16th April 2020
26th April 2020
6th May 2020
5th June 2020
3rd September 2020
22nd December 2020
4th August 2020
9th August 2020
13th October 2020
18th October 2020
28th October 2020
22nd march 2020
6th April 2020
10th July 2020
15th July 2020
20th July 2020
25th July 2020
30th July 2020
22nd November 2020
12th December 2020
17th December 2020
2nd December 2020
13th September 2020
18th September 2020
28th September 2020
8th October 2020
Date
Fig. Trend of Forecasted Confirm and Active COVID-19 Cases over the Period in
MaharashtraDeath Cases
0
10000
20000
30000
40000
50000
60000
12th march 2020
17th march 2020
22nd march 2020
27th march 2020
1st April 2020
6th April 2020
11th April 2020
16th April 2020
21st April 2020
26th April 2020
1st May 2020
6th May 2020
11th May 2020
16th May 2020
21st May 2020
26th May 2020
31st May 2020
5th June 2020
10th June 2020
15th June 2020
20th June 2020
25th June 2020
30th June 2020
5th July 2020
10th July 2020
15th July 2020
20th July 2020
25th July 2020
30th July 2020
4th August 2020
Date
9th August 2020
14th August 2020
19th August 2020
24th August 2020
29th August 2020
3rd September 2020
8th September 2020
13th September 2020
18th September 2020
23rd September 2020
28th September 2020
3rd October 2020
8th October 2020
13th October 2020
18th October 2020
23rd October 2020
28th October 2020
2nd November 2020
7th November 2020
12th November 2020
17th November 2020
22nd November 2020
27th November 2020
2nd December 2020
Trend of Forecasted Confirm and Active COVID-19 Cases over the Period in Maharashtra
7th December 2020
12th December 2020
17th December 2020
22nd December 2020
DeathYou can also read