A syndromic surveillance tool to detect anomalous clusters of COVID 19 symptoms in the United States
←
→
Page content transcription
If your browser does not render page correctly, please read the page content below
www.nature.com/scientificreports
OPEN A syndromic surveillance tool
to detect anomalous clusters
of COVID‑19 symptoms
in the United States
Amparo Güemes1,4*, Soumyajit Ray1,4, Khaled Aboumerhi1,4, Michael R. Desjardins2,
Anton Kvit2, Anne E. Corrigan2, Brendan Fries2, Timothy Shields2, Robert D. Stevens3,5,
Frank C. Curriero2,5 & Ralph Etienne‑Cummings1,5
Coronavirus SARS-COV-2 infections continue to spread across the world, yet effective large-scale
disease detection and prediction remain limited. COVID Control: A Johns Hopkins University Study, is
a novel syndromic surveillance approach, which collects body temperature and COVID-like illness (CLI)
symptoms across the US using a smartphone app and applies spatio-temporal clustering techniques
and cross-correlation analysis to create maps of abnormal symptomatology incidence that are made
publicly available. The results of the cross-correlation analysis identify optimal temporal lags between
symptoms and a range of COVID-19 outcomes, with new taste/smell loss showing the highest
correlations. We also identified temporal clusters of change in taste/smell entries and confirmed
COVID-19 incidence in Baltimore City and County. Further, we utilized an extended simulated dataset
to showcase our analytics in Maryland. The resulting clusters can serve as indicators of emerging
COVID-19 outbreaks, and support syndromic surveillance as an early warning system for disease
prevention and control.
Despite progress in the fight against COVID-19, the pandemic remains the most immediate threat to human
health and society. Substantial efforts have been deployed to investigate this disease, yet our knowledge of its
origin, progress, and biological mechanisms remain limited. An effective vaccine and treatment are imperative to
reducing disease burden, but until either is achieved, efforts must be focused on prevention of disease transmis-
sion, which necessitates robust disease surveillance and response. Current approaches implemented to manage
the spread of the infection could be significantly improved by clearly discriminating between high and low-risk
population areas and time periods.
Metrics currently used to describe the progress of COVID-19 are based primarily on cases confirmed by
laboratory tests, numbers of patients hospitalized and in intensive care, and counts of the number of deaths1,2.
The data for each of these metrics, however, is temporally inconsistent and often delayed due to incubation time
of the virus (2–14 days), the time from the onset of symptoms until clinical care is obtained, the time from test
to confirmed test result, and, in the more severe cases, the time from hospital admission to d eath2,3. It is esti-
mated existing epidemiological accounts of COVID-19, when measured in counts of confirmed cases or deaths,
provides a snapshot of infections acquired 2–4 weeks previously4. To further complicate matters, the informa-
tion around each of these sources of error has varied dramatically since the start of the pandemic in March
2020. These metrics might be nevertheless highly informative if it is assumed that all infected individuals seek
medical attention and are thus incorporated into the case statistics. These metrics, however, do not consider the
population that is infected but is completely asymptomatic (40–50% in many studies)5, or those who prefer not
to seek medical care despite having symptoms. Furthermore, when hospitalizations do occur, they often happen
1
Department of Electrical and Computer Engineering, Johns Hopkins Whiting School of Engineering, The
Johns Hopkins University, 3400 N. Charles Street, 105 Barton Hall, Baltimore, MD 21218, USA. 2Department
of Epidemiology, Spatial Science for Public Health Center, Johns Hopkins Bloomberg School of Public Health,
Baltimore, MD 21205, USA. 3Department of Anesthesiology and Critical Care Medicine, Neurology, Neurosurgery
and Radiology, Johns Hopkins University School of Medicine, Baltimore, MD 21205, USA. 4These authors
contributed equally: Amparo Güemes, Soumyajit Ray, Khaled Aboumerhi and Michael R. Desjardins. 5These
authors jointly supervised this work: Robert D. Stevens, Frank C. Curriero and Ralph Etienne-Cummings. *email:
aguemes1@jhu.edu
Scientific Reports | (2021) 11:4660 | https://doi.org/10.1038/s41598-021-84145-5 1
Vol.:(0123456789)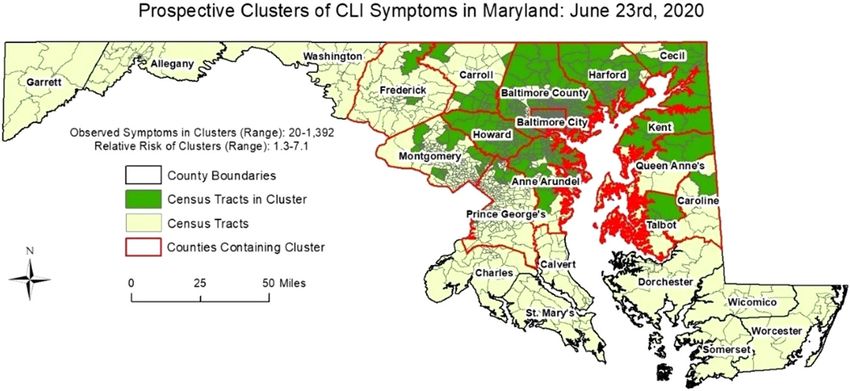
www.nature.com/scientificreports/
days after contracting the disease, when symptoms begin to manifest or worsen. Consequently, it is essential to
complement these disease monitoring systems with syndromic surveillance systems that allow a more extensive
and timely evaluation of the population.
Strategies for monitoring and predicting influenza-like illnesses (ILI) are essential when implementing a
surveillance system for COVID-196, because many signs and symptoms of COVID-19 are nonspecific and can
be indicative of other illnesses such as influenza, Lyme Disease, and the common cold. However, there are certain
symptoms that are more specific to COVID-19 and may be indicative of the prognosis of the disease. Anosmia
(loss of smell) is considered a common early symptom of COVID-19, and based on new findings it may be a
ospitalization7. Other signs such as skin rashes or
predictor of a less severe infection being less likely to require h
loss of color in the fingers or toes may also be prognostic indicators, as confirmed by the results of a recent study
that classifies skin manifestations into five patterns associated with a specific prognosis of COVID-19 infection8.
The CDC has one of the most comprehensive monitoring systems for ILI. One of the sources for data collection
consists of statistics on patients presenting flu-like symptoms to healthcare providers through a national network
called ILInet. In more detail, 2600 outpatient healthcare providers nationwide report to the CDC weekly on the
percentage of patients diagnosed with influenza out of the total number of patients seen. Presentation of fever
(temperature 100 °F [37.8 °C] or more) and cough and/or sore throat without a known cause other than the flu
are the requirements to be diagnosed as ILI. With the data collected in ILINet, the CDC generates a measure of
ILI activity at the national, regional and state level.
The epidemiology centers that contribute every year with real-time probabilistic forecasts for pandemic and
seasonal influenza activity make up the so-called “network” of Centers of Excellence for Influenza Forecasting
of the CDC. One of these institutions is the Delphi Research Group from Carnegie Mellon University. This
research group has recently focused their efforts on monitoring and predicting COVID-19, and has developed
the COVIDcast system that gathers aggregated data from different sources by collaborating with multiple part-
ners to visually display predictions of COVID-19 activity levels and prevalence in the United States9. The data
includes, among others, Google search statistics for COVID-related topics, and short surveys where Facebook
and Google users anonymously report whether they know someone or if they themselves present a number of
CLI symptoms, including fever, cough, shortness of breath, or difficulty breathing.
Another syndromic study that has emerged in recent months in the United Kingdom and now in the U.S. is
the COVID Symptom S tudy10. This is a mobile application in which registered users fill in daily questions about
their medical history and the presentation of numerous symptoms of COVID-19. This research aims to help
scientists better understand the symptoms of COVID-1911, and in the future, could be used to track the spread
of this virus, and identify high-risk areas in the country. Finally, Kinsa, a company developing and distributing
smart thermometers, is now collecting the body temperature of its customers to create maps showing the areas
where fever levels are abnormally high, compared to the levels expected for the time of year, which may be early
indicators of the spread of COVID-1912. Additionally, they create estimates of the activity trend using methods
previously described by Dalziel et al. that would be expected under normal influenza conditions, which allows
them to identify activity levels that are higher than this ‘normality’13.
While these are examples of systems that have been implemented to track or map COVID-19 cases or symp-
toms, there is still an unmet need for a tool for the detection of anomalous outbreaks of CLI symptoms that is
spatially accurate and continually updated. In an effort to overcome these challenges and support more selective
mitigation strategies, we developed a syndromic surveillance system that is comprised of an app to gather CLI
data, coupled with space–time analytics to identify hotspots of anomalous CLI symptoms and, in turn, identify
potential clusters of COVID-19. Our tool meets the following characteristics: (1) allows accurate mapping of
CLI in space and time; (2) reflects in quasi-real-time the health status of the sampled population; (3) is broadly
accessible and easy to use, and (4) collected data is intuitively visualizable and widely disseminated (e.g. via
a dashboard). Detecting disease clusters in space and time is an exploratory approach in infectious disease
surveillance14–16 which identifies geographical locations or regions where the observed number of cases or symp-
toms exceeds the expected number of cases given baseline conditions17. Here, we report syndromic surveillance
results obtained using purely temporal and space–time cluster detection approaches. We also detected space–time
clusters derived from a simulated dataset of over 800,000 entries in Maryland to showcase our analytics when
our app has an increased userbase.
Results
The app was launched on 25 April 2020, and since that date has been installed by over 11,000 unique users with
more than 72,000 data entries in 1019 counties across all states in the US (data on January 6, 2021). Age distri-
bution of users was bimodal with a peak in the 18–25 age bin and a second peak at 51–55 years (Fig. 1). 66% of
the app users were male, with 32% female and 1% preferred not to say. While the skew in gender distribution is
unusual, it is not expected to have any significant impact on the analysis. The majority of users (84.7%) entered
data over a maximum of 2 weeks (Fig. 2).
The time series for the number of daily data entries of each symptom from app launch to July 25, 2020 is
shown in Fig. 3. Note that headache, diarrhea and muscle pain were included in the list of symptoms in the third
release of the app on June 26 as ongoing research confirmed these as indicative of COVID-19.
Figure 4 provides the results of the retrospective cluster detection analysis in Baltimore County and City
from between April 27th, 2020 and December 9th, 2020. As usership increased, the number of reported CLI
symptoms also increased. A statistically significant cluster of symptoms was first detected in the northern region
of Baltimore City (Cluster 1), with a duration of 5 days (Apr. 27th-May 1st). Cluster 1 includes 15 observed CLI
symptom cases, with an expected count of 0.5. Cluster 2 was detected on May 3rd in western Baltimore County
and portions of Baltimore City with 22 observed and 6.4 expected symptoms (6-day duration). Cluster 3 was
Scientific Reports | (2021) 11:4660 | https://doi.org/10.1038/s41598-021-84145-5 2
Vol:.(1234567890)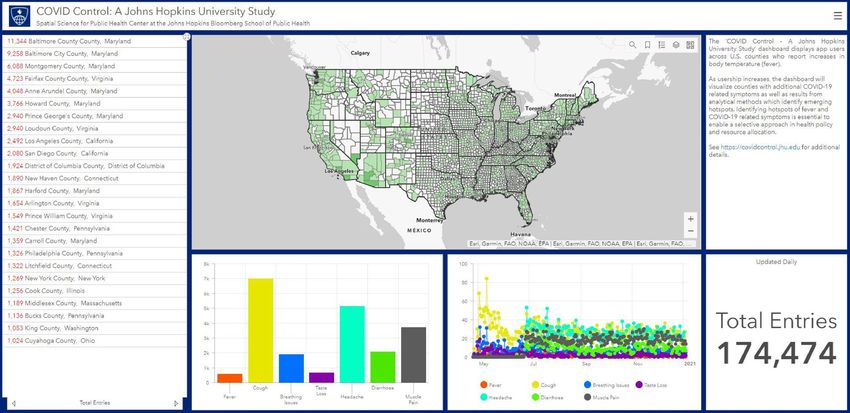
www.nature.com/scientificreports/
Figure 1. Demographics of app users up to January 5, 2021.
detected in the eastern region of Baltimore County on May 8th, with a duration of 9 days. Cluster 3 includes 24
observed and 6.1 expected symptom cases. A fourth cluster was detected (Cluster 4) on May 9th, with 5 observed
and 0.1 expected CLI symptom cases in southeastern Baltimore County. Cluster 5 was detected on May 17th in
southwestern Baltimore County with 6 observed and 0.08 expected symptom cases (duration of 2 days). Cluster
6 was identified on May 20th in northeastern Baltimore City with 11 observed and 1.6 expected cases (duration
of 12 days). Cluster 7 was detected on May 29th (duration of 14 days) with 11 observed and 0.8 expected cases;
while it is located in south-central Baltimore County. Cluster 8 is found in southeastern Baltimore County with
7 observed and 0.2 expected cases (began on July 29th; 7-day duration). Finally, Cluster 9 was first detected on
November 4th (14-day duration) just north of eastern Baltimore City with 12 observed and 1.2 expected cases.
When evaluating the relationship between app-recorded symptoms and confirmed COVID-19 cases in Maryland,
the strongest predictor was the new loss of taste/smell (correlation coefficient of 0.65; p < 0.01) at a 5-day lag.
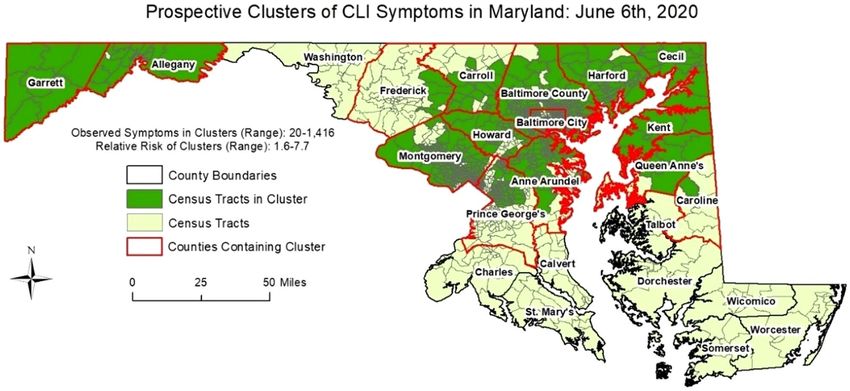
To demonstrate the efficacy of our methodology on a larger dataset, we generated simulated cases for Mary-
land state from a bivariate Gaussian distribution in space and a lognormal distribution in time. Our intent is to
demonstrate that the COVID-19 transmission dynamics and the noise generated in the data gathering process
(via the app) can be successfully handled by our methodology. Two clusters, varying both in the spatial and
temporal dynamics were randomly chosen. Based on the combined spatiotemporal case distribution, a genetic
algorithm was used to fit generated user profiles to the cases counts. These user profiles were then used to gener-
ate symptom information using the actually reported prevalence of each symptom, along with random noise to
simulate self-reported symptom information. Using our simulated dataset of 836,721 entries (91,674 symptomatic
entries—cases; and 745,047 asymptomatic entries—controls), we detected space–time clusters in 16 of 24 Mary-
land counties between May 24th and June 23rd, 2020. Figures 5 and 6 provide the results of the daily space–time
cluster detection analysis on June 6th and June 23rd, respectively (i.e. first day and last day of analysis), On June
6th, 15 of Maryland’s 24 counties contained at least one space–time cluster; two in the western-most counties
(Garrett and Allegany) and 13 in the central and north-eastern regions of the state. On June 23rd, 14 counties
contained at least one significant space–time cluster; while there were no longer clusters in the western counties
and Talbot County contained its first since the start of the analysis on June 6th. The clusters on June 23rd also
covered less area in Maryland, suggesting an overall decrease in CLI-symptom activity/entries. Table 1 summa-
rizes the daily results by presenting the number of times a Maryland county contained a cluster, and the dates a
cluster was first and last identified in each respective county. Twelve of the counties contained at least one cluster
of CLI-like symptoms between June 6th and June 23rd (i.e. 22 days), and 8 counties never contained a cluster
during the 18-day period of analysis. The analytical results present an example of how our tool can be used to
detect anomalous clusters of CLI symptoms, which will likely grow as userbase increases.
Discussion
We have created a tool for large-scale syndromic surveillance that identifies geographical regions with abnormally
high activity of fever and other COVID-19 like illness (CLI) symptoms, and preliminary results indicate that
outbreaks of COVID-19 can be identified using this system. With validation, this system could be used to guide
decision-making on health planning and resource allocation.
While several efforts have been implemented to monitor and predict COVID-19 cases or symptoms on a large
scale9,10,12 one of their biggest challenges is the approach for data collection. Some require a great effort on the
part of users to complete long questionnaires. In others, questionnaires are nonspecific not allowing the user to
feel engaged in the response to the pandemic. Both cases lead to the abandonment of citizen collaboration, which
is essential in this situation. Moreover, these strategies provide results that are limited to county/state levels, but
Scientific Reports | (2021) 11:4660 | https://doi.org/10.1038/s41598-021-84145-5 3
Vol.:(0123456789)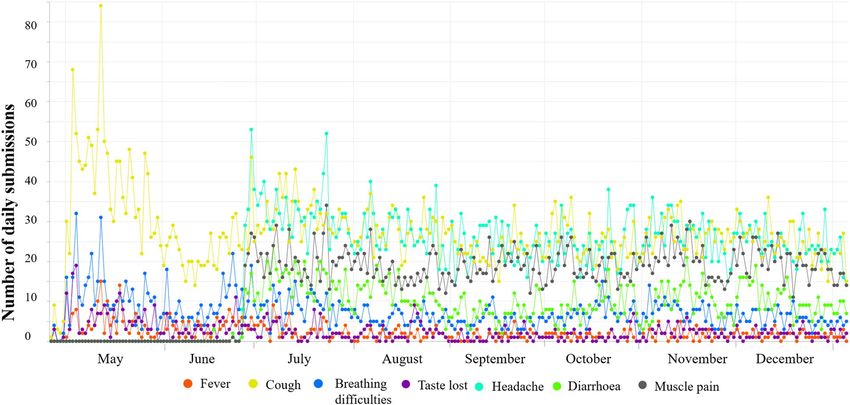
www.nature.com/scientificreports/

                                           Figure 2.  (a) Distribution of number of submissions per user up to January 5, 2021. (b) Breakup of the 1–10
                                           submission range (as a percentage of the total number of users).

                                           outbreaks typically do not stay contained within previously defined geographic areas. Our analytics allow detec-
                                           tion of clusters that are not restricted to pre-specified areas, making the results more comprehensive and realistic.
                                           The COVID Control app, unlike other apps with extensive surveys, presents a user-friendly and fast interface
                                           allowing users to submit relevant information in less than one minute. Furthermore, our methodology does not
                                           require any personal information and automatic access to GPS location is optional, which makes the app broadly
                                           accessible. We acknowledge that having access to the participants’ age-range, gender, and zip code may in some
                                           situations be de-anonymised. Therefore, to protect the privacy of our app users, our publicly accessible dashboard
                                           has the data and analyses available at the county level. We also implement adequate technical and organizational
                                           security methods to ensure the protection of the raw and processed data from accidental or intentional loss,
                                           misuse, unauthorized access, disclosure, alteration and/or destruction. The data security strategy follows the
                                           Microsoft Azure platform’s multi-layered defense-in-depth approach which includes a network security layer (IP
                                           firewall rules, VPN firewall), access management (SQL and AD authentication, authorization), threat protection
                                           (auditing and logging, advanced anomaly detection) and information encryption (encryption-in-transit and
                                           encryption-at-rest). In addition, we run periodic vulnerability assessments to identify potential threats to data
                                           security. These security measures have been approved by the Johns Hopkins School of Public Health (JHSPH)
                                           Institutional Review Board (IRB#00012283) and confirmed by the JHSPH IT data security reviewer.
                                               Acquiring data directly from individuals rather than hospitals/laboratories expands basic health monitoring
                                           of the general population and greatly reduces the delay in identifying new outbreaks of the disease. This, however,
                                           poses one of the major challenges because it relies on the engagement of the users to submit reliable self-reported

          Scientific Reports |   (2021) 11:4660 |               https://doi.org/10.1038/s41598-021-84145-5                                                    4

Vol:.(1234567890)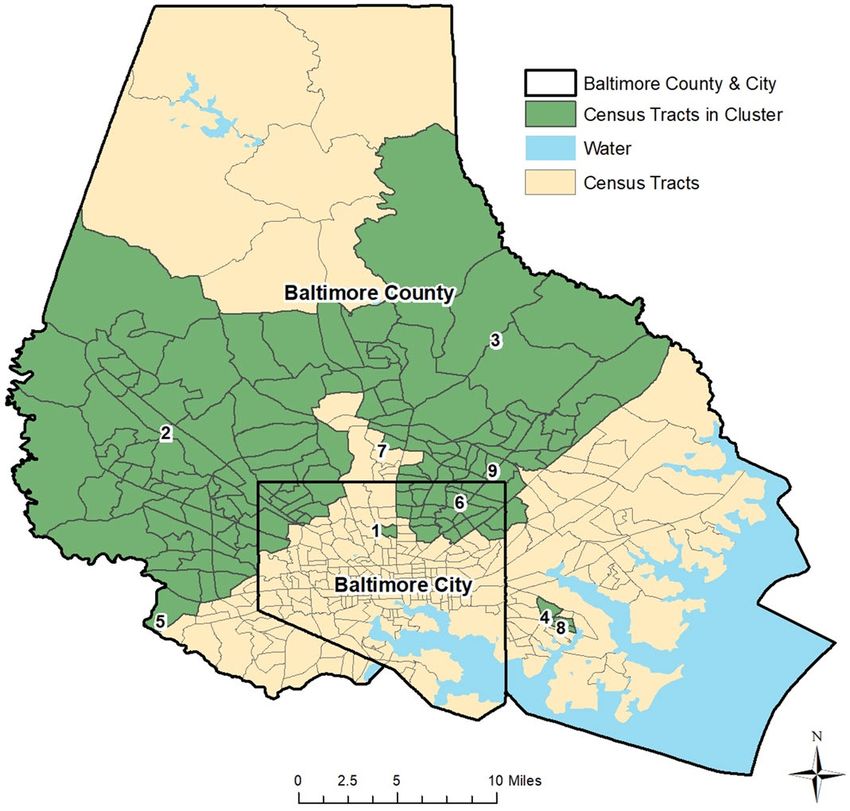
www.nature.com/scientificreports/

                                 Figure 3.  Prevalence of self-reported symptoms up to January 5th, 2021.

                                 Figure 4.  Space–time clusters of COVID Control Symptoms in Baltimore County & City, Maryland.

                                 information. For COVID Control to be effective, large participation is required. Currently, spatial science and
                                 machine learning algorithms do a sufficient job in locating clusters but casting a wider net would certainly bolster
                                 the validity of the algorithms. Towards this objective, the strategies we are developing are twofold. Firstly, efforts
                                 in advertising and creating awareness are needed to increase the number of new participants, especially in rural
                                 regions, and to get a better resolution of data across the United States. Secondly, alongside more users, we need
                                 to increase a sustained engagement of participants along time, including asymptomatic users’ CLI submissions.
                                 The latter is critical for a real-time and continuous monitoring of the health situation across the country, and to
                                 validate the models further. We found the majority of users (83.6%) self-report over a maximum of 14 days, the
                                 same time frame of common symptoms expression (see Fig. 2). We also acknowledge that there is likely a user
                                 bias which may not encompass those who are still skeptical to share data, mistrust the scientific community,

Scientific Reports |   (2021) 11:4660 |               https://doi.org/10.1038/s41598-021-84145-5                                                     5

                                                                                                                                                Vol.:(0123456789)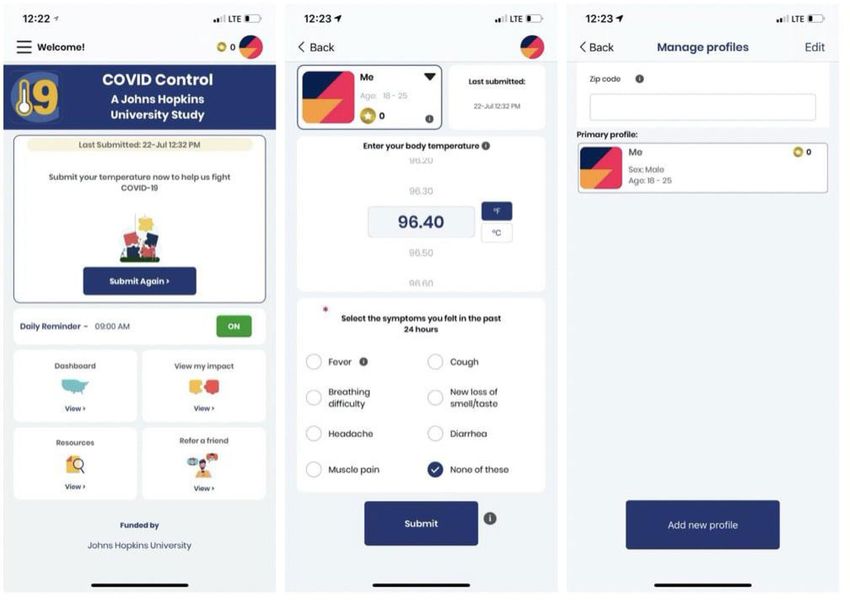
www.nature.com/scientificreports/
Figure 5. Space–time clusters of Simulated COVID Control Symptoms in Maryland on July 6th, 2020.
Figure 6. Space–time clusters of Simulated COVID Control Symptoms in Maryland on June 23rd, 2020.
and those who are disproportionately affected by COVID-19. Improving public health campaigns and public
relations via advertising could reduce user bias.
With a larger userbase and further validation, this tool could be used to support a strategic response to prepare
for an increase in hospitalizations and improved allocation of health care personnel and resources. Future work
will implement a prospective cluster detection approach, which can detect “active” or emerging clusters of CLI
symptoms, to give the most up-to-date public health overview18,19. Since data in this report focused on Baltimore
City and County in Maryland where we had the most users/entries, and COVID-19 data isn’t available at a reso-
lution smaller than county, we have not validated the clusters’ location with confirmed case data. However, as
the user base grows, validation work will be carried out. Cross-correlation analyses can also identify significant
temporal lags between COVID-19 cases and symptoms collected from our app, which can improve upon our
current analytical approach by informing the cluster analysis and validating our findings. In other words, we
can potentially predict when and where COVID-19 outbreaks may arise in advance if we find a strong positive
association between temporally lagged symptoms and confirmed COVID-19 cases. A strong positive association
was already found in Baltimore City and County between new loss of taste/smell and positive cases of COVID-
19. We expect that more data will increase the strength of associations between other symptoms, such as fever
Scientific Reports | (2021) 11:4660 | https://doi.org/10.1038/s41598-021-84145-5 6
Vol:.(1234567890)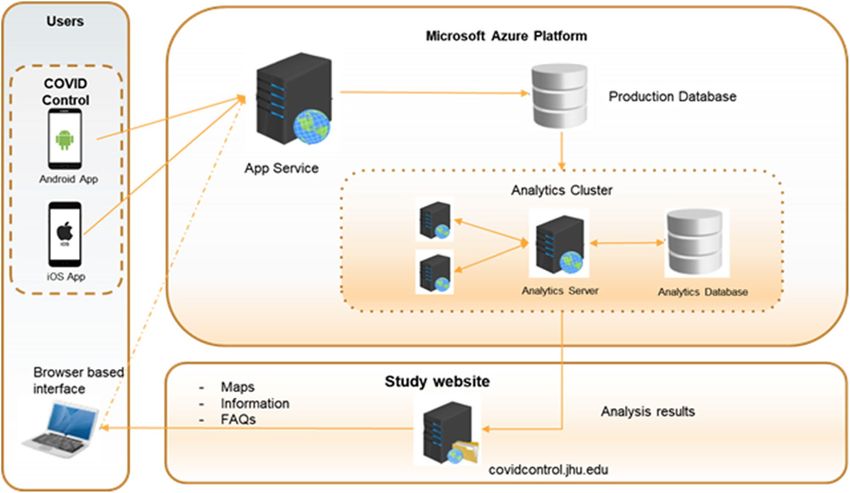
www.nature.com/scientificreports/
County Cluster duration (days) Date cluster first identified Last day cluster identified
Allegany 9 June 6th June 14th
Anne Arundel 22 June 6th June 23rd
Baltimore City 22 June 6th June 23rd
Baltimore County 22 June 6th June 23rd
Calvert 0 None None
Caroline* 12 June 6th; June 23rd June 17th; June 23rd
Carroll 22 June 6th June 23rd
Cecil 22 June 6th June 23rd
Charles 0 None None
Dorchester 0 None None
Frederick 22 June 6th June 23rd
Garrett 13 June 6th June 19th
Harford 22 June 6th June 23rd
Howard 22 June 6th June 23rd
Kent 22 June 6th June 23rd
Montgomery 22 June 6th June 23rd
Prince George’s 22 June 6th June 23rd
Queen Anne’s 22 June 6th June 23rd
Somerset 0 None None
St. Mary’s 0 None None
Talbot 1 June 23rd June 23rd
Washington 0 None None
Wicomico 0 None None
Worcester 0 None None
Table 1. Space–time cluster results using our simulated dataset in Maryland between May 26th and June 23rd,
2020. *Caroline County exhibited no significant clusters between June 18th and June 22nd; then contained a
space–time cluster of CLI-symptoms on June 23rd.
and other important COVID-19 related outcomes such as hospitalizations, helping to identify appropriate lags
for each symptom-outcome pair which will subsequently improve the spatiotemporal cluster detection analysis.
Preemptive identification of potential clusters of COVID-19 can also be used by state and local authorities
to develop a discriminative approach to reopening their economies guided by regionally specific syndromic
information. The US government has included as a first criterion to be able to start the de-escalation plan
to demonstrate a downward trajectory of flu and COVID-19 symptoms for at least 14 days, (taken from the
guidelines that define the conditions that each state must meet before proceeding to the phased opening)20.
Beyond the initial phase of reopening, this analysis would also potentially enable state and local governments
to recalibrate their approach for specific counties/census tracts based on the observed trends. However, this
type of approach for syndromic surveillance in isolation cannot address the issue of identifying asymptomatic
carriers, but it can be used to optimize global testing strategies. COVID Control app and analytics are being
continuously updated to consider the most recent discoveries and latest knowledge and integrate state-of-the-art
approaches for identifying new cases as well as making it a useful tool to develop hypotheses of transmission.
Finally, by immediately reporting the results of our analysis in a publicly available interactive dashboard, this
tool allows citizens to actively participate in the surveillance of the pandemic, which increases their awareness
of the disease and their response to i t21.
Methods
COVID Control: A Johns Hopkins University Study was approved by the Johns Hopkins School of Public Health
Institutional Review Board (IRB number IRB00012283). The study has been performed in accordance with the
institutional guidelines and regulations. All participants have voluntarily agreed to be involved in the study by
accepting an IRB approved informed consent form when installing the app.
COVID control app development. We developed an iOS and an Android app to gather symptom data
from users. The app is available for free download from the Apple App Store and Google Play Store. Users are
invited to voluntarily record their body temperature and, if applicable, the presence in the previous 24 h of seven
other symptoms that have been found to be good predictors of COVID-19: fever, cough, breathing difficulties,
new loss of taste and/or smell, diarrhea, headache and fatigue11. Among them, breathing difficulties, and new
loss of taste and/or smell are more specific indicators of COVID-1911,22–24. In addition, 88% of COVID-19 cases
detected through surveillance and tests had a fever, making it a primary symptom for detecting the d isease25. A
recent study also suggests body temperatures to be the most relevant determinant of c ontagions26. The app users
Scientific Reports | (2021) 11:4660 | https://doi.org/10.1038/s41598-021-84145-5 7
Vol.:(0123456789)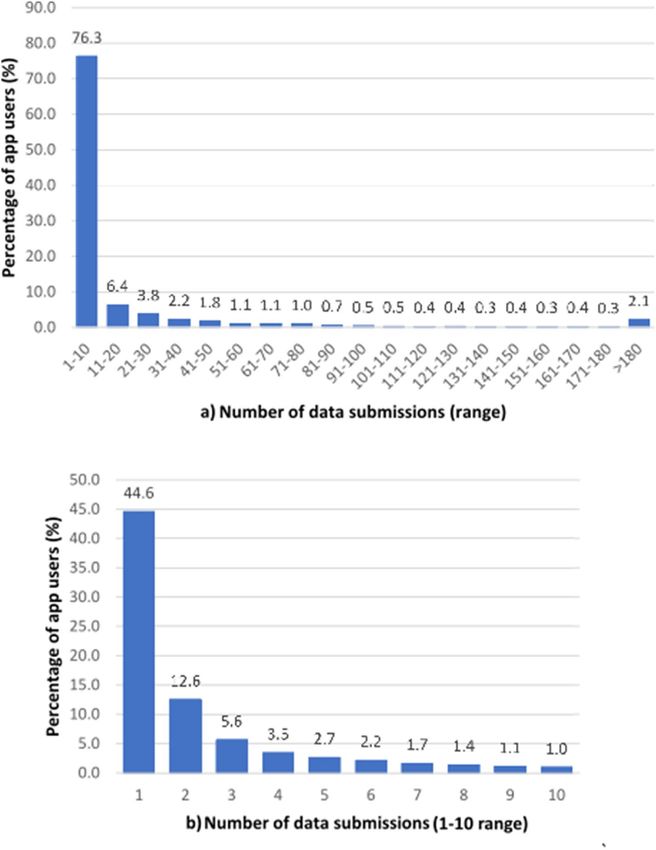
www.nature.com/scientificreports/
Figure 7. From left to right: App main screen, app submission screen, and app profile screen.
are instructed to use any available thermometer to measure and self-report their body temperature along with
the observed symptoms.
The app does not record any individually identifiable health information and study participation is completely
voluntary. Any individual above the age of 13 residing in the US is eligible for the study. To participate, users
create an anonymous profile on the app by submitting their sex (‘Male’, ‘Female’, ‘Prefer not to say’) and age range
(starting from 13 in increments of 5) (Fig. 7). Information of the user location is collected at every submission.
This can be via the phone’s GPS location (if access to location services is allowed) or by manual entry of the zip
code by the user. All the information is assigned to a unique randomly generated ID and stored without any
personal identification tags to a Microsoft Azure SQL database hosted on the cloud. When analyzed, the collected
data is aggregated and combined with data from other users within the same county to contribute to the analytics.
The data collected through the app is aggregated by county and is presented back to users as an interactive
dashboard, which provides a map of the symptom distribution, as well as time series plots of symptom rates. The
dashboard allows users to focus on a specific geographic area, but also provides an overview for the entire United
States. A link to the dashboard (Fig. 8) embedded in the app allows the users to quickly visualize the dataset they
are contributing to directly from their mobile device. A desktop version of the dashboard is also available on the
App website both to app users as well as the public. The complete description of the data flow is depicted in Fig. 9.
Cluster detection analysis. We utilize scan statistics, which are commonly used in epidemiology to
detect and evaluate spatial, temporal, or spatiotemporal clustering of disease c haracteristics27,28. Scan statistics
are available using the free software SaTScan29. SaTScan has been widely used in both disease and syndromic
surveillance, including dengue fever and c hikungunya17,30,31, sexually transmitted d isease32, foodborne i llness33,
34,35 31,36,37
respiratory infections and common illnesses , and COVID-19 , among countless others. Essentially, scan
statistics determine if the number of disease cases/symptoms in a defined area and proximal in time are greater
than the expected number of cases/symptoms, such as the underlying population contained in the study area
or distribution of point-level events. Our goal is to monitor the evolution of anomalous clusters of COVID-like
illness (CLI) symptoms. We present an example at the daily and census-tract levels in Baltimore County and City
and the U.S. state of Maryland. These locations were chosen since most users in the initial phase data collection
phase are located in counties in close proximity to Johns Hopkins University.
We selected a retrospective approach and statistical model that detects significant historical clusters of CLI
symptoms. The statistic utilizes circles (scanning window) that are centered on points (user locations with
symptoms) and move (scan) systematically across a study area to identify clusters of symptoms (each window
Scientific Reports | (2021) 11:4660 | https://doi.org/10.1038/s41598-021-84145-5 8
Vol:.(1234567890)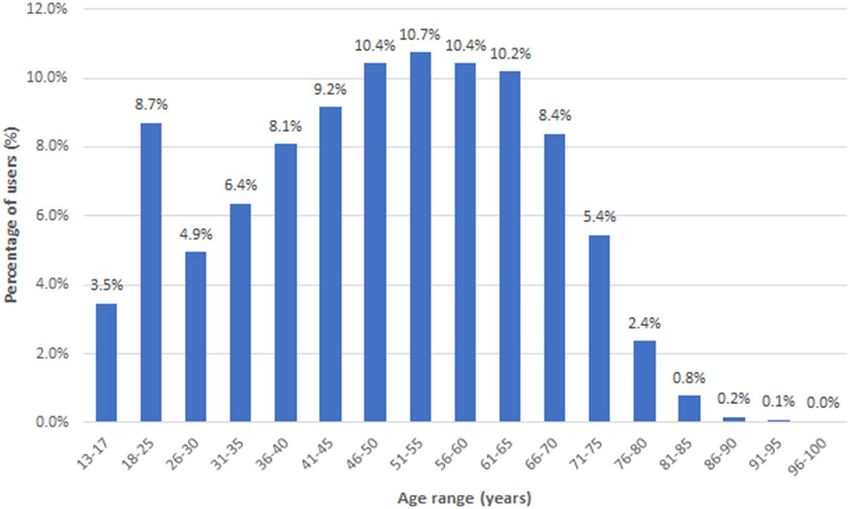
www.nature.com/scientificreports/
Figure 8. The dashboard provides an overview of submitted data across United States counties including entry
and symptom numbers (screenshot provided for January 5, 2021). Clicking on a county provides summary data
for that specific area.
Figure 9. System design diagram representing the flow of data including the data collection from the apps, data
storage and analysis in a Microsoft Azure server, and visualization of results in our Dashboard and website.
counts the number of points within, while each scanning window is a potential cluster). Each scanning window
is expanded in space to include neighboring points until a user-defined maximum radius is reached—here we
selected 25 km. Then, the number of observed symptoms within each window is compared to the expected num-
ber of symptoms. Before statistical inference is computed, a potential cluster is characterized when a scanning
window contains more observed than expected symptoms. Space–time scan s tatistics28 incorporate a temporal
dimension, where the scanning window is defined as a cylinder or three-dimensional ellipse, and the height
represents the temporal dimension (e.g. time interval). The location, size, and duration of statistically significant
Scientific Reports | (2021) 11:4660 | https://doi.org/10.1038/s41598-021-84145-5 9
Vol.:(0123456789)www.nature.com/scientificreports/
clusters of disease cases are subsequently reported. Here, we use a retrospective, space–time permutation model.
Monte Carlo simulation was used to compute statistical inference of the reported clusters of CLI symptoms;
while all clusters are significant at the p < 0.05. To protect the privacy of the individuals who reported symptoms,
we show the census tracts that belong to a significant cluster, rather than the spatial distribution of the points
within each.
We also applied a cross-correlation function to identify the strongest association between each symptom avail-
able in the app and a variety of outcomes at the state-level in Maryland, including new positive tests, COVID-19
related deaths, and h ospitalizations38. The main purpose is to determine if clusters of symptoms may occur in
advance of clusters of COVID-19 outcomes.
Finally, we utilized a prospective Bernoulli (i.e. cases/controls) version of the above mentioned space–time
scan statistic on the simulated dataset to demonstrate how our analytics would work when our user base
increases. The model was run every day from June 6th to June 23rd, 2020 to understand the space–time evolu-
tion of the detected clusters in Maryland. The maximum spatial extent for identified clusters was set to 2% of
the population (i.e. simulated entries), while the maximum temporal extent for any identified cluster was set to
14 days. The mechanisms of the prospective model are essentially the same as the abovementioned retrospective
model, except historical clusters are disregarded and only “active” and emerging clusters are reported on the
most current day of analysis.
Ethics committee approval. COVID Control: A Johns Hopkins University Study was approved by the
Johns Hopkins School of Public Health Institutional Review Board (IRB number IRB00012283). All participants
have voluntarily agreed to be involved in the study by accepting an IRB approved consent form when installing
the app.
Data availability
All data generated or analyzed during this study are included in this published article (and its Supplementary
Information files).
Received: 13 August 2020; Accepted: 12 February 2021
References
1. Graham, L. M. Observations from the COVID-19 Pandemic. Pediatr Allergy Immunol. Pulmonol. https://doi.org/10.1089/ped.
2020.1181 (2020).
2. Mian, M. S., Razaq, L., Khan, S., Hussain, N. & Razaq, M. Pathological findings and management of COVID-19 patients: A brief
overview of modern-day pandemic. Cureus 12, 2 (2020).
3. Gussow, A. B., Auslander, N., Wolf, Y. I. & Koonin, E. V. Prediction of the virus incubation period for COVID-19 and future
outbreaks. BMC Biol. https://doi.org/10.1101/2020.05.19.104513 (2020).
4. Kinsa’s atypical illness signal is a leading indicator of COVID-19 outbreaks. https://www.kinsahealth.co/kinsas-illness-signal-a-
leading-indicator-covid-19-outbreaks/.
5. He, W., Yi, G. Y. & Zhu, Y. Estimation of the basic reproduction number, average incubation time, asymptomatic infection rate,
and case fatality rate for COVID-19: Meta-analysis and sensitivity analysis. medRxiv https://doi.org/10.1101/2020.04.28.20083
758 (2020).
6. Silverman, J. D., Hupert, N. & Washburne, A. D. Using influenza surveillance networks to estimate state-specific prevalence of
SARS-CoV-2 in the United States. Sci. Transl. Med. 1126, 1–13 (2020).
7. Hopkins, C., Surda, P., Whitehead, E. & Nirmal Kumar, B. Early recovery following new onset anosmia during the COVID-19
pandemic-an observational cohort study. J. Otolaryngol. https://doi.org/10.1186/s40463-020-00423-8 (2020).
8. Galvan Casas, C. et al. Classification of the cutaneous manifestations of COVID-19: A rapid prospective nationwide consensus
study in Spain with 375 cases. Br. J. Dermatol. https://doi.org/10.1111/bjd.19163 (2020).
9. Home - COVIDcast - Delphi Research Group - Carnegie Mellon University. https://c ovidc ast.c mu.e du/?s ensor=d octor-v isits-s moot
hed_adj_cli&level=county®ion=42003&date=20200525&signalType=value.
10. ZOE. COVID Symptom Study - Help slow the spread of COVID-19. https://covid19.joinzoe.com/.
11. Menni, C. et al. Real-time tracking of self-reported symptoms to predict potential COVID-19. Nat. Med. https://doi.org/10.1038/
s41591-020-0916-2 (2020).
12. Miller, A. C., Singh, I., Koehler, E. & Polgreen, P. M. A smartphone-driven thermometer application for real-time population-and
individual-level influenza surveillance. Clin. Infect. Dis. https://doi.org/10.1093/cid/ciy073 (2020).
13. Dalziel, B. D. et al. Urbanization and humidity shape the intensity of influenza epidemics in U.S. cities. Science 362, 75–79 (2018).
14. Pung, R. et al. Investigation of three clusters of COVID-19 in Singapore: implications for surveillance and response measures.
Lancet 395, 1039–1046 (2020).
15. Sarwar, S., Waheed, R., Sarwar, S. & Khan, A. COVID-19 challenges to Pakistan: Is GIS analysis useful to draw solutions?. Sci.
Total Environ. 730, 139089 (2020).
16. Desjardins, M. R., Hohl, A., Delmelle, E. & Casas, I. Identifying and visualizing space-time clusters of vector-borne diseases.
Geospatial Technol. Hum. Well-Being Heal. Forthcoming, (2020).
17. Whiteman, A., Desjardins, M. R., Eskildsen, G. A. & Loaiza, J. R. Detecting space-time clusters of dengue fever in Panama after
adjusting for vector surveillance data. PloS Neglect. Trop. Dis. https://doi.org/10.1371/journal.pntd.0007266 (2019).
18. Kulldorff, M. Prospective time periodic geographical disease surveillance using a scan statistic. J. R Stat. Soc. Ser. A Stat. Soc. 164,
61–72 (2001).
19. Kulldorff, M. & Kleinman, K. Comments on ‘A critical look at prospective surveillance using a scan statistic’ by T. Correa, M.
Costa, and R. Assunção. Stat. Med. 34, 1094–1095 (2015).
20. Opening Up America Again | The White House. https://www.whitehouse.gov/openingamerica/.
21. Biddlestone, M., Green, R. & Douglas, K. M. Cultural orientation, power, belief in conspiracy theories, and intentions to reduce
the spread of COVID-19. Br. J. Soc. Psychol. https://doi.org/10.1111/bjso.12397 (2020).
22. Menni, C. et al. Loss of smell and taste in combination with other symptoms is a strong predictor of COVID-19 infection. medRxiv
https://doi.org/10.1101/2020.04.05.20048421 (2020).
23. Moein, S. T. et al. Smell dysfunction: A biomarker for COVID-19. Int. Forum Allergy Rhinol. https://doi.org/10.1002/alr.22587
(2020).
Scientific Reports | (2021) 11:4660 | https://doi.org/10.1038/s41598-021-84145-5 10
Vol:.(1234567890)www.nature.com/scientificreports/
24. Lechien, J. R. et al. Loss of smell and taste in 2013 European patients with mild to moderate COVID-19. Ann. Intern. Med. https://
doi.org/10.7326/M20-2428 (2020).
25. Bi, Q. et al. Epidemiology and transmission of COVID-19 in 391 cases and 1286 of their close contacts in Shenzhen, China: A
retrospective cohort study. Lancet Infect. Dis. https://doi.org/10.1016/S1473-3099(20)30287-5 (2020).
26. Rios, V. & Gianmoena, L. Is there a link between temperatures and COVID-19 contagions? Evidence from Italy. medRxiv https://
doi.org/10.1101/2020.05.13.20101261 (2020).
27. Kulldorff, M. A spatial scan statistic. Commun. Stat. Theory Methods 26, 1481–1496 (1997).
28. Kulldorff, M., Heffernan, R., Hartman, J., Assunção, R. & Mostashari, F. A space–time permutation scan statistic for disease out-
break detection. PLoS Med. 2, e59 (2005).
29. SaTScan - Software for the spatial, temporal, and space-time scan statistics. https://www.satscan.org/.
30. Desjardins, M. R., Whiteman, A., Casas, I. & Delmelle, E. Space-time clusters and co-occurrence of chikungunya and dengue fever
in Colombia from 2015 to 2016. Acta Trop. 185, 77–85 (2018).
31. Desjardins, M. R., Hohl, A. & Delmelle, E. M. Rapid surveillance of COVID-19 in the United States using a prospective space-time
scan statistic: Detecting and evaluating emerging clusters. Appl. Geogr. 118, 102202 (2020).
32. Owusu, C., Desjardins, M. R., Baker, K. M. & Delmelle, E. Residential mobility impacts relative risk estimates of space-time clusters
of chlamydia in kalamazoo county, michigan. Geospat. Health 14, 254–264 (2019).
33. Kvit, A., Davis, B., Jacobs, J. & Curriero, F. C. Adjusted, non-euclidean cluster detection of vibrio parahaemolyticus in the chesa-
peake bay, usa. Geospat. Health 14, 211–218 (2019).
34. Horst, M. A. & Coco, A. S. Observing the spread of common illnesses through a community: Using geographic information systems
(GIS) for surveillance. J. Am. Board Fam. Med. 23, 32–41 (2010).
35. van den Wijngaard, C. C. et al. Syndromic surveillance for local outbreaks of lower-respiratory infections: Would it work?. PLoS
ONE 5, 2 (2010).
36. Ferreira, R. V. et al. Applying a prospective space-time scan statistic to examine the evolution of COVID-19 clusters in the state
of Sao Paulo, Brazil. medRxiv https://doi.org/10.1101/2020.06.04.20122770 (2020).
37. Hohl, A., Delmelle, E. & Desjardins, M. Rapid detection of COVID-19 clusters in the United States using a prospective space-time
scan statistic: An update. https://github.com/CSSEGISandData/COVID-19.
38. Zhou, W., Wang, A., Xia, F., Xiao, Y. & Tang, S. Effects of media reporting on mitigating spread of COVID-19 in the early phase
of the outbreak. Math. Biosci. Eng. 17, 2693–2707 (2020).
Acknowledgements
We thank John Rattray (Sparkwear) for his support developing the app, ITC Infotech’s Digital Experience (DX)
team for further enhancing the app design, interface and UX, White and Case LLP for their guidance, Reina
Murray and Mara Blake of the Department of Data Services of Johns Hopkins’ Sheridan Libraries and Museums
for providing technical support for our dashboard, John Brown for his support with Microsoft Azure Server,
Andrea Luxemberg (Johns Hopkins Medicine Technology Innovation Center) and Christian Tedjasukmana
(University of Vermont Medical Center) for their contribution on user experience, and Jeff Trotz (Capitol Tech-
nology University). We would like to especially thank all the participants.
Author contributions
The app development and data analytics and interpretation have been done by A.G., S.R., K.A., M.R.D., A.K.,
A.C., B.F., and T.S. M.S., A.G., S.R., K.A. have equally contributed to writing the manuscript. The study has been
equally led and continuously supervised by F.C., R.E.C., and R.S. All authors have contributed to the concep-
tion and design of the study and to the interpretation of results. All authors meet all four criteria for authorship
defined in the ICMJE Recommendations.
Competing interests
The authors declare no competing interests.
Additional information
Supplementary Information The online version contains supplementary material available at https://doi.org/
10.1038/s41598-021-84145-5.
Correspondence and requests for materials should be addressed to A.G.
Reprints and permissions information is available at www.nature.com/reprints.
Publisher’s note Springer Nature remains neutral with regard to jurisdictional claims in published maps and
institutional affiliations.
Open Access This article is licensed under a Creative Commons Attribution 4.0 International
License, which permits use, sharing, adaptation, distribution and reproduction in any medium or
format, as long as you give appropriate credit to the original author(s) and the source, provide a link to the
Creative Commons licence, and indicate if changes were made. The images or other third party material in this
article are included in the article’s Creative Commons licence, unless indicated otherwise in a credit line to the
material. If material is not included in the article’s Creative Commons licence and your intended use is not
permitted by statutory regulation or exceeds the permitted use, you will need to obtain permission directly from
the copyright holder. To view a copy of this licence, visit http://creativecommons.org/licenses/by/4.0/.
© The Author(s) 2021, corrected publication 2021
Scientific Reports | (2021) 11:4660 | https://doi.org/10.1038/s41598-021-84145-5 11
Vol.:(0123456789)You can also read