Abundance and Distribution of Wolverine in the Kootenay Region 2013 Field Season Report: Purcell Mountains
←
→
Page content transcription
If your browser does not render page correctly, please read the page content below
Abundance and Distribution of Wolverine in the
             Kootenay Region

  2013 Field Season Report: Purcell Mountains

                                Prepared For:

Ministry of Forests Lands and Natural Resource Operations and Columbia Basin
                                    Trust

                                 Prepared By:

                       Andrea Kortello, M.Sc., R.P. Bio.

                                     and

                      Doris Hausleitner, M.Sc., R.P. Bio.

                       Seepanee Ecological Consulting

                             February 2014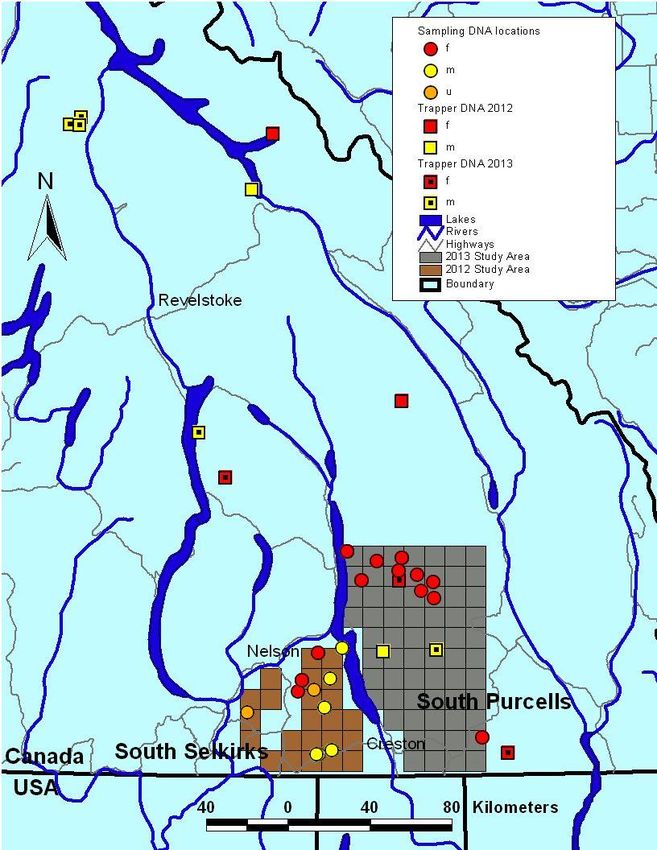
Abstract
Wolverine (Gulo gulo) is a species of conservation priority provincially and nationally
and is harvested regionally, yet no inventory has been conducted to estimate population
abundance and connectivity in the southern portion of the Kootenays. Thus, a non-
invasive genetic study was initiated in 2012 with the objectives of estimating abundance
and assessing meta-population connectivity to inform harvest management and contribute
to international conservation efforts. Our estimates of population size in the south Purcell
Mountains were lower than previously published habitat-based values. We also found
evidence of low genetic connectivity between the south Purcell population and other
populations in southeastern British Columbia. At the same time, we detected at least one
individual that had dispersed from the southern Rocky Mountains. Based on these revised
population estimates, recruitment may not be sufficient to meet recent levels of harvest.
We also detected wolverine south of Highway 3 in the Purcells in habitat contiguous with
Montana and Idaho.

                                                                                          1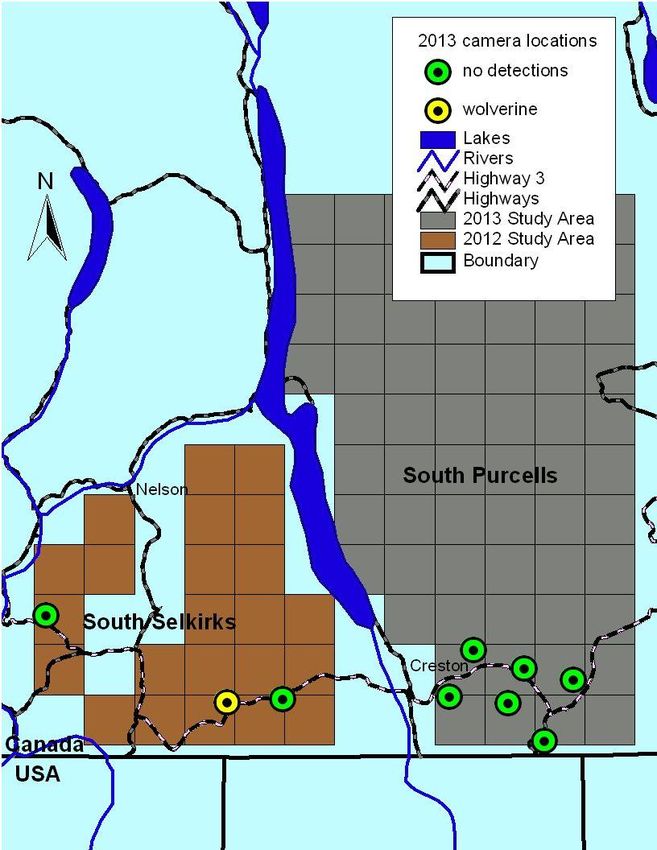
Introduction
Wolverine (Gulo gulo) is a species of conservation priority provincially and nationally
(BC CDC 2013, COSEWIC 2003) and is classified as Identified Wildlife under the Forest
and Range Practices Act (MWLAP 2004). Population estimates for British Columbia
have been derived from habitat modeling based on mark-recapture in the Omenica and
Northern Columbia Mountains (Lofroth and Krebs 2007) but lack verification for much
of the province, including the southern portion of the Kootenays. Considering that
adjacent U.S. populations are known to be at critically low levels (USFWS 2013), with
wolverine absent from potentially viable habitat, reliable abundance estimates are crucial
for species conservation in the region.

In the Kootenays, wolverine populations are characterized by small and declining fur
yields (~8 pelts/year) and harvest rates in parts of the region may be unsustainable
(Lofroth and Ott 2007). Populations with high connectivity are resilient to local
overharvest or high mortality from other sources because of source/sink dynamics
(Pulliam 1988). Although genetic evidence indicates increasing population fragmentation
in a north to south gradient in B.C. (Cegelski et al. 2006), the extent of gene flow
between neighboring ranges in the southern Kootenay region is unknown. Hence,
assessing connectivity is important to local population resilience and evaluating harvest
sustainability.

Barriers to dispersal include transportation routes, hydroelectric and residential
development and land use changes (Gardner et al. 2010, Krebs et al. 2007, Slough 2007,
Austin 1998). Similarly, wolverine habitat use and density are associated negatively with
winter recreation, forest harvest, and positively with roadless areas (Fisher et al. 2013,
Krebs et al. 2007). Mapping occupied habitat in the Kootenays and identifying factors
contributing to the persistence of wolverine in these areas is an essential step to
identifying where conservation efforts to improve habitat and connectivity should be
focused. Additionally, the Kootenay region is one of only a few areas identified as a
potential corridor for trans-boundary movement of wolverine into the US (McKelvey et
al. 2011, Schwartz et al. 2009, Singleton et al. 2002). Such movement is critical for the
persistence of US populations, and this project will provide vital information for
wolverine conservation in the trans-boundary region.

Project objectives were to: (1) assess occupancy/abundance of wolverine in the Purcell
Mountains; (2) assess genetic connectivity between the Selkirk and Purcell populations;
(3) evaluate current harvest levels; (4) evaluate broad-scale habitat factors that are
associated with wolverine presence and; (5) cooperate inter-jurisdictionally for wolverine
research.

                                                                                         2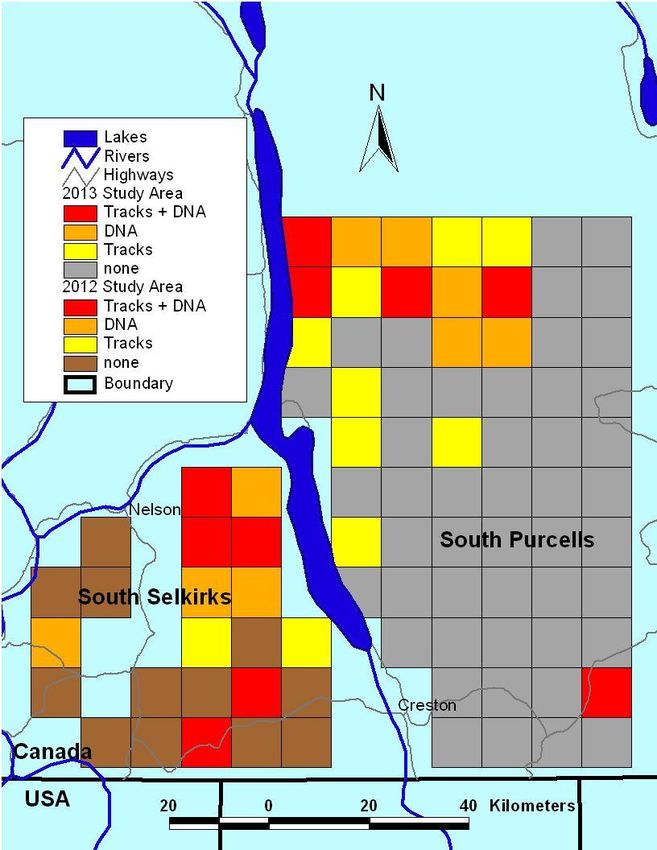
Methods
Field surveys

The southern Purcell Mountains study area was partitioned into 10 by 10 km cells that
approximate the minimum size of a home range. These 65 quadrats were sampled twice
in 21 day sampling intervals, from February to April, 2013 (Figure 1). Additionally, three
sites from the South Selkirk region were resampled in 2013 (January-April). Because of
the rugged nature of the terrain, sites within cells were selected for ease of access by
helicopter, snow machine or skis, using local knowledge of wildlife movements when
available. Hair trap sites were created by affixing a bait item (beaver or deer quarter or
deer head) to a tree approximately two meters from the ground or snow surface to entice
the animal to climb (Fisher 2004). The bait item was nailed to the tree and wrapped
several times in wire. The tree was wrapped with barbed wire to capture hair. During
each check, the barb wire was examined for hairs or hair tufts, and the bait replenished if
necessary. Hairs were collected with forceps and stored in paper envelopes in a dry
environment.

We utilized six Rencoynx Rapidfire trail cameras during the first session of sampling
(approximate duration three weeks) and nine during the second (approximate duration
four weeks; Figure 1). These cameras were deployed in sites in the Selkirk and Purcell
ranges adjacent to Highway 3 to increase wolverine detectability in the event that they
were visiting sites and not leaving samples and to assess linkage zones for wolverine
across this putative barrier.

Additionally, we submitted a letter to all trappers in the provincial database in the
Kootenay region soliciting genetic samples from wolverines obtained by trappers. From
each carcass a tissue sample was taken and carcasses were necropsied to determine body
condition, age, sex and number of pregnancies. Necropsy data was submitted into a
regional database and will contribute to long-term modeling of population structure.

                                                                                          3
Figure 1. Trail camera locations along Highway 3 to detect wolverine at bait stations in
the south Selkirk (2012) and south Purcell Mountain (2013) study areas.
4Genetic Analysis
Hair samples were submitted to Wildlife Genetics International in Nelson B.C. for dioxy
ribonucleic acid (DNA) analysis. Samples that did not contain guard hairs or >5 underfur
were screened out because of insufficient genetic material. From the remaining samples,
DNA was extracted using QIAGEN DNeasy Tissue kits, following the manufacturer’s
instructions (Qiagen Inc., Toronto, ON).
Species identification was based on a sequence-based analysis of a segment of the
mitochondrial 16S rRNA gene (Johnson and O’Brien 1997). For samples that yielded
wolverine DNA, WGI utilized multilocus genotyping, consisting of a ZFX/ZFY sex
marker, and 12 additional microsatellite markers (13 markers total) for individual
identification.
Occupancy and abundance
We used the single-season model in program PRESENCE (MacKenzie et al. 2002) to
estimate the proportion of sample stations occupied by wolverine. A non-detection at a
surveyed site could have meant wolverine were not present at the site or that we failed to
detect an individual when it was present. PRESENCE uses a joint likelihood model to
estimate the probability of missing a species when it is present at the site (p =
detectability) and the probability that a site is occupied (Ψ). To estimate these parameters
repeat observations need to be conducted over a period of time during which site
occupancy is assumed to be constant. In this way, a non-detection from a site with at least
one detection can be treated as a false negative and the detection probability can be
estimated.
We used both track detections and genetic data to estimate occupancy. Locations of
sampling sites and genetic samples were mapped in ARCVIEW 3.1 (ESRI Inc. 1998,
Jenness 2005).
Estimates of occupancy can act as a surrogate for abundance for territorial species such as
wolverine when the sites sampled approximate territory sizes (MacKenzie et al. 2006).
We selected a grid resolution (10 x 10 km) that corresponded to a minimum home range
size for female wolverine. However, average home range size in the Columbia Mountains
was 300 km2 and 1000 km2 for exclusive female and overlapping male wolverine,
respectively (Krebs et al. 2007). We applied the female density to our occupied habitat in
the south Purcells and assumed a 1:1 sex ratio (Magoun 1985, Banci 1987) to derive a
population estimate (female density times two), recognizing that animal distribution,
population structure, habitat quality and edge effects may affect the accuracy of this
estimate.
5Additionally, a simple Lincoln-Peterson Method was used to estimate the population
independent of occupancy; N = MN/R, where N is the estimated population size, M is the
number of animals identified in the first sampling session, R is the number of animals
identified in the first session which are recaptured in the second session and N is the total
number of animals identified in the second sampling session (Seber 1982).
Population genetics
The program POPULATIONS (Langella 1999) was used to calculate shared allele
distance (Chakraborty and Jin 1993), a simple measure of the degree of relatedness
between individual genotypes in our samples. The proportion of shared alleles is
estimated by PSA = ∑u S / 2u where S is the number of shared alleles, summed over all
loci u. Distance between individuals is estimated by DSA = 1- PSA. To illustrate population
substructure, these distances were used to plot a neighbour-joining tree (Saitou and Nei
1987) in DRAWTREE (part of the PHYLIP program package: Felsenstein 2013).
Results
During the course of the field season we monitored 65 sites in the Purcells and three in
the Nelson and Bonnington ranges (Figure 1). Fourteen field days were required for setup
and an additional 30 days for site monitoring. Other carnivores detected, using snow
tracking, included wolf (Canis lupis), cougar (Puma concolor), lynx (Lynx canadensis),
red fox (Vulpes vulpes) and coyote (Canis latrans; Appendix 1).
Using trail cameras, we collected 24,537 images over 9,476 hours of monitoring at bait
sites. Species detected included flying squirrel (Glaucomys sabrinus), American marten
(Martes americana, grey jay (Perisoreus canadensis), stellars jay (Cyanocitta stelleri),
short-tailed weasel (Mustela ermine), red squirrel (Sciurus vulgaris), coyote, wolverine,
bobcat (Lynx rufus), sharp-shinned hawk (Accipiter striatus), hairy woodpecker (Picoides
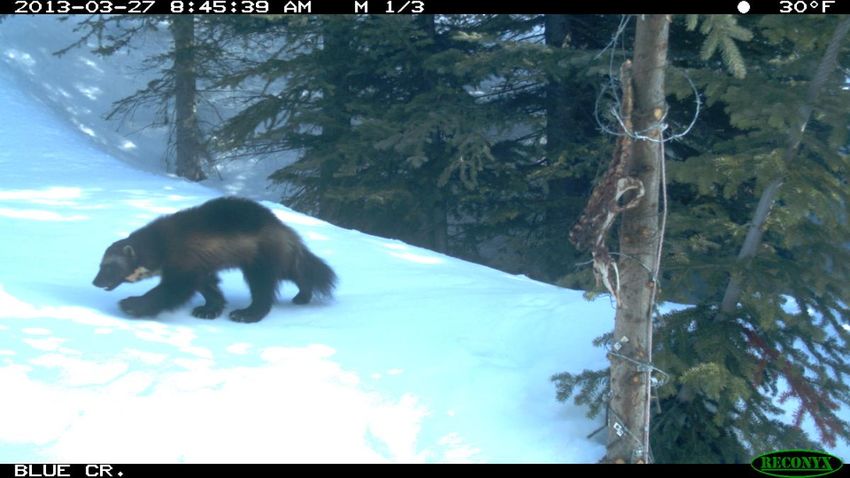
villosus), human (Homo sapien) and mouse (Peromyscus spp.). We detected wolverine at
one site, north of Highway 3 in the Nelson range, close to Kootenay Pass (Figure 1).
6Genetic analysis
We obtained genetic results from 356 hair, tissue, scat and skull samples. The species
identified by mitochondrial DNA analysis included American marten (n = 102),
wolverine (n = 49), deer (Odocileus spp., n =11), cougar (n =7) northern flying squirrel (n
= 6), elk (Cervus canadensis, n = 3), red squirrel (n = 2), coyote (n = 2), short-tailed
weasel (n = 1), human (n = 1) and housecat (Felis catus, n = 1). Wolverine DNA was
detected at ten sites. From those ten sites, we were able to identify eight individual
wolverines, all females (Figure 2). At one of the three sites we re-sampled in 2013 in the
south Selkirk we were able to confirm an individual identification where we had
inadequate samples in 2012. Another individual in the south Selkirks was identified from
hairs obtained opportunistically on a wolverine track. Both these individuals were
previously detected at other sites in 2012.
Ten wolverine carcasses (six males, four females) were submitted by the trapping
community in 2013 (Figure 2). This is in addition to four (two males, two females)
submitted in 2012.
One of the submitted carcasses was a female wolverine that had been previously captured
in a radio-telemetry study in the Flathead River in 2012. She was trapped just outside the
south Purcell study area near Yahk in 2013 after travelling a distance of approximately
100 km across the East Kootenay Trench, likely crossing Highway 93 and the Koocanusa
Reservoir (Figure 2).
7Figure 2. Wolverine non-invasive hair trapping results showing site locations and
wolverines detected (orange circles) in the south Selkirk (2012) and south Purcell
Mountains (2013). An individual may be represented by more than one sample. M is
male, F is female and U is unknown sex. Trapper carcass collection is represented by
squares (2012) and squares with dots (2013). Two carcasses in 2013 lacked location
information and were assigned to a management unit but not plotted on this map.
8Occupancy and abundance
Detections of wolverine occurred by snow tracking and/or genetic analysis (Figure 3).
The naïve occupancy estimate, or number of cells occupied in the south Purcell
Mountains was 27.3%. Taking detection rates into account (by calculating the probability
of missed wolverine observations), the estimate of wolverine occupancy in the south
Purcell mountains was 38.3% (SE = 10.2). Two models need to be considered as
competing models (Δ AICc < 2; Table 1). The best model was one in which detection
probabilities changed with sampling session. The probability of detection was 19.8% (SE
= 9.0) in repetition one, 31.6 % (SE =11.5) in repetition two and 47.4 % (SE = 14.2) in
repetition three. The competing model is one in which detection and occupancy is
constant through sampling sessions.
Our occupancy-based population estimate was 17 wolverine for the south Purcell
population. Using mark-recapture, the population was estimated at 18 (SE = 4.83, 95% CI
= 9-27 individuals).
9Figure 3. Wolverine detections by tracks and DNA in the south Selkirk and Purcell
Mountains, 2012 and 2013.
10Table 1. Ranking for models of occupancy (ψ) and detectability (p) for track and genetic
data of Wolverine in the south Purcell Mountains in 2013. Models were developed in
Program PRESENCE and compared using AICc weights of evidence (Burnham and
Anderson 1998).
Model AICc Delta AICc Number of
AICc a Weights Parameters
ψ (.) p(survey specific) b 146.7 0.0 0.50 4
ψ (.) p(.)c 147.1 0.4 0.40 2
ψ (2 groups) p(.)d 151.6 4.3 0.06 4
ψ (2 groups) p(survey specific) 155.1 8.4 0.04 8
a
A Δ AICc > 2 but < 4, provides weak evidence that the model is not the best fit for
the data (Burnham and Anderson 1998).
b
constant ψ, survey specific p= The species has constant occupancy but different
detection rates
c
constant ψ , constant p= The species has constant occupancy and detection rates
d
2 groups, constant p= there are two groups of sites where the species has the same
detection probabilities
11Population genetics
Visual inspection of the neighbour-joining tree shows 10 of 11 wolverines from the south
Purcells clustered on the same branch, and all three wolverines from the central Selkirk
Mountains clustered together as well (Figure 4). Three of four south Selkirk wolverines
share the same branch (Figure 4), although this cluster also includes individuals from the
south Rockies and north Monashees. Individuals from the north Purcells (1), central
Purcells (1), north Monashees (3), south Rockies (1) and central Rockies (2) populations
do not appear to be clustered geographically (Figure 4).
Figure 4. Neighbour-joining tree showing genetic distances between 26 wolverine in the
south Selkirk (SS), central Selkirk (CS), south Purcells (SP),central Purcells (CP), north
Purcells (NP), south Rockies (SR), central Rockies (CR), and north Monashees (NM)
populations, 2012-2013. The three main clusters are the southern Purcells (red circle),
southern Selkirks (green circle), and central Selkirks (blue circle).
12Discussion
This research represents the first on-the-ground attempt to inventory wolverine
populations in the southern Kootenay region. The south Purcell wolverine population was
of particular interest because it had been identified as a management concern with respect
to potential overharvest (Lofroth and Ott 2007).
Compared to 2012 results in the south Selkirks, the south Purcells had lower naïve
(27.3% vs 47.8) and estimated occupancy (38.3% vs 55.4%) rates. Additionally, the south
Purcells had lower detection probabilities (19.8% vs 23.6%; 31.6% vs 39.3%; 47.4% vs
70.7%) in all repetitions (Kortello and Hausleitner 2012).
Lofroth and Krebs (2007) analysis of wolverine habitat in British Columbia rated most of
the southern Purcells as high quality habitat, and the southern Selkirks as moderate.
Given the habitat ratings, and a larger contiguous area in the southern Purcells, we
expected higher wolverine occupancy rates in the southern Purcells than in the southern
Selkirks, but we found the opposite. Contributing factors may be related to harvest, forest
management, prey abundance and habitat fragmentation, and likely a combination of
factors. The south Selkirks has a higher proportion of land in protected areas with
difficult access. Additionally, there is a difference in harvest rates between the two
regions; there has been no reported trapping in the south Selkirk region since before 1985
(Lofroth and Ott 2007). In contrast, average annual harvest rate in the south Purcell
management units sampled (4-5, 4-6, 4-19 and 4-20; 1985-2013; data for 2011 is
unavailable) has been 1.4 wolverine. However, annual harvest is variable with an
increase in the past five years (ten year average (2003-2013) = 1.2, five year average
(2008-2013) = 2.0).
Our estimate of occupancy translates to 17 wolverine based on average home range sizes
(Krebs et al. 2007). This estimate, in addition to the population estimate based on mark-
recapture of 18 (CI 9-27) individuals, is below the published habitat-based estimate of
population size for the south Purcells: 27 (CI 20-39), although confidence intervals
overlap (Lofroth and Ott 2007). Additionally, we sampled a slightly larger area than the
South Purcell population unit boundaries of Lofroth and Ott (2007). For our estimated
population of 18 wolverine, annual recruitment is expected to be around one (Lofroth and
Ott 2007). It appears that, in this population, harvest may be exceeding recruitment in
some years.
Female productivity is strongly linked to body condition and hence food availability,
particularly large ungulate carcasses (Lofroth et al. 2007, Persson 2005). Consequently
net recruitment might be greater in unusually productive environments. However, a
13consistently high (relative to recruitment) harvest rate in the south Purcells might also
explain the large number of females in our genetics sample and apparent lack of
connectivity with other populations. Males have larger home ranges (Krebs et al. 2007)
and are found at lower elevations (Lofroth 2001) than females, making them more
susceptible to harvest. Dispersing wolverine would also be more vulnerable to harvest for
similar reasons. Three of four wolverine harvested in the Purcells in the past two years fit
these criteria (male or disperser).
There was a notable decline in wolverine detections in a north to south gradient in both
the south Selkirk and Purcell Mountains. Fisher et al. (2013) found wolverine more
abundant in rugged areas protected from anthropogenic development, similarly, although
most of the terrain in our study area is quite rugged, the majority of wolverine detections
have been within cells in or immediately adjacent to large protected areas; West Arm
Provincial Park, Darkwoods Nature Conservancy, Purcell Wilderness Conservancy, and
St. Mary’s Alpine Provincial Park. The location of these areas may account for the north
to south gradient in distribution in both ranges.
Despite very small sample sizes for populations, geographic clustering of genotypes
supports other research suggesting some degree of population fragmentation for
wolverine in southeastern British Columbia (Cegelski et al. 2006). The genetic similarity
of the southern Purcell population is somewhat surprising, given the extent of the range
northward and its close proximity to populations in the northern Selkirks. Additionally,
the female wolverine from the Rockies that was later trapped in the southern Purcells
indicates a viable travel corridor across the East Kootenay trench. Unfortunately, from
the timing of when she was last detected in the Rockies, it is unlikely that this individual
contributed reproductively to the south Purcell population prior to harvest. If this is the
case for other dispersers, there is less probability of gene flow or demographic ‘rescue’
by immigrants.
Our camera array did not provide any insights into connectivity in the Purcells across
Highway 3, but a repeat detection of a transboundary wolverine (detected in Idaho in
2011) at Kootenay Pass in the Selkirks highlights the importance of the Kootenay Pass
area for movements between Canadian and US populations. Since DNA was collected at
this site as well, the use of the camera did not improve our ability to detect wolverine but
provided ancillary information on the timing of visits. We obtained DNA from two
wolverine south of Highway 3 near Yahk. This area provides contiguous mountain
habitat into the US without a major road crossing and might be a zone for wolverine
movements into Montana and Idaho.
Our data, somewhat surprisingly suggest lower populations than expected and lower
connectivity between this and other southern British Columbia populations, hence harvest
14should be carefully considered and managed with trapper input. Distinctly clustered
wolverine detections also allude to the possible impact of land management practices
and/or recreational access on wolverine distribution. This research is being expanded into
the central Selkirk region in 2014. This, with continued carcasses donated from trappers,
will increase the sample size of genotyped individuals, and continue to increase the
strength of genetic analysis.
This project is beginning to fill a critical knowledge gap for a species that is a
conservation priority in the U.S. and Canada. This information is crucial for identifying
viable movement linkages and protecting habitat. These results will directly inform
species harvest management. Further work will contribute to the management of crown
land, acquisition of conservation properties, linkages and highway mitigation in the
region. This study compliments similar research on grizzly bears to provide a multi-
species perspective for regional conservation planning. Healthy, connected wolverine
populations are an important ecosystem component of the Columbia River watershed,
will sustain trapping opportunities for B.C. residents, and are critical for species
persistence in the conterminous USA (Cegelski et al. 2006).
15Acknowledgements
We would like to thank Rick Allen and Columbia Basin Trust for financial support for
this project. Additional funding was received from Ministry of Forests Lands and Natural
Resource Operations and the Wolverine Foundation.
We wish to thank Garth Mowat, John Krebs, Becky Philips and Irene Teskey from the
Ministry of Forests, Lands and Natural Resource Operations for financial assistance,
guidance, logistical support, and assistance in the field. Thank you to Mike Knapik for
guidance on proposals and logistics. Thank you to Michael Lucid and Lacy Robinson
from Idaho Fish and Game, Lisa Larson from Parks Canada, Michelle McLellan, Jason
Fisher and Tony Clevenger for continued collaboration and data sharing. Thank you also
to Lydia Allen, Idaho Panhandle National Forests, who provided cameras in 2013.
We especially wish to thank the regional trapping community for turning in wolverine
carcasses, assisting in field operations, and providing bait. Thank you to the Ministry of
Forest Lands and Natural Resource Operations in Cranbrook and Invermere and
Conservation Officer Justyn Bell for storing wolverine carcasses. We wish to thank
Conservation Officer Jason Hawke for helping secure bait and assistance in the field.
Additionally, we had the co-operation and assistance of a number of stakeholders in the
study area, including Nature Conservancy and Darkwoods Forestry, Whitewater Ski
Resort, Wildhorse Cat Skiing, Wyndel Box and Lumber, Canadian Pacific Railway,
Harrop Community Forests, Kalesnikoff Lumber Co. Ltd, Atco Wood Products Ltd.,
Powder Creek Lodge, BC Provincial Parks and Kootenay Trappers Associations.
We wish to thank Cary Gaynor and Leo Degroot for field support and managing
equipment. We would like to thank field technicians and trappers Tom Abraham, Jimmy
Robbins, Colby Lehman, Steve Forrest, Darcy Fear, Stefan Himmer and Dennis Lynch
for assistance in setting up and monitoring field stations. Thank you to Jeff Parker and
Kootenay Valley Helicopters for putting up with us and our stinky cargo! Volunteers
from the local community; Verena Shaw, Lisa Tedesco, Kristen Murphy, Pat Stent, Chris
Hiebert, Megan Jamison, Adrian Leslie, Anne Machildon, Emily Tidmarsh, and Phil
Bajneski, Jen Vogel, Cedar Mueller, Sarah Fassina and Selkirk College 2013 Recreation,
Fish and Wildlife class, contributed approximately 180 hours to the sampling effort.
Thank you to Leanne Harris, Jennifer Weldon and Dave Paetkau at the Wildlife Genetics
Lab for assistance in field protocols and for the genetic analysis.
16Literature Cited
Austin, M. 1998. Wolverine winter travel routes and response to transportation corridors
in Kicking Horse Pass between Yoho and Banff National Parks. MSc. Thesis.
University of Calgary.
Banci, V. 1987. Ecology and behavior of wolverine in Yukon. Burnaby, BC: Simon
Fraser University. M.S. thesis. 178 p.
[BC CDC] B.C. Conservation Data Centre. 2013. Species Summary: Gulo gulo luscus.
B.C. Ministry of Environment. Available: http://a100.gov.bc.ca/pub/eswp/ (accessed
Dec 2, 2013).
Burnham, K. P., and D. R. Anderson. 1998. Model selection and inference: a practical
information theoretic approach. Springer-Verlag, New York, New York, 353 pp.
Cegelski, C.C., L.P. Waits, N.J. Anderson, O. Flagstad, and C.J. Kyle. 2006. Genetic
diversity and population structure of wolverine (Gulo gulo) populations at the
southern edge of their current distribution in North America with implications for
genetic viability. Conservation Genetics 7:197-211.
[COSEWIC] 2003. Assessment and updated status report on the wolverine (Gulo gulo) in
Canada. Committee on the Status of Endangered Wildlife in Canada, Ottawa. 41 pp.
ESRI Inc. 1998. ArcView GIS Version 3.1. – Redlands, CA.
Felsenstein, J. 2013. PHYLIP (Phylogeny Inference Package) version 3.695. Distributed
by the author. Department of Genome Sciences, University of Washington, Seattle.
http://evolution.genetics.washington.edu/phylip.html. (Accessed Dec 18, 2013).
Fisher, J.T. 2004. Alberta Wolverine Experimental Monitoring Project 2003-2004
Annual Report. Vegreville: Sustainable Ecosystems, Alberta Research Council Inc.
Fisher, J.T., S. Bradbury, B. Anholt, L. Nolan, L. Roy, J.P. Volpe, and M. Wheatley.
2013. Wolverines (Gulo gulo luscus) on the Rocky Mountain slopes: natural
heterogeneity and landscape alteration as predictors of disturbance. Canadian Journal
of Zoology 91:706- 716.
Gardner, C.L., J.P. Lawler, J.M. Ver Hoef, A.J. Magoun, K.A. Kellie. 2010. Coarse-scale
distribution surveys and occurrence probability modeling for wolverine in Interior
Alaska. Journal of Wildlife Management 74:1894-1903.
Jenness, J. 2005. Repeating Shapes (repeat_shapes.avx) extension for ArcView 3.x.
Jenness Enterprises. Available at:
http://www.jennessent.com/arcview/repeat_shapes.htm. (Accessed Dec 18 2013)
17Johnson, W.E. and S.J. O’Brien.1997. Phylogenetic reconstruction of the Felidae using
16S rRNA and NADH-5 mitochondrial genes. Journal of Molecular Evolution
44:S98–S116.
Kortello, A., and D. Hausleitner. 2012. Wolverine and habitat assessment in the
Kootenay Region. 2012 field season report. Prepared for Columbia Basin Trust.
15pp.
Krebs, J., E.C. Lofroth and I. Parfitt. 2007. Multiscale habitat use by wolverines in
British Columbia, Canada. Journal of Wildlife Management 68: 493-502.
Langella, O. 1999. POPULATIONS version 1.2.31.
http://bioinformatics.org/~tryphon/populations/ (Accessed Dec 18 2013)
Lofroth, E.C. 2001. Wolverine ecology in plateau and foothill landscapes 1996–2001.
Northern wolverine project: 2000/01 year-end report. Report for B.C. Ministry of
Environment, Lands and Parks, Wildlife Branch, Victoria, B.C. Unpublished
report.
Lofroth, E.C., and J. Krebs. 2007. The abundance and distribution of wolverines in
British Columbia, Canada. Journal of Wildlife Management 71:2159-2169.
Lofroth,E.C., and P.K. Ott. 2007. Assessment of the sustainability of wolverine harvest in
British Columbia, Canada. Journal of Wildlife Management 71: 2193-2200.
Lofroth, E.C., J.A. Krebs, W.L. Harrower and D. Lewis. 2007. Food habits of Wolverine
Gulo gulo in montane ecosystems of British Columbia, Canada. Wildlife Biology
13:31-37.
MacKenzie, D. I., J. D. Nichols, G. B. Lachman, S. Droege, J. A. Royle, and C. A.
Langtimm. 2002. Estimating site occupancy rates when detection probabilities are
less than one. Ecology 83:2248–2255.
MacKenzie, D.I., J.D. Nichols, J.A. Royle, K.H. Pollock, L.L. Bailey, J.E. Hines. 2006.
Occupancy estimation and modeling: Inferring patterns and dynamics of species
occurrence. Elsevier, Amsterdam, Netherlands. 324 pp.
Magoun, A.J. 1985. Population characteristics, ecology and management of wolverines in
northwestern Alaska. Fairbanks, AK: University of Alaska. Ph.D. thesis. 197 p.
McKelvey, K. S., J. P. Copeland, M. K. Schwartz, J. S. Littell, K. B. Aubry, J. R. Squires,
S. A. Parks, M. M. Elsner, and G. S. Mauger. 2011. Climate change predicted to shift
wolverine distributions, connectivity, and dispersal corridors. Ecological
Applications 21: 2882-2897.
18[MWLAP] Ministry of Water, Land and Air Protection. 2004. Wolverine, Accounts and
Measures for Managing Identified Wildlife. Version 2004. Biodiversity Branch,
Identified Wildlife Management Strategy, Victoria, B.C.
Persson, J. 2005. Female wolverine reproduction: reproductive costs and winter food
availability. Canadian Journal of Zoology 83:1453–1459.
Pulliam, H. R. 1988. Sources, sinks, and population regulation. The American Naturalist
132:652-661.
Saitou N., and M. Nei. 1987. The neighbor-joining method: a new method for
reconstructing phylogenetic trees. Molecular Biology and Evolution 4:406-425.
Schwartz, M.K., J.P. Copeland, N.J. Anderson, J.R. Squires, R.M. Inman, K.S.
McKelvey, K.L. Pilgrim, L.P. Waits, S.A. Cushman. 2009. Wolverine gene flow
across a narrow climatic niche. Ecology 90: 3222-3232.
Seber, G. A. F. 1982. The Estimation of Animal Abundance (2nd ed.), London:Griffin.
Singleton, P. H., W. L Gaines, and J. F. Lehmkuhl. 2002. Landscape permeability for
large carnivores in Washington: a geographic information system weighted-distance
and least-cost corridor assessment. Res. Pap. PNW-RP-549. Portland, OR: U.S.
Department of Agriculture, Forest Service, Pacific Northwest Research Station. 89
pp.
Slough, B.C. 2007. Status of the wolverine Gulo gulo in Canada. Wildlife Biology 13:76-
82.
[USFWS] United States Fish and Wildlife Service. 2013. Endangered Species Mountain-
Prairie Region. Wolverine. Available: http://www.fws.gov/mountain-
prairie/species/mammals/wolverine/ (accessed Dec 20, 2013).
19Appendix 1. Carnivores detected by snow tracking during wolverine surveys in the south
Purcells and south Selkirks January-April 2013.
Location UTM UTM Date (s) Species
easting northing
Clearwater Creek 488451 5468811 19 Jan Coyote (1)
Bombi Summit 462420 5455674 22 Jan, 19 Feb Cougar (1),
Lynx (1),
Coyote (1)
Wolf Peak 498559 5438243 3 Feb, 1 April Coyote (1)
Baribeau/Redding 533238 5498381 10 Feb Coyote (1)
Confluence
Redman Point 521371 5466658 11 Feb, 4 March Coyote (1),
Wolf (1)
Mount Thompson 542908 5439398 11 Feb Coyote (1)
Hazel Creek 557901 5445092 11 Feb, 7 March Coyote (1)
Kid Creek 562293 5456220 13 Feb Cougar (1)
Englishman Creek 567682 5442896 14 Feb, 6 March Red fox (1),
Coyote (1)
Houghton Creek 516079 5505834 15 Feb, 10 March Coyote (1)
Lamb Creek Headwaters 572409 5457717 19 Feb Wolf (1)
Rabbitfoot Creek 576255 5463107 19 Feb Lynx (1)
St Mary/Dewer Junction 544627 5507441 20 Feb Wolves (>1)
Buhl/Skookumchuck 569600 5534736 21 Feb Coyote (>1)
Confluence
Kianuko Creek 540833 5476179 4 March Red fox (1)
Leadville 549498 5453477 5 March Coyote (1)
Kianuko/Goat Confluence 544464 5465158 5 March Coyote (1)
Kitchener 547812 5448713 5 March Coyote (1), Red
fox (1)
Little Moyie 554758 5438204 5 March, 4 April Coyote (1)
Mt Sommerfeld 556468 5450470 6 March Coyote (1)
St. Mary’s 551216 5497089 15 March Wolf (1),
Cougar (1)
Maryland Creek 509671 5438961 1 April Wolf (1)
Birchdale 512369 5537026 11 April Coyote (1)
Mather/Cherry Creek 574678 5517433 11April Lynx (1)
20You can also read