Accurate long range forecasting of COVID 19 mortality in the USA
←
→
Page content transcription
If your browser does not render page correctly, please read the page content below

www.nature.com/scientificreports
OPEN Accurate long‑range forecasting
of COVID‑19 mortality in the USA
Pouria Ramazi1*, Arezoo Haratian2, Maryam Meghdadi2, Arash Mari Oriyad2,
Mark A. Lewis3,4, Zeinab Maleki2, Roberto Vega5,6, Hao Wang3, David S. Wishart4,5 &
Russell Greiner5,6
The need for improved models that can accurately predict COVID-19 dynamics is vital to managing the
pandemic and its consequences. We use machine learning techniques to design an adaptive learner
that, based on epidemiological data available at any given time, produces a model that accurately
forecasts the number of reported COVID-19 deaths and cases in the United States, up to 10 weeks
into the future with a mean absolute percentage error of 9%. In addition to being the most accurate
long-range COVID predictor so far developed, it captures the observed periodicity in daily reported
numbers. Its effectiveness is based on three design features: (1) producing different model parameters
to predict the number of COVID deaths (and cases) from each time and for a given number of weeks
into the future, (2) systematically searching over the available covariates and their historical values
to find an effective combination, and (3) training the model using “last-fold partitioning”, where each
proposed model is validated on only the last instance of the training dataset, rather than being cross-
validated. Assessments against many other published COVID predictors show that this predictor is
19–48% more accurate.
Coronavirus disease (COVID-19) was declared a public health emergency of international concern in January
2020 by the World Health O rganization1. Since then, more than 76 million confirmed cases and almost 1.7 mil-
lion deaths due to COVID-19 have been reported w orldwide2. Some of these cases and deaths might have been
prevented if more aggressive public policies, such as travel restrictions and lockdowns, had been implemented
sooner. However, lockdowns have the downside of causing severe economic disruptions. For example, the num-
ber of global job losses has been ten times greater than those arising during the first months of the 2008 global
financial crisis. It is unlikely that employment in many developed countries will return to pre-pandemic levels
before 20223. Throughout the pandemic, governments have been forced to find a balance between public safety
and public good, constantly adjusting preventive policies to mitigate the disease spread, while trying to preserve
the economy. Robust policy development and planning requires pandemic models that can accurately predict
the number of COVID-19 cases and deaths far into the future, as such models would allow governmental policy
makers to examine the effect of different preventive p olicies4.
While many epidemic models have successfully explained the dynamics of disease outbreaks after the fact,
their success in forecasting has, at best, been m ixed4,5. Indeed, there have been many failures in forecasting for
COVID-19. Early mis-predictions of 100,000,000 USA COVID cases within 4 weeks of the beginning of the
pandemic, suggesting sizable impacts on hospital and ICU requirements, greatly misinformed policy m akers1.
The Center for Disease Control (CDC) now maintains a national forecasting site, where 60 modeling groups
continually update their forecasts for new COVID-19 cases, hospitalization, and deaths in the U SA6,7. While
these forecasts are better than earlier a ttempts8,9, there is still much room for further improvement, especially
for the long-range (5+ weeks) forecasts. These longer range forecasts are important, as they provide guidance
and reasonable preparation time for preventive policy makers and health managers.
This paper describes a novel approach that improves long-range forecasting substantially over existing
COVID-19 prediction models—predicting new COVID-19 cases and deaths in the US over different time peri-
ods, more accurately than existing models from the CDC site10. Our forecaster also predicts the weekly perio-
dicity reported in the daily reported number of deaths, and it predicts COVID-19 surges up to 2 months ahead.
1
Department of Mathematics and Statistics, Brock University, St. Catharines, ON L2S 3A1, Canada. 2Department
of Electrical and Computer Engineering, Isfahan University of Technology, 84156‑83111 Isfahan, Iran. 3Department
of Mathematical and Statistical Sciences, University of Alberta, Edmonton, AB T6G 2G1, Canada. 4Department of
Biological Sciences, University of Alberta, Edmonton, AB T6G 2E9, Canada. 5Department of Computing Science,
University of Alberta, Edmonton, AB T6G 2E8, Canada. 6Alberta Machine Intelligence Institute, Edmonton, AB T5J
3B1, Canada. *email: pramazi@brocku.ca
Scientific Reports | (2021) 11:13822 | https://doi.org/10.1038/s41598-021-91365-2 1
Vol.:(0123456789)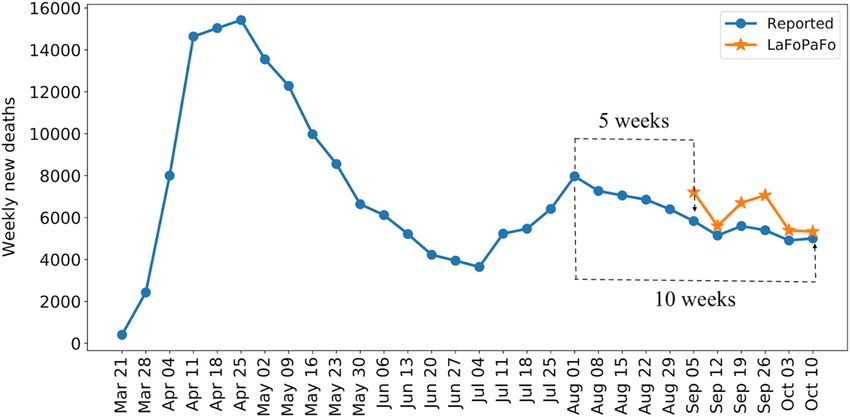
www.nature.com/scientificreports/
Figure 1. Forecast accuracy of the projected weekly number of reported COVID-19 deaths in the US. The
accuracies of the 17 predictive models submitted to the CDC, as well as LaFoPaFo, on forecasting the weekly
average (non-cumulative) number of deaths in the US for each of the 7 weeks starting from September 27 to
November 14, 2020. We could only consider six test weeks for the future 10-weeks predictions as insufficient
training instances were available before the week September 21–27. For each of these 7 weeks, we recorded the
forecasts made by each model, for 5 to 10 weeks ahead, and compared each forecast to the true value. We then
computed the MAPE for each model and time-horizon as the average over the 7 weeks, depicted with a single
point in the graph. The vertical purple lines are the error bars of LaFoPaFo and are computed as the standard
deviation over the seven MAPEs. Note the forecasting results for the CDC models were taken from the tables at
the forecast hub website. Most CDC models did not submit forecasts for long-range horizons; only five models
submitted the forecast results for the future 10 weeks. We see that LaFoPaFo is the most accurate forecaster over
the 5, 6, 9 and 10 week forecast horizons, with a significant difference for 9 and 10 weeks.
We believe that similarly accurate COVID-19 prediction models could be developed for other countries if the
appropriate input data is available.
Instead of designing a single model with fixed parameters to forecast cases and deaths for the whole pandemic
duration, we instead created a general learner, called LaFoPaFo (short for LAst FOld PArtitioning FOrecaster),
that uses “last-fold partitioning” to find the best model parameters, the best combination of these features, and
the best history-length to produce the forecasting model. Given the target cases or deaths, and forecast hori-
zon ranging from 5 to 10 weeks, LaFoPaFo produces a model (involving a learned subset of existing available
epidemiological data) that is designed to forecast this target, at this forecast interval in the future. LaFoPaFo
considers 11 different features, including the current number of COVID-19 tests, cases, and deaths, social activity
measures, and weather-related covariates specific to the USA. It also includes their historical values at the earlier
weeks, back to the start of the pandemic in the US. Here, we compare the forecasting results of our LaFoPaFo
with those available at C DC10 during the 7 weeks starting from September 27 to November 14, 2020. We also
assess the design features of our learning approach. The SI provides the performance data of our model for an
extended range (Supplementary Figures 1–6).
Results
We first consider forecasting the weekly, averaged number of COVID-19 deaths. Figure 1 shows that our
LaFoPaFo outperforms all CDC models for essentially every forecast horizon from five to 10 weeks. The only
exception is the USACE-ERDC_SEIR m odel11, which outperforms LaFoPaFo for future 7 and 8 weeks. In particu-
lar, for predictions extending to 10 weeks, LaFoPaFo’s mean absolute percentage error (MAPE) is 9%, while the
best second model has an error of 28%. Very few research groups provided their forecasting results for more than
8 weeks ahead; those that did, report an accuracy that decreased dramatically as the forecasting length increased.
Figure 2 shows a similar trend for predicting the number of reported cases, where LaFoPaFo is in the top
three at all times, and the best, often by a large margin, starting with a 7-week forecast. The CDC models that
were best at forecasting the number of deaths were often less accurate at forecasting the number of confirmed
cases. This was also true for LaFoPaFo, but not as significantly. The MAPE of the USC-SI_kJalpha, which was the
Scientific Reports | (2021) 11:13822 | https://doi.org/10.1038/s41598-021-91365-2 2
Vol:.(1234567890)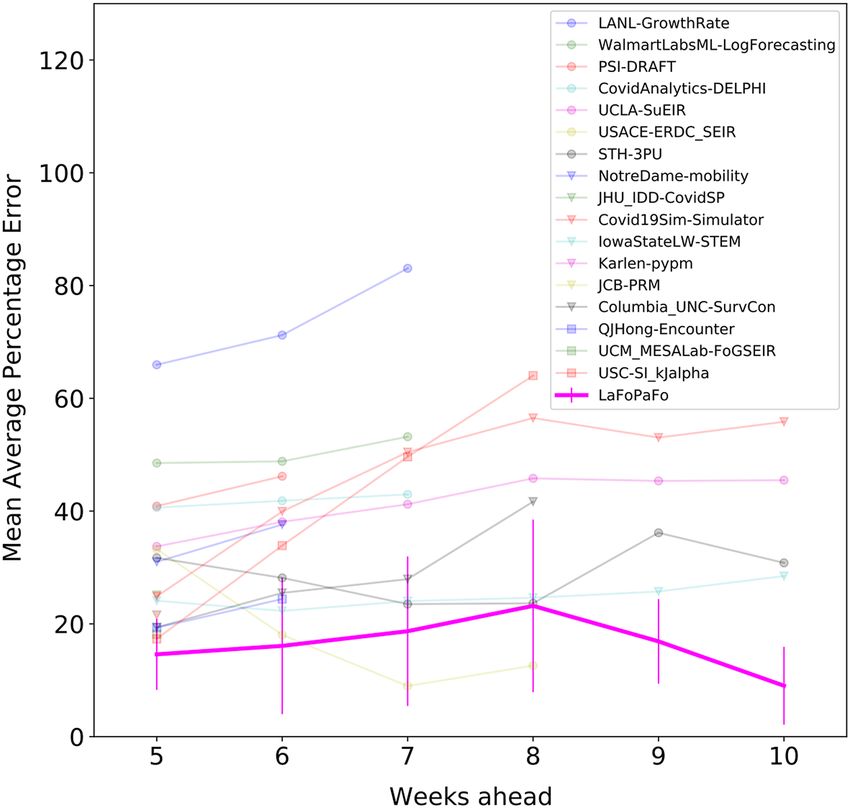
www.nature.com/scientificreports/

                                  Figure 2.  Forecast accuracy of the projected weekly number of reported COVID-19 cases in the US. The
                                  settings are the same as Fig. 1, but here the models are evaluated on forecasting the future number of reported
                                  COVID-19 cases. LaFoPaFo outperforms other models over almost every forecasting horizon. None of the CDC
                                  models provided forecasting results for future 9 and 10 week horizons.

                                                   #deaths                             #cases
                                                   Win          Tie        Lose        Win            Tie   Lose
                                   5 weeks         8            9          0           10             8     0
                                   6 weeks         8            5          0           4              10    0
                                   7 weeks         6            4          0           5              4     0
                                   8 weeks         3            4          0           3              4     0
                                   9 weeks         2            2          0           –              –     –
                                   10 weeks        3            1          0           –              –     –
                                   Total           30           25         0           22             26    0

                                  Table 1.  T-test results. The null hypothesis was that the MAPEs of LaFoPaFo and the CDC models follow the
                                  same distribution. The test was performed for each of the future 5, 6, …, 10 future weeks forecasts, comparing
                                  LaFoPaFo to each of the CDC models. “Win” means that the average MAPE of LaFoPaFo is lower than the
                                  CDC model and that the difference is statistically significant. “Tie” means that the difference in MAPE is not
                                  statistically significant. “Lose” means that the MAPE of the CDC model is lower and that the difference is
                                  statistically significant. LaFoPaFo never lost against any of the CDC models.

                                  second-best predictor for 5-week reported cases, increased from 17% (deaths) to 63% (cases); LaFoPaFo, on the
                                  other hand, increased from 14% to just 27%. Although seemingly large, the error bars are based on only seven
                                  values. Moreover, the error bars of LaFoPaFo are in the same range of values as most other CDC forecasters.
                                     As a more in-depth comparison, Table 1 presents the “p < 0.05 2-sided t-test” results with the null hypothesis
                                  that the MAPEs of LaFoPaFo and each CDC model were drawn from the same distribution. For predicting the
                                  number of deaths, LaFoPaFo won 22 times (rejected the null hypothesis), lost 0 times, and was tied with the
                                  CDC models 26 times (i.e., failed to reject the null hypothesis). For predicting the number of cases, LaFoPaFo
                                  won 30 times, lost 0 times, and was tied with the CDC models 25 times.
                                     Figure 3 presents the future 5- to 10-week forecasted number of COVID-19 deaths, when LaFoPaFo uses data
                                  up to the week of July 26–August 1, 2020. As seen here, LaFoPaFo was able to forecast the almost-exact values of
                                  the number of COVID weekly deaths, over the next 6, 9 and 10 weeks. Also, as seen in Supplementary Figure 1,
                                  on June 21–27, when the first COVID death wave was damping, LaFoPaFo almost exactly forecasted the peak

Scientific Reports |   (2021) 11:13822 |                 https://doi.org/10.1038/s41598-021-91365-2                                                3

                                                                                                                                            Vol.:(0123456789)
www.nature.com/scientificreports/

                                            Figure 3.  LaFoPaFo’s projected number of deaths from 5 to 10 weeks in the future. The forecasts are made
                                            based on data accumulated to the week of August 1, 2020.

                                            Figure 4.  LaFoPaFo’s weekly forecasting results for the number of deaths, ten weeks later, in the US. Note the
                                            figure shows only two of the six “10 weeks” lines.

                                            of the second COVID wave that happened 5 weeks later on July 26–August 1. Moreover, on July 26–August 1, it
                                            forecasted that the total number of deaths will decrease by 3000 individuals 10 weeks later (Fig. 4).
                                                Figure 5 presents the future 14-day forecasting results for the daily number of deaths over the 21 days of
                                            October 23 to November 14, 2020. This illustrates how LaFoPaFo correctly forecasts the periodicity in the daily
                                            data, 2 weeks ahead.
                                                To better understand why LaFoPaFo worked so well, we performed a simple ablation study, where we modi-
                                            fied each of its design features, one-by-one (Fig. 6). We found that LaFoPaFo’s performance decreased at almost
                                            every forecast horizon if any of its design features were altered. Among the alternate models we studied, (1)
                                            LaFoPaFo-SingleModel that had to produce a single nearest neighbor to forecast all seven test weeks; this version
                                            had 23% MAPE for future 5-week forecast rather than the original 15% MAPE. (2) LaFoPaFo-Cover that only
                                            used the previous number of deaths but no other covariates; its performance would degrade from 17 to 21%
                                            MAPE for future 9-week predictions. (3) LaFoPaFo-30 that used a single 30% validation fold, rather than the
                                            one point; this version had 23% MAPE rather than 15% for the future 5-week predictions. (4) LaFoPaFo-Indirect
                                            that forecasted week one, based on which it forecasts week two, and so on until it forecasts the week of interest
                                            based on its own forecast of the previous week; its performance was worse than LaFoPaFo’s by at least 10.5%
                                            MAPE over the 6 multi-week predictions.

          Scientific Reports |   (2021) 11:13822 |               https://doi.org/10.1038/s41598-021-91365-2                                                   4

Vol:.(1234567890)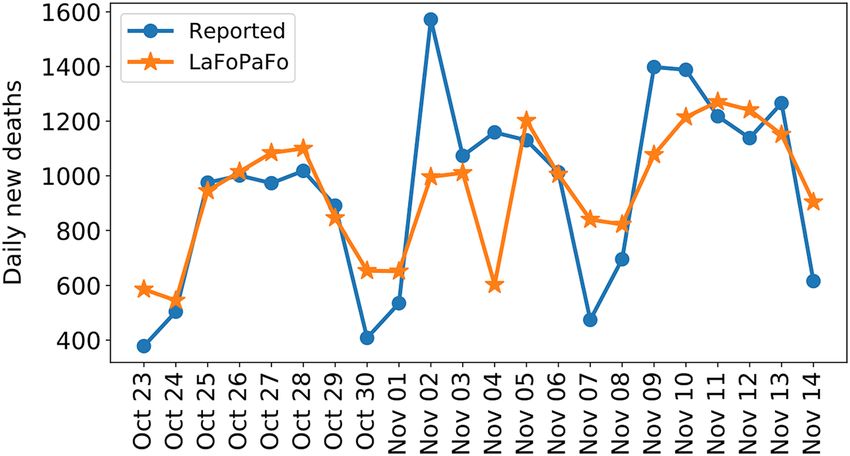
www.nature.com/scientificreports/

                                  Figure 5.  LaFoPaFo’s daily forecasting results for the future 14-day number of deaths in the USA. LaFoPaFo
                                  forecasted each day from September 20 to October 10, 2020, 2 weeks ahead. LaFoPaFo forecasts the periodicity
                                  in the daily data as well as the peak values with at most one day delay.

                                  Figure 6.  Ablation system, showing the LaFoPaFo’s Forecast Accuracy without various design factors.
                                  Evaluating the performance on forecasting the future number of COVID-19 deaths from 5 to 10 weeks in the
                                  future for LaFoPaFo and its modified versions (that each modify one of its design features), using the same
                                  setup as in Fig. 1. The red graph (LaPoFaPo-SingleModel) corresponds to the case where, instead of producing
                                  seven forecasting models for the seven test weeks, a single model was produced to forecast all of the 7 weeks. A
                                  validation dataset of seven instances (weeks) was used, which limited the forecast horizon to 6 weeks due to the
                                  limited training data. The cyan graph (LaPoFaPo-Cover) corresponds to the model where instead of using 11
                                  features, only the previous number of deaths is used. The orange graph (LaPoFaPo-30) corresponds to the model
                                  where rather than the last instance, 30% of the training dataset was used as the validation set to choose the final
                                  model. The black graph (LaPoFaPo-Indirect) corresponds to the system that forecasts each week in the future
                                  based on the intermediate week forecasts, rather than being directly forecasted.

                                  Discussion
                                  The COVID-19 pandemic has caused dramatic increases in deaths, dire economic fallout and enormous social
                                  problems. Many of these consequences were not predicted, but many could have been mitigated if the number
                                  of future COVID-19 cases and deaths could have been forecasted accurately. Long-term (2–3 months) pandemic
                                  and epidemic forecasts are more challenging than short-term (1–2 weeks) ones, but they are also more essential,
                                  as such long-term forecasts are key to effectively planning, developing, implementing and assessing pandemic

Scientific Reports |   (2021) 11:13822 |               https://doi.org/10.1038/s41598-021-91365-2                                                  5

                                                                                                                                              Vol.:(0123456789)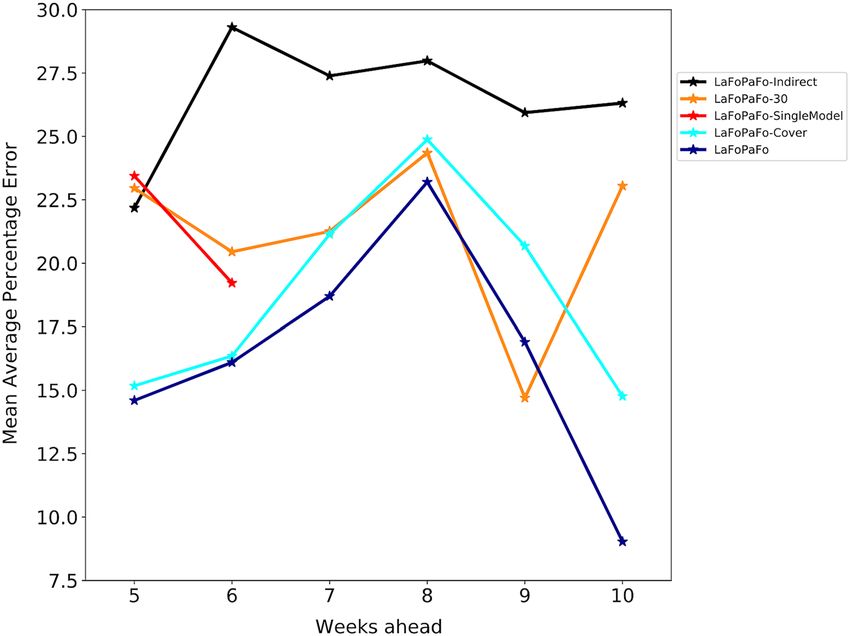
www.nature.com/scientificreports/
response policies by governments and public health agencies. However, while many existing COVID-19 predic-
tion models can make 1- or 2-week forecasts reasonably well, most fail at longer forecast horizons. Our machine
learning approach can provide long-range forecasts of COVID-19 cases and deaths, up to 10 weeks in the future.
Most mechanistic models, such as the SEIR (susceptible, exposed, infectious, removed) model, use fixed
parameters to implicitly model the effect of stochastic, yet influential variables. For example, few models include
weather or average number of encounters as stand-alone variables, but many can incorporate them into the infec-
tion ratio parameter. Under the assumption that those variables remain constant over time, modelers can project
the future number of COVID deaths and cases. This assumption appears approximately valid for the near future,
say 1 week, but not for 4 weeks or more. This may explain why some of the submitted CDC models that accu-
rately forecast short-range mortalities, did not submit forecast results for 5-week and longer forecast horizons.
LaFoPaFo’s strong forecasting power allows it to effectively predict future COVID-19 surges many weeks
ahead. For example, on the week June 21–27, when the first US COVID surge was damping and still had one
more week to reach its minimum, LaFoPaFo still predicted that 5 weeks into the future, there would be a second
wave. Our model could also forecasted from August 1, when the number of COVID deaths in the US had peaked,
that 10 weeks later the number of deaths will decrease by about 3000 individuals over the week. Such long-range
predictions can greatly inform public health management.
The fact that LaFoPaFo’s base learner uses one of the simplest possible models, namely “k nearest neighbor”,
emphasizes the strengths of its design features. To forecast the number of cases in the future, a k nearest neighbor
simply finds the k instances in the training dataset that have the most similar covariates, and then returns, as its
forecast, the average of their number of cases. This k nearest neighbor model is clearly much simpler than those
SEIR models with their complicated coupled differential equations that attempt to capture the spread dynamics
in the near future, However, LaFoPaFo’s approach still enables it to outperform SEIR models in the long-range
predictions.
The key to LaFoPaFo’s success is its internal training process, which makes critical decisions about the model
based on the situation to which that model will be applied, when it is making its forecasts. Here we summarize
the five most novel and important aspects of LaFoPaFo.
First, unlike the common approach of producing a single model with fixed parameters to forecast the entire
pandemic, the LaFoPaFo has the option of producing different models for forecasting each time interval during
the pandemic—that is, “5-week case forecaster” for May 1 may be different from the “5-week case forecaster” for
September 20. This makes particular sense for machine-learning approaches where the pandemic dynamics can
vary significantly over time—which is true for this COVID-19 pandemic. Our empirical study confirmed that
the accuracy of our COVID-19 predictions drops considerably if we require that LaFoPaFo uses only a single
model over all times.
Second, like most machine learning tools, LaFoPaFo produces a model that can use many covariates to pro-
duce its forecast. LaFoPaFo actually considers eleven different covariates, at multiple time points. If the historical
data has five time points, there are fifty-five variables to consider. Then, a feature selection algorithm would have
to implicitly consider all 2 55 combinations. To reduce the chance of overfitting and to save computational time,
LaFoPaFo instead considers a systematically-constructed fixed subset of covariates, where all of the historical
values of the selected covariates are included, counting from the current times12.
Third, to decide on the appropriate hyper-parameters, such as the ‘k’ for k-nearest-neighbors and the set
of features to include, machine learning algorithms often partition the training dataset into sub-training and
validation subsets. They then train various models (each with some setting of those hyperparameters) on the
sub-training subset, and evaluate the quality of this setting on the validation subsets13. This partitioning is typi-
cally done randomly, which here means the validation subset will be randomly selected from the weeks within
the training subset. The validation subset might, hence, include data that occurs before some data in the sub-
training set. This approach is implicitly based on the assumption that the data is iid (independent and identically
distributed), implying the distribution of features and outcomes is the same for June 10 as it is for September 30.
However, we know that this is not the case, due to differences in policies, “Covid fatigue” and other time-varying
unknown influential factors. This is why LaPoFaPo instead uses “last-fold partitioning”, where only the last week
of the dataset is taken as the validation and the rest serves as the training dataset. This is also why LaFoPaFo does
not use internal cross validation. The idea behind this is to mimic the situation that the learned forecasting model
will face in making real predictions, as that model needs to make its predictions based only on data available at
that time, and cannot base its model on future data, which is unavailable.
Fourth, for the same reason as described above, we set the size of the validation dataset to be a single week, as
the learned system will be asked to focus only on a single value. Increasing the size of the validation means the
learned model will prefer hyper-parameters that fit some of the former weeks as well as the “final” week. Given
how quickly this pandemic changes, as we only care about the latest date, the validation subset should only be
the single “closest” date.
Fifth, we did not follow the common approach of predicting a point in the future by first predicting the inter-
mediate points one by one and using the prediction results of the previous point in predicting the next point. For
example, in order to forecast week t + 10, that approach would first use previous data (pre-week t) to forecast week
t + 1, then use that prediction result at week t + 1 (as well as pre-week t) to predict week t + 2, and so on. Given
that our prediction for week t + 1 is just our prediction (and not true information), this can easily accumulate the
error. Instead, we trained the “r-week horizon” LaFoPaFo with the dataset consisting of the covariates at time t
but set the target variable to be the quantity at time t + r. The better performance of this direct approach is partly
explained by comparing the joint probability distribution of the mortality count at two consecutive weeks and
the probability distributions of each of the 2 weeks. The maximum of the joint probability does not necessarily
equal the joint maximums of each of the probability distributions. Therefore, if the goal is the maximum of the
probability distribution of the second week (r = 2), that of the first week (r = 1) should not be considered.
Scientific Reports | (2021) 11:13822 | https://doi.org/10.1038/s41598-021-91365-2 6
Vol:.(1234567890)www.nature.com/scientificreports/
We close this section with three comments. First, there is no “leakage” from test data to training data. That is,
even though LaFoPaFo (for each of the cases, and deaths) is learning a different model for each time and for each
forecast time horizon, the learning process uses ONLY the data available at the forecasting start date. Although
seemingly trivial, a huge body of literature ignores this when presenting or assessing their results.
Second, while this paper discusses only the task of forecasting weekly COVID-19 cases and deaths for the
USA, LaFoPaFo should be applicable to making daily COVID-19 forecasts for other countries, as well as for
smaller sub-regions such as counties and states. To facilitate this, we have made the code for the LaFoPaFo
approach publicly available.
Third, in addition to allowing health managers and policy makers to plan COVID-19 mitigation, the approach
used in this paper opens the door to future research on examining the long-range effects of different preventive
policies, allowing policy makers to experiment and plan COVID-19 mitigation decisions.
Methods
Our goal is to accurately forecast the weekly number of reported COVID-19 cases and deaths over a range of
time horizons, varying from 5 to 10 weeks. Our focus is on the United States. Given each specific forecast time
interval, we want a model that can use the existing covariates, measured up to the “current” time, to forecast the
weekly number of reported COVID-19 deaths or cases at a specific number of weeks in the future. Rather than
producing a single predictive model for the entire pandemic duration, we have designed a learner, LaFoPaFo, that
learns from data and produces a nearest neighbor model suited to the time period of interest; it then uses that
time-duration-target model for this single prediction. For example, the model for “forecasting COVID-19 cases
6-weeks out, from Apr. 1” is different from the model for “forecasting COVID-19 cases 6-weeks out, from Sept. 1”.
Data. We use a dataset containing 11 features: (1) the number of reported COVID-19 cases and (2) deaths
in the US for each day, from the beginning of the disease outbreak in the US (January 22, 2020) until November
14, 2020. This dataset also includes the following covariates: (3) country average number of daily COVID-19
tests, calculated as the number of daily performed tests, averaged over all US states, (4) country average daily
temperature and (5) daily precipitation, calculated by averaging daily temperature and daily precipitation over
all US counties, as well as several social distancing related covariates. To estimate the relevant social distancing
covariates, we used Google mobility data, which contains cell-phone-derived information on the mobility trends
of individuals visiting different places including (6) parks, (7) transit stations, (8) residences, (9) workplaces, (10)
grocery stores and pharmacies, (11) retail shops and recreation centers. This data is provided from March 1 to
November 17. Each of these features shows a change in the number of daily visitors to these places compared to
the baseline, where the baseline value for each date was determined based on the day of the week and is equal
to the median number of visitors on that day of the week in the 5-week period from January 3 to February 6,
2020. Since the start date of Google Mobility data is from March 1, we only include the dates from March 1 to
November 17.
The learner. In order to forecast the number of reported COVID-19 deaths and cases, LaFoPaFo uses the
eleven available covariates in the above dataset and explores their historical values to produce a predictive model.
In particular, we focus on forecasting the 7 weeks starting from the week September 27–October 3 to the week
November 8–14, which we call our testing dataset. Note this contains seven points. For each of these target times,
for each forecast horizon (of r weeks, for r ∈ {5,6,7,8,9,10}), and each target variable (case or deaths), LaFoPaFo
learns a k-nearest neighbor (KNN) model that is trained on the data corresponding to the previous weeks up
until r weeks earlier, and sets its last week as the validation dataset and the remaining former weeks as the train-
ing dataset. For example, to produce the 6-week COVID-19 death forecaster for October 18–24, LaPoFaPo
would have access to the data before September 12. Specifically it would use September 6–12 as the validation
set, and train on data before September 5.
LaFoPaFo trains the KNN on the “sub-training data”, with a subset of the covariates, and their historical val-
ues, as well as different “k” (number of neighbors), resulting in a number of different models. The performance
of the models are then evaluated on the single validation point, and LaPoFaPo selects the model that has the
best MAPE here. Then that single winning model with the selected parameters is trained on the whole training
set (both the sub-training and validation datasets) to produce a final model, which is then used to forecast the
single point in the testing dataset.
More specifically, for week t, let Y(t) be the target variable, which is either the number of reported COVID-19
deaths or cases and X(t) = {x1(t), …, xC(t)} be the set of available covariates for time t (here C = 11; see the Data
section above). Each forecast instance involves forecasting, from time t, the target variable at a time r weeks in
the future Y(t + r), where r ∈ {5,6,…,10}, from the dataset containing the target variable and available covariates
from the beginning week in our dataset to week t, D(t) = {Y(tʹ + r), X(tʹ)}t-r tʹ=1. We refer to each historical value
of a covariate as a feature. So a covariate is some xi(t) but a feature can be xi(t-h + 1) for any history h = 1,2,….
The learner executes the following steps for each week T of the testing dataset, to be forecasted r weeks ahead.
Step 1: Construct the “raw” test instance, consisting of the target variable at the test week T and the covariates
r weeks earlier; that is {Y(T), X(T-r)}. We call this instance “raw” as it does not include historical values
of the covariates. Out of the remaining earlier instances, eliminate the most recent r-1 to obtain the
raw training dataset; that is D(T-r). Take the last instance of the training dataset, i.e., last-fold partition,
as the raw validation set, and the remaining as the raw sub-training. So the raw validation will be the
instance {Y(T-r), X(T-2r)} and the raw subtraining will be D(T-r-1). Namely, the data at week T-r will
Scientific Reports | (2021) 11:13822 | https://doi.org/10.1038/s41598-021-91365-2 7
Vol.:(0123456789)www.nature.com/scientificreports/
04/07/20 week 18
27/06/20 week 17
29/08/20 week 26
22/08/20 week 25
09/05/20 week 10
23/05/20 week 12
08/08/20 week 23
18/07/20 week 20
19/09/20 week 29
30/05/20 week 13
20/06/20 week 16
06/06/20 week 14
26/09/20 week 30
03/10/20 week 31
13/06/20 week 15
11/07/20 week 19
01/08/20 week 22
05/09/20 week 27
25/07/20 week 21
10/10/20 week 32
12/09/20 week 28
16/05/20 week 11
15/08/20 week 24
28/03/20 week 4
04/04/20 week 5
11/04/20 week 6
14/03/20 week 2
21/03/20 week 3
07/03/20 week 1
18/04/20 week 7
02/05/20 week 9
25/04/20 week 8
Test
Gap
Validation
Train
Figure 7. Partitioning the dataset into train, validation and test sets. The forecasting task is to use the covariates
at weeks t, t-1, t-2 to forecast the target variable at week t + 9. So the forecast horizon is nine (r = 9) and the
history length is three (h = 3). Each row in the graph corresponds to an instance. The length of the dashed arrows
are the forecast horizon and the length of the rectangles are the history length. The last instance is taken as the
test dataset; that is, to forecast week October 3–10 using the covariates on weeks July 25 to August 8. The earlier
eight red instances are not used and the yellow one before is used as the validation data instance. The green
instances form the training dataset.
be the raw validation and the data at weeks 1, …, T-r-2, T-r-1will be the raw training dataset. See Fig. 7
for an example.
Step 2: Rank the covariates according to the minimum redundancy maximum relevance (mRMR) method, based
on the value of the target variable and over the whole training plus validation data on the covariates.
This results in some ordering x1(t) > x2(t) > … > xC(t) of the covariates with respect to Y(t + r), renum-
bering as necessary, for t from 1 to T-r.
Step 3: Constructs the following covariate sets: Set#1 containing only the top ranked covariate; Set#2 contain-
ing both the first and second top ranked covariates, and so on until the last set containing all of the
covariates. This results in the covariate sets
{x1 (t)}, {x1 (t), x2 (t)}, . . . , {x1 (t), x2 (t), . . . , xC (t)}.
LaFoPaFo considers just these C different possible covariate sets. Note, for example, the combination
of the first and third covariates {x 1(t), x 3(t)} is not allowed (Supplementary Table 1).
Scientific Reports | (2021) 11:13822 | https://doi.org/10.1038/s41598-021-91365-2 8
Vol:.(1234567890)www.nature.com/scientificreports/
Step 4: Extend each of the above covariate sets by including their values at one, two, … up to five, former weeks.
We call each of the resulting sets, a feature set. That is, LaFoPaFo considers the following 5×C feature
sets:
history-length = 1 : {x1 (t)}, {x1 (t), x2 (t)}, . . . , {x1 (t), x2 (t) . . . , xC (t)},
history-length = 2 : {x1 (t), x1 (t − 1)}, {x1 (t), x1 (t − 1), x2 (t), x2 (t − 1)}, . . . , {x1 (t), x1 (t − 1), . . . , xC (t), xC (t − 1)}, . . .
history-length = 5 : {x1 (t), . . . , x1 (t − 4)}, {x1 (t), . . . , x1 (t − 4), x2 (t), . . . , x2 (t − 4)}, . . . , {x1 (t), . . . , x1 (t − 4), . . . , xC (t), . . . , xC (t − 4)}
The input of the final learned model will be the variables of one of these feature sets. Hence, LaFoPaFo
is seeking the optimal number of covariates and history-length. (Supplementary Table 1 shows
LaFoPaFo used h* = 3 and c* = 7).
Step 5: Construct the sub-training, validation, and test datasets corresponding to each feature set. Each of these
datasets consist of one column for the target variable and ch other columns for the features, where c is
the number of covariates selected, and h is the history-length used in that feature set. The rows of each
of these datasets correspond to the same rows as in the raw datasets.
Step 6: For each number of covariates c and history-length h, train a k nearest neighbor on the sub-training
dataset. Using the scikit-learn package, the value of k is chosen from the range of 10 to 200 by applying
a five-fold cross-validation on the sub-training dataset. Note that the cross-validation is only on the
sub-training, not the validation, nor the testing datasets.
Step 7: Evaluate each of the trained models on the validation dataset to find the best-at-validation model—ie,
the parameters k, c, h that had the lowest absolute error.
Step 8: Re-train the best-at-validation model on the whole sub-training and validation dataset with the same
optimal, k-value, number of covariates and history length that were chosen in Step 7. This is the final
model that the learner produces to forecast the target variable Y(T + r) at the single instance of the
testing dataset, with the given forecast interval r.
We repeat this procedure on each of the seven points in the testing dataset and take the mean to obtain the
mean absolute percentage error (MAPE) on the testing dataset. In line with other performance measures14, for
each forecast horizon, we calculated the standard deviation of the MAPE of the 7 predictions. This resulted in
the error bars in Figs. 1 and 2.
Comparison to existing models. The Center for Disease Control and Prevention (CDC) has provided
a platform that allows various research teams to submit their forecasts of the weekly number of COVID-19
deaths and confirmed COVID-19 cases in the US. We compared our final model with those COVID-19 predic-
tion models provided at the CDC website, for each target (cases or deaths), and for each forecast horizon (5 to
10 weeks). For each range r and target, we included only those CDC models that have provided forecasts at least
six out of the seven testing instances. Note that some models only predicted for a subset of the r values. For those
with forecasts for just 6 weeks, we calculated the MAPE over the provided 6 weeks. The forecasting performance
statistics, including the start and end dates, and definition of the epidemiological week, was consistent with our
setup for LaFoPaFo.
To make a more in-depth comparison, we conducted the following set of 2-sided t-tests. For each outcome
(cases, and deaths), each CDC model, and each forecast horizon r, we took two samples: (1) a vector of size
seven, consisting of the MAPE values of LaFoPaFo over each of the seven test weeks, and (2) a vector of size
seven, consisting of the MAPE values of that specific CDC model over each of the seven test weeks. We then ran
the t-test with the null hypothesis that both samples arise from the same distribution.
Assessing the design of the learner. To assess the different design features of LaFoPaFo, we conducted
a simple ablation test, where we modified each design feature at a time. To assess whether a feature produces
a possibly different model for each of the seven test points, we compared the performance to when the learner
produced only a single model, that it applied to all seven test points. To follow the last-fold partitioning, we
increased the “validation fold” to 7 weeks so that it equals the size of the “testing fold”. To assess the effect of
having a single fold as the validation, we re-ran LaFoPaFo when the validation size was increased to 30% of the
dataset after removing the 7 weeks corresponding to the held-out test set. To assess the effect of forecasting the
week of interest directly, we compared the results to when it predicted step by step, where it first predicts week
one, and then uses the resulting prediction to predict week 2, and so on. Finally, to assess the contribution of the
covariates to the prediction of our final model, we applied our learner to the reduced dataset consisting of only
the death covariates and called the resulting model, the one-feature model.
Daily forecasting. Above, we asked LaFoPaFo to forecast the weekly average number of cases. We also
assessed the performance of LaFoPaFo at making daily COVID-19 case and death predictions. We followed the
same setup used for the weekly predictions, but instead used daily data. We used the 21 days from September
20 to October 10, 2020 as the test points, with a maximum history length of 10 days and a forecast horizon of
14 days.
Scientific Reports | (2021) 11:13822 | https://doi.org/10.1038/s41598-021-91365-2 9
Vol.:(0123456789)www.nature.com/scientificreports/
Use of experimental animals, and human participants. The data used in this study is collected from
publicly available resources, and the authors did not perform any human or animal experiments.
Data availability
The number of deaths and confirmed cases are taken from Johns Hopkins University COVID-19 data repository15.
obility16. The temperature and precipita-
The google mobility data is taken from google reports of community m
tion is taken from Daily Summaries dataset17. A more detailed version of the dataset is under review18 and is
available online19.
Code availability
The codes are available at our Git repository https://github.com/network-and-Data-Science-IUT/covid-1920.
Received: 24 February 2021; Accepted: 20 May 2021
References
1. Sohrabi, C. et al. World Health Organization declares global emergency: A review of the 2019 novel coronavirus (COVID-19). Int.
J. Surg. 76, 71–76 (2020).
2. Coronavirus disease (COVID-19) Weekly Epidemiological Update. https://www.who.int/docs/default-source/coronaviruse/situa
tion-reports/20200907-weekly-epi-update-4.pdf?sfvrsn=f5f607ee_2 Accessed 16 Nov 2020 (World Health Organization (WHO),
n.d.).
3. Alderman, L., & Stevis-Gridneff, M. The Pandemic’s Economic Damage Is Growing. https://www.nytimes.com/2020/07/07/busin
ess/EU-OECD-coronavirus-economic-reports.html Accessed 16 Nov 2020 (2020).
4. Why Predictive Modeling is Critical in the Fight against COVID-19? Department of evidence and intelligence for action in health.
https://iris.paho.org/bitstream/handle/10665.2/52276/PAHOEIHISCOVID-19200007_eng.p df?s equence=5&isAllowed=y
Accessed 16 Nov 2020 (n.d.).
5. Moran, K. R. et al. Epidemic forecasting is messier than weather forecasting: The role of human behavior and internet data streams
in epidemic forecast. J. Infect. Dis. 214, S404–S408 (2016).
6. COVID-19 Forecasting: Background Information. https://www.cdc.gov/coronavirus/2019-ncov/cases-updates/forecasting.html
Accessed 15 Nov 2020 (Centers for Disease Control and Prevention, 2020).
7. Ray, E. L. et al. Ensemble forecasts of coronavirus disease 2019 (covid-19) in the US. MedRXiv. https://doi.org/10.1101/2020.08.
19.20177493 (2020).
8. COVID-19 Forecasts: Deaths. https://www.cdc.gov/coronavirus/2019-ncov/covid-data/forecasting-us.html Accessed 20 Dec 2020
(Centers for Disease Control and Prevention, 2020).
9. Wiggers, K. Google Updates Covid-19 Forecasting Models with Longer Time Horizons and New Regions. https://venturebeat.com/
2020/11/16/google-updates-covid-19-forecasting-models-with-longer-time-horizons-and-new-regions/ Accessed 20 Dec 2020
(VentureBeat, 2020).
10. COVID-19 Mathematical Modeling. https://w ww.cdc.gov/coronavirus/2019-ncov/covid-data/mathematical-modeling.html
Accessed 24 Oct 2020 (Centers for Disease Control and Prevention, n.d.).
11. Kuzmitski, H. ERDC COVID-19 model debuts on CDC website. https://www.erdc.usace.army.mil/Media/News-Stories/Article/
2198351/erdc-covid-19-model-debuts-on-cdc-website/ Accessed 20 Dec 2020 (US Army Corps of Engineers, 2020).
12. Ramazi, P., Kunegel-Lion, M., Greiner, R. & Lewis, M. A. Exploiting the full potential of Bayesian networks in predictive ecology.
Methods Ecol. Evol. 12(1), 135–149 (2020).
13. Mohri, M., Rostamizadeh, A. & Talwalkar, A. Foundations of Machine Learning (MIT Press, 2018).
14. Chowell, G., Tariq, A. & Hyman, J. M. A novel sub-epidemic modeling framework for short-term forecasting epidemic waves.
BMC Med. 17, 1–18 (2019).
15. COVID-19 Data Repository by the Center for Systems Science and Engineering (CSSE) at Johns Hopkins University. Git Hub. https://
github.com/CSSEGISandData/COVID-19 Accessed 14 Nov 2020 (n.d.).
16. COVID-19 Community Mobility Reports. Google. https://www.google.com/covid19/mobility/ Accessed 24 Oct 2020 (n.d.).
17. National Climatic Data Center of National Oceanic and Atmospheric Administration. National Centers for Environmental Infor-
mation. https://www.ncdc.noaa.gov/cdo-web/datatools/selectlocation Accessed 27 Oct 2020 (n.d.).
18. Haratian, A. et al. Dataset of COVID-19 outbreak and potential predictive features in the USA, Data in Brief. (under review).
19. Haratian, A. et al. Dataset of COVID-19 outbreak and potential predictive features in the USA, medRxiv, https://doi.org/10.1101/
2020.10.16.20214098.
20. LaFoPaFo code. Git. https://github.com/network-and-Data-Science-IUT/covid-19 (2020).
Acknowledgements
This work was funded by Alberta Innovates and Pfizer via project number RES0052027. ML gratefully acknowl-
edges support from NSERC and a Canada Research Chair. RV gratefully acknowledges support from Amii and
CONACYT. ZM gratefully acknowledges support from Isfahan University of Technology via project number
4300/1011. HW gratefully acknowledges support from NSERC. RG gratefully acknowledges support from Amii
and NSERC.This analysis has been partially funded by the Canadian Institute of Health Research Operating
Grant: COVID-19 May 2020 Rapid Research Funding Opportunity. Some of the computations were done using
Google Cloud, funded with generous Google Cloud Platform Research Credits.
Author contributions
P.R. designed and supervised the study, coordinated the implementation team, and contributed to the writing.
A.H. found relevant data sources, developed the code, led the implementation team, and helped with the writing.
M.M. and A.M. developed the code and helped with the writing. R.V. implemented and partly developed the
code and helped with the writing. Z.M. coordinated the implementation team, supervised the study, and helped
with revising the manuscript. M.L., H.W., D.W., and R.G., supervised the study and contributed to the writing.
Competing interests
The authors declare no competing interests.
Scientific Reports | (2021) 11:13822 | https://doi.org/10.1038/s41598-021-91365-2 10
Vol:.(1234567890)www.nature.com/scientificreports/
Additional information
Supplementary Information The online version contains supplementary material available at https://doi.org/
10.1038/s41598-021-91365-2.
Correspondence and requests for materials should be addressed to P.R.
Reprints and permissions information is available at www.nature.com/reprints.
Publisher’s note Springer Nature remains neutral with regard to jurisdictional claims in published maps and
institutional affiliations.
Open Access This article is licensed under a Creative Commons Attribution 4.0 International
License, which permits use, sharing, adaptation, distribution and reproduction in any medium or
format, as long as you give appropriate credit to the original author(s) and the source, provide a link to the
Creative Commons licence, and indicate if changes were made. The images or other third party material in this
article are included in the article’s Creative Commons licence, unless indicated otherwise in a credit line to the
material. If material is not included in the article’s Creative Commons licence and your intended use is not
permitted by statutory regulation or exceeds the permitted use, you will need to obtain permission directly from
the copyright holder. To view a copy of this licence, visit http://creativecommons.org/licenses/by/4.0/.
© The Author(s) 2021
Scientific Reports | (2021) 11:13822 | https://doi.org/10.1038/s41598-021-91365-2 11
Vol.:(0123456789)You can also read