Advances in Artificial Intelligence and Machine Learning - Advances in Artificial Intelligence and ...
←
→
Page content transcription
If your browser does not render page correctly, please read the page content below
Advances in Artificial Intelligence and Machine Learning
                                                                                                                Research | Vol 1 Iss 2, p.p: 111-130

      Development of a Pre-Diagnosis Tool Based on Machine Learning Algorithms on the
      BHK Test to Improve the Diagnosis of Dysgraphia

      Louis Deschamps1, Louis Devillaine1, Clement Gaffet1, Raphaël Lambert1, Saifeddine Aloui1, Jérôme Boutet1, Vincent
      Brault2, Etienne Labyt1, Caroline Jolly3*
      1
          Univ. Grenoble Alpes, CEA, Leti, F-38000 Grenoble, FRANCE.
      2
          Univ. Grenoble Alpes, CNRS, Grenoble INP, LJK, 38000 Grenoble, FRANCE.
      3
          Univ. Grenoble Alpes, Univ. Savoie Mont-Blanc, CNRS, LPNC, 38040 Grenoble, FRANCE.
      caroline.jolly@univ-grenoble-alpes.fr
      *
          Corresponding Authors: Caroline Jolly.

      Received: 05 July 2021
      Accepted: 02 August 2021
      Published: 12 August 2021

      ABSTRACT
      Dysgraphia is a writing disorder that affects a significant part of the population, especially school aged children and particularly
      boys. Nowadays, dysgraphia is insufficiently diagnosed, partly because of the cumbersomeness of the existing tests. This study
      aims at developing an automated pre-diagnosis tool for dysgraphia allowing a wide screening among children. Indeed, a wider
      screening of the population would allow a better care for children with handwriting deficits. This study is based on the world’s
      largest known database of handwriting samples and uses supervised learning algorithms (Support Vector Machine). Four
      graphic tablets and two acquisition software solutions were used, in order to ensure that the tool is not tablet dependent and can
      be used widely. A total of 580 children from 2nd to 5th grade, among which 122 with dysgraphia, were asked to perform the
      French version of the BHK test on a graphic tablet. Almost a hundred features were developed from these written tracks. The
      hyperparameters of the SVM and the most discriminating features between children with and without dysgraphia were selected
      on the training dataset comprised of 80% of the database (461 children). With these hyperparameters and features, the
      performances on the test dataset (119 children) were a sensitivity of 91% and a specificity of 81% for the detection of children
      with dysgraphia. Thus, our tool has an accuracy level similar to a human examiner. Moreover, it is widely usable, because of
      its independence to the tablet, to the acquisition software and to the age of the children thanks to a careful calibration and the
      use of a moving z-score calculation.

      Keywords: BHK test, Children, Diagnosis, Dysgraphia, Handwriting, SVM.

      I. INTRODUCTION
      Dysgraphia is a generic term used to describe handwriting deficits that lead to a poor-quality and/or slow script. Here, the most
      common definition is considered, as being a disturbance or difficulty in the production of written language that is related to the

                                                                                                                                      111
Citation: Caroline Jolly, et al. Development of a Pre-Diagnosis Tool Based on Machine Learning Algorithms on the BHK Test to Improve
the Diagnosis of Dysgraphia. Advances in Artificial Intelligence and Machine Learning. 2021;1(2):8.
© 2021 Advances in Artificial Intelligence and Machine Learning.
www.oajaiml.com | August-2021

mechanics of writing and the result of a failure to acquire the fine motor task of handwriting [1–4]. Depending on the country
and the method used, the proportion of children in the population varies between 5 and 34% [5, 6]. School aged children, and
particularly boys, seem to be the most affected.

The Concise Evaluation Scale for Children’s Handwriting (BHK) is the gold standard test used to evaluate handwriting quality
and speed and to diagnose dysgraphia in France [1]. It relies on the assessment of 13 qualitative criteria (such as the tilt of the
margin, the size of the letters or the space between words). The number of characters written by the child during the 5 minutes
of the test is also registered, to estimate handwriting speed. Children can be diagnosed as dysgraphic based on their score on
the 13 qualitative criteria or on their average writing speed. Very specific instructions are given to the people in charge of
evaluating the writing, in order to make the test as objective as possible. Nevertheless, despite training of the examiners, some
of the qualitative criteria remain subjective, such as ambiguous letters or chaotic writing, which is a potential source of false
negatives. In addition, this test only analyses the final product of handwriting, and does not take into account the dynamic
aspects of the writing process. Nowadays, the use of graphic tablets enables to record the pen motion during handwriting with
high spatial and temporal resolutions. These tools thus allow access to hidden kinematic features reflecting neuromotor
processes.

The objective of our work is to design a machine learning classifier relying on dynamic spatio-temporal handwriting texts
collected from children with and without dysgraphia, to help in the diagnosis of dysgraphia. Once designed, this tool should be
easy to scale up, faster and cheaper than the actual process. Mekyska et al. [2] designed a performing tool to pre-diagnose
dysgraphia based on writing a sequence of seven semi-letters, but their study focused on a limited population (27 children with
dysgraphia, 27 typically developing ones) and relies primarily on two tablet-dependent features: pen pressure and pen tilt data
[7]. Asselborn et al. [3] also developed a similar tool based on the handwriting of BHK texts that seemed very effective at first
sight but appeared lately flawed by some methodological issues that made their conclusions weaker [4]. These issues include
the use of distinct tablets for acquiring data from children with and without dysgraphia respectively, which create an undesirable
bias. Indeed, their algorithm may be biased to classify data from the two kinds of tablets rather than to detect children with
dysgraphia. Their database consisted in 56 children with dysgraphia and 242 control children. Importantly, according to
literature, 5 to 10% of these control children are expected to display dysgraphia, but this fact was not considered in their
analyses. Moreover, all children with dysgraphia were recruited at the Reference Center for Language and Learning Disorders
of the Grenoble Hospital. Therefore, all these children suffered from severe dysgraphia, which certainly introduced a bias in
the model toward recognizing only the most severe dysgraphia, as demonstrated recently [8]. Thus, when used with children
from a wider range of origins, notably children with less severe dysgraphia such as some children from schools, this model
could present difficulties to detect less severe cases of dysgraphia. These biases were partly corrected in their new study [9] by
using an IPad to acquire all their BHK texts. Once again, the results shown in this paper are very good, but they might not be
easily generalizable. Indeed, writing on a tablet is quite different from writing on a paper sheet, and it has been shown to affect
movement control and execution, especially in children [10-12]. Moreover, to achieve a generalizable model, it is preferable to
acquire data from different models of tablets and to use those in all groups. It is also important to mix mild and severe
dysgraphia. Finally, Dimauro et al. [13] obtained interesting results by focusing on the BHK features and trying to rate them
as a human examiner would.

                                                                                                                               112
www.oajaiml.com | August-2021

Most of the studies about dysgraphia are based on small population, around 30 or 40 children [5, 6, 14-16] and have a descriptive
approach, trying to determine whether a variable seems discriminant or not. Our approach is different as we mainly use the
features previously demonstrated as discriminant to predict if a child has dysgraphia or not. Acquiring the data with different
tablets and software solutions allowed us to determine that some of these features seemed too dependent on the acquisition
equipment to be used in a large-scale tool. In addition, our study is based on the largest dataset of labeled handwritten samples
ever published (580 children). For each children, we recorded the position of the pen tip, sampled every 5ms, during the writing
of the BHK test. In-air movements were also recorded. We chose to use the BHK test because it has been largely validated as
a good diagnosis tool. Out of 580 children, 122 had dysgraphia. Although imbalanced, our dataset is larger and more
representative of children with dysgraphia than previous studies. Our objective is thus to develop a more reliable tool based on
a large database, with different origins for generalizability and a very rigorous methodological approach in order to avoid
overfitting of the model.

II. MATERIAL AND METHODS
In this part, we describe the method applied to create the dysgraphia pre-diagnosis tool, from the participants selection to the
machine learning framework.

Participants
In total, 580 children were recruited, from 2nd to 5th grade. 450 of them come from 7 different schools (23 classes) near
Grenoble, France. Schools were selected to include different socio-economic environments. The 130 other children were
recruited at the Reference Center for Language and Learning Disorders of the Grenoble University Hospital (CRTLA, Centre
Hospitalier Universitaire Grenoble), where they came in the context of various neurodevelopmental disorders.

Task and Procedure
All the children involved in this study have written the BHK text on an A5 blank paper affixed in the landscape format to a
graphic tablet. The pen was inked to ensure conditions of writing close to those of the classroom. Four different Wacom graphic
tablets and two software solutions have been used in order to ensure that our results are not dependent on the equipment. The
”Ductus” software was developed by LPNC in 2010 [17]. The ”Graph Logger” software was developed at CEA-Leti. Both of
them were calibrated carefully as follows: to check the written length calibration, we measured different distances on the real
written tracks made by the children on paper. The same distances were measured on the computer database. These distances
were then compared to check the reliability of the tablets and software solutions. The sampling frequency was fixed at 200Hz
and the spatial resolution at 0.25mm. TABLE 1 summarizes the information about the graphic tablets and software solutions
used.
                  Table 1: Summary of graphic tablets and software solutions used to acquire the data
                  Software                        Graph Logger                                Ductus
                 Population               Schools             Hospital             Schools              Hospital
                   Tablet             Wacom Pro M          Wacom Pro L           Wacom 4M              Wacom 3L
                 Size (mm)               224x148              311x216              223x139             300x200
            Number of children              258                  29                  192                  101

                                                                                                                             113
www.oajaiml.com | August-2021

The conditions in which the children were performing the test were the same for all children. The instructions given to the
children were those explained in the BHK reference book [1]. Whatever the tablet size, the same size of paper sheet (A5) was
used for the test. We ensured that the writing posture was the same for all children.

The 5 first lines of all BHKs were scored by 1 to 3 trained therapists [8]. Mean quality and speed scores were then computed
and children were assigned to the Dysgraphia (D) group if at least one of the 2 scores was beyond 2 standard deviations from
the normative group. In this article “Dysgraphia” (D) refers to children from the hospital or from schools who presented a
dysgraphia. “No dysgraphia” (ND) refers to children from the hospital who did not present a dysgraphia. “Typical” (TD) refers
to the typically developing children from the schools, who did not present dysgraphia. In TABLE 2, the ND children are shown
separately from others to emphasize their relatively low scores compared to the TD children. When designing classification
algorithms, TD and ND groups were merged into a single group (no dysgraphia) and opposed to the D group.

Among the population acquired at CRTLA between 2nd grade to 5th grade, 92 children out of 130 (71%) presented a dysgraphia
based on the BHK, while the 38 other children (29%) did not. TABLE 3 and FIGURE 1 summarizes the scores and number of
children according to their diagnosis and to the places where they have been recruited.

  Table 2: Number of children between 2nd and 5th grade in the database according to the origin and the diagnosis.
                                                             Schools          Hospital      Total
                                  Typical (TD)
                                    Number                     420                 0         420
                               With dysgraphia (D)
                                    Number                      30                 92        122
                               No dysgraphia (ND)
                                    Number                       0                 38         38
                                All Annotations
                                    Number                     450                 130       580

                                   Table 3: Quality and Speed scores for each category.
                                                          Mean quality score (std)        Mean speed score (std)
                           Typical (TD)                          0.058 (0.92)                      0.66 (1.0)
                With dysgraphia from school (D)                      -2.6 (0.76)               0.067 (1.35)
                With dysgraphia from hospital (D)                    -3.1 (1.29)                -1.1 (1.08)
                       No dysgraphia (ND)                         -0.92 (0.66)                 -0.60 (0.73)

                                                                                                                         114
www.oajaiml.com | August-2021

 Figure 1: Quality and Speed scores with p-values. One the left the quality scores, on the right the speed scores of the
    BHK for each category. TD and ND don’t have dysgraphia but have different scores. D schools (children with
dysgraphia from school) and D hospital (children with dysgraphia detected at the hospital) both have dysgraphia but
                it is less severe for D schools (better quality and speed score). * : p < 0.05 ; ** : p < 0.005.

Data Processing
For each child, the gender, laterality, age and grade were recorded. During the acquisition, at each time stamp, 7 coordinates
are registered: the time, the x, y, z positions (up to 1 cm above the tablet) of the pen tip, the pressure applied by the pen on the
tablet, and the azimuth and altitude angles of the pen with the tablet.

Coordinates Preselection
Although pressure has previously been considered by several groups as discriminative when studying handwriting deficits
[18,19], Danna et al. [7] pointed out two limits of pressure quantification. The first one is the fact that pressure highly depends
on the tilt of the pen with respect to the writing surface. This leads to very different pressure measurements because of tilt
variations and not of pressure changes. Moreover, with standard graphic tablets, the pressure depends on the pen that is used.
This leads to significant differences between the values acquired with different tablets and/or pens. This is an important issue
for large studies as the one described in this paper, involving a large number of subjects, making the use of only one tablet and
one pen impossible. Tablet dependency has also been noticed for pen tilt with regard to the tablet. Moreover, we noticed some
important irregularities in the pressure values in our database that could ultimately lead to a bias in the pre-diagnosis tool. For
these reasons, we decided not to use the pen pressure and pen tilt data to create our models.

Filtering
To get rid of any noise that might cause a tablet dependency, a low pass fourth order Butterworth filter with a cut-off frequency
of 15 Hz was applied on all the data. We chose the frequency of 15 Hz after a bibliographic study comparing the frequencies
used in several articles [20-23]. In general, all the handwriting information is found between 0 and 10 Hz, most of it being
located around 5 Hz. Choosing a cut-off frequency of 15 Hz allowed us to include all the writing information while attenuating
the high frequency noise. The Fast Fourier Transform (FFT) algorithm has been applied on the x and y components of the pen
speed, corroborating the fact that no important information about the writing process is found above 15 Hz.

                                                                                                                                115
www.oajaiml.com | August-2021
Features Extraction
More than 90 features were implemented in total. Some of them are very specific to the BHK test, such as line or margin
inclination, and others are more general. To stay as close as possible to the BHK test, we decided to analyze only the first five
lines written by the children although some children wrote more. We developed an algorithm able to recognize the first five
lines written by each child and calculated all our variables on these lines. When the algorithm failed to recognize the five lines
(because of a very poor-quality handwriting for instance), we selected them manually. This happened for 99 children out of
580 (17%). Thanks to this manual correction, we were able to ensure the same number of written lines taken into account for
all children.
The counting features (number of velocity peaks, number of draw backs…) were used raw, and normalized by the writing time.
This allowed the models to have access to the value of the features on the 5 lines of the BHK, and per unit of time. The main
variables we used are described below:
BHK Specific Features
• The features that are specific to the BHK are listed below.
• Continuity: difference on the y axis between consecutive words for each line. The median, the standard deviation, the
25 and 75% quantiles were computed.
• Crow flies: sum of the distances between consecutive strokes.
• Draw backs per line: a draw back is a stroke that belongs to a previous word than the current one. This feature
corresponds to the number of draw backs divided by the number of lines.
• Lines height: median of the differences between the highest and lowest points of each line.
• Margin evolution: for each line, the margin is defined as the x coordinate of the leftmost point. The difference between
the consecutive lines was computed. Features calculated were the median and the standard deviation of these
differences. The average of the significant differences (>2 mm) was also computed.
• Slopes of the lines: for each line, we calculated the linear regression of all points included in that line. We extracted
the standard deviation of the slopes of all lines to quantify the consistency of the lines.
• Space between lines: mean difference on the y coordinate of the leftmost point for each line.
• Space between words: the space between each word was calculated. We extracted the mean, the median, the standard
deviation, and the 75% quantile.
• Standard deviation of the distance between the points of a line and the linear regression corresponding to this line.
The goal of this feature is to evaluate the regularity of the written line around the corresponding linear regression. The
standard deviation of this feature among the lines is computed to estimate the regularity of the writing during the task.
• Telescoping per line: number of strokes with a point closer than 0.5 mm to a stroke of the next line, divided by the
number of lines.
• Width and Height: the width is the difference between the highest and lowest x coordinates of all points. The height
is the difference between the highest and lowest y coordinates of all points.
116www.oajaiml.com | August-2021
Figure 2: Illustration of feature SNvpd on a "g" written by a subject. Here the SNvpd is 4-2 = 2.
General Features
• The more general features, which could be applied to all sort of stimuli, are listed below.
• Average Normalized Jerk: the jerk is the third time derivative of the position. It has been shown to be a discriminative
feature to identify children with dysgraphia [7]. We computed the Average Normalized Jerk (ANJ) as described in
[7].
• Distance to moving average: two features were extracted. The first one is the percentage of variation between the true
writing path and the moving averaged path of order 11. The second one is the average distance from real points to
moving average points.
• Lift Time: lift time is the time spent during the writing task with the pen tip in the air. Four features are computed:
total lift time, ratio of total lift time by record time, mean lift duration and standard deviation of the lifts duration.
• Mean writing velocity: this feature extracts the ratio between the written length and the writing time. Thus, it does not
take into account the time and distance when the pen is in the air.
• Slow moves: a slow move starts when less than 1mm is written in 150 ms and ends when the local speed is higher
than 1/150 for at least 3 consecutive points. We extracted the number of slow moves, the mean, median and standard
deviation of their duration. The ratio between the total slow moves length and the total written length was also
calculated as well as the ratio between the total slow move time and the total writing time.
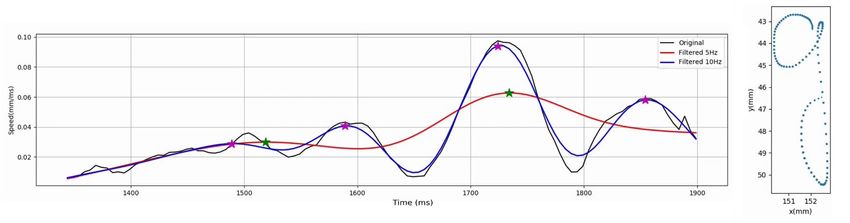
• SNvpd: this feature was defined in [7]. It consists in subtracting the number of velocity peaks when filtering the signal
with a low-pass filter with a cut off frequency of 5 Hz to the number of velocity peaks when filtering the signal with
a low-pass filter with a cut off frequency of 10 Hz (cf FIGURE 2). Danna et al. [7] demonstrated its efficiency to
describe abnormal velocity fluctuations in cursive handwriting. Thus, this feature might be performing to discriminate
children with dysgraphia from the others.
• Stops: stops were only taken into account when the pen tip still touches the paper. A stop starts when less than 0.01
mm is written in 5 ms and ends when more than 0.01 mm is written in 5 ms. The number of stops, their mean, median
and standard deviation of their duration were used.
• Abnormal stops: abnormal stops are defined as stops longer than 35ms. Looking at this abnormal stops has been
recommended by Paz-Villagran et al. in [24].
117www.oajaiml.com | August-2021
• Stops on the x/y axis: a stop on a specific axis is defined as a normal stop. It starts when less than 0.01 mm is written
on the current axis in 5 ms, and ends when more than 0.01 mm is written on the same axis in 5 ms.
• Record Time: Total Time taken by the subject to write the stimulus (here the 5 BHK lines).
• Strokes: this feature calculates the number of strokes the child has drawn during the writing task, as well as the mean,
maximum and the standard deviation of their duration. The number of strokes could be higher for children with
dysgraphia once reported to a same written distance or writing time.
• Velocity peaks: the number of velocity peaks is supposed to be higher for children with handwriting difficulties [21].
Here, we chose to extract the number of velocity peaks, but also the mean, median and standard deviation of the
amplitude of the peaks.
• Writing length: this feature extracts the total length of the “on-paper” trace.
• Writing time: this feature extracts the total “on-paper” time.
• Rényi Entropy of order 2 [25]: delivers an information about the entropy of the trajectory along x axis (resp. y or (x,
y)). The entropy rate is linked to the uncertainty of the path, which manifests through a chaotic and unpredictable
handwriting that is typical of children with dysgraphia. Their total Rényi Entropy (1) is supposed to be higher in
absolute value. We also extracted the mean and standard deviation of the Rényi entropy of the standardized and
normalized strokes.
N −1
RE2 = − log(∑ pi )
2
(1)
i =2
• where N is the number of dots in the signal of interest (which is either x or y or the two-dimensional time series of
both x and y), and p are the probabilities of each dot i to be where they are considering that the handwriting is a strictly
uniform movement.
• Signal-to-Noise Ratio (SNR) [25]: reveals quick and unexpected movements from the children by comparing the
trajectory along x (resp. y) to its smoothed version obtained by applying a basic low-pass-filter. Children with
dysgraphia shall have a lower value for this feature. We have modified this feature as it appears in [25] because the
energy term was not relevant in its computation (2).
1 1
SNR = × (2)
N N(s)
• where N is the number of dots in the signal s (which is either x or y). N(s) represents the noise of the signal.
It is computed as the sum of the squared difference between the signal and its smoothed version.
Machine-Learning Approach
Train/Test split: In order to be able to validate the performances of the classification model on a completely separate, unseen
dataset, the full database was split into a train dataset (80% of the children) and a test dataset (20 % of the children) from the
start. These datasets were carefully made in order to keep the same proportion of children with and without dysgraphia in each
of them. Moreover, the same proportion of children in each grade was kept. All the following processing steps were applied on
the train dataset only, to avoid any data leakage.
118www.oajaiml.com | August-2021
Moving z-Score calculation: One of the main challenges to develop a performing diagnosis tool is the wide range of ages and
grades. It is indeed not possible to compare straightforwardly 6 years old children to 10 years old ones, as handwriting skills
improve very quickly during this developmental window. Adding the age and grade of the children in the inputs of the classifier
improved the performances, but a bias was still present.
To limit the influence of age and grade, we used a moving z-score method. The idea was to standardize the calculated features
in a similar way to the BHK test. First, the raw scores of all features were calculated for all participants. Then for each child,
we selected all the children of the same grade, or of similar age (+/- 6 months). Only the children recruited in schools,
representative of the population, were taken into account at that point. The mean and standard deviation of all features were
calculated among these children. Finally, the z-score for each feature was calculated using these moving mean and standard
deviation. With this method, each child was compared to a unique set of children who are in the same grade than him/her and/or
are close to his/her age. FIGURE 3a presents the raw score of the feature “Stroke Mean Time” for all children, and FIGURE
3b presents the moving z-score of the same feature. The z-scored feature is much more appropriate than the raw score, as it
allows a straightforward comparison between children of different ages.
All classification models were developed to use the moving z-scored features as input.
Figure 3: Mean duration of the strokes of all children as a function of age, without (a) and with (b) moving z-score
computation.
119www.oajaiml.com | August-2021
Features Preselection
In order to make a preselection of the discriminative features, the Fisher criterion method has been used. This method consists
in computing the ratio between the inter-class variance and the intra-class variance for each feature. The features maximizing
this ratio are potentially efficient to discriminate the different classes of the problem. As explained in [26], this method selects
each feature independently according to their scores under the Fisher criterion. Therefore, it fails to select the features that have
relatively low individual scores but a very high score when they are combined together. In addition, it cannot handle redundant
features. Because of these limits, this method was only used as a preselection technique, and was completed with a Sequential
Forward Floating Selection method (SFFS) later on in the process. The 40 features with the best Fisher criterion score were
selected as the starting point of the SFFS method. The classes used to compute the Fisher criterion are the children with
dysgraphia (D) on one side and the children without dysgraphia (TD + ND) on the other side.
For information, the 10 best features from the Fisher criterion are the following ones, ranked from the highest Fisher
score to the lowest:
• Record time
• Total writing time
• Total lift time
• SNvpd
• Number of velocity peaks
• Mean duration of the lifts
• Stroke maximum time
• Number of stops
• Number of stops on the x axis
• Standard deviation of the slow moves duration
Training of the Model
Once the features computed and ordered according to the Fisher criterion, we were able to start training the classification model.
The Scikit-learn package [27] was used to develop our algorithms with the language Python. To choose which machine learning
method to use for the pre-diagnosis tool, we decided to compute the performances of 11 different techniques using the 40 best
features from the Fisher criterion method described above. Default hyperparameters were used for this comparison. The
sensitivity (3) (proportion of actual children with dysgraphia that are correctly identified as such, corresponding to the True
Positive ratio) and specificity (4) (proportion of actual children without dysgraphia, TD or ND, that are correctly identified as
such, corresponding to the True Negative ratio) obtained with all techniques are given in TABLE 4. Because both sensitivity
and specificity are important factors for this model evaluation step, their mean, the balanced accuracy, was computed as well
and used to compare models performances. We can see in FIGURE 4 the models and their balanced accuracy score. These
performances were computed on the validation groups using a k-fold cross validation repeated 1000 times, as described in the
process below.
120www.oajaiml.com | August-2021
TP
sensitivity = (3)
TP + FN
TN
specificity = (4)
TN + FP
Where:
• TP is the number of children with dysgraphia (D) that are correctly identified as such
• FN is the number of children with dysgraphia (D) that are not correctly identified
• TN is the number of children without dysgraphia (TD + ND) that are correctly identified as such
• FP is the number of children without dysgraphia (TD + ND) identified as with dysgraphia
With so few data, normal deep learning methods would not have good performances. However, it was decided to test a class
of Recurrent Neural Network: Long short-term memory (LSTM) networks, adapted for analysis of time series. To this end, raw
data was directly used instead of the features extracted from it, because LSTM go through time series with a settable time
window and is able to retain some long-term information and pattern [28]. The raw data was filtered with a low pass fourth
order Butterworth filter with a cut-off frequency of 15 Hz before feeding it to the network, with 10 epochs with batches of size
40. The network consists of one LSTM layer of size 64, followed by a dense layer with a sigmoid activation. The package
TensorFlow [29] was used for this model.
Table 4: Classification performances of different machine learning techniques. They were all evaluated with
default hyperparameters, except for LSTM, which had a layer of size 64 and a sigmoid activation. The model selected
for the following steps (fine-tuning and evaluation on the test set) was the one with the best-balanced accuracy.
Model Sensitivity Specificity Balanced Accuracy
Gaussian Process 35% 95% 65%
LSTM 74% 58% 66%
SVM (polynomial kernel degree 2) 40% 92% 66%
Decision Tree 48% 85% 66,50%
SVM (polynomial kernel degree 3) 39% 96% 68%
SVM (sigmoid kernel) 68% 68% 68%
Gradient Boost 50% 93% 71,50%
Gaussian Naive Bayes 56% 90% 73%
Random Forest 63% 84% 73,50%
Adaboost 55% 93% 74%
121www.oajaiml.com | August-2021
SVM (linear kernel) 70% 84% 77%
SVM (RBF kernel) 74% 80% 77%
Figure 4: Graph display of the previous results. We see both SVM with linear and RBF kernels were better than the
other models, but RBF work better in practice with a lot of problems.
Support Vector Machine (SVM) with linear kernel and Radial Basis Kernel (RBF) showed comparable performances (the two
rightmost models in FIGURE 4). Following this comparison, it was decided to use SVM technique with RBF kernel to design
the pre-diagnosis tool. RBF kernel is indeed known to work well in practice for a lot of problem. Moreover, it is relatively
simple to tune with only two hyperparameters.
SVM is one of the most commonly used Machine Learning technique [16]. It is known to perform well even with high
dimensional data and small datasets [30]. Different weights can be assigned to the samples, which makes the model usable with
imbalanced datasets as done in this study. The Scikit-learn website gives a good overview of the SVM technique. For more
details, one can refer to [31].
To tune a SVM using a RBF kernel two hyperparameters have to be considered: C and γ. C is common to all SVM kernels. It
trades off misclassification of training examples against simplicity of the decision surface. The γ parameter defines how much
influence a single training example has. As described below, a large number of features has been developed, and the Fisher
criterion cannot be used alone to select features. In order to make an effective classification algorithm and to avoid overfitting,
a features selection approach was lead using the Sequential Forward Floating Selection (SFFS) method [32].
122www.oajaiml.com | August-2021
To conciliate hyperparameters optimization and features selection, the following process was carried out. A first set of
hyperparameters was set using a Random Search method with the 40 best features according to the Fisher criterion. Then the
SFFS method was applied to identify the most discriminative features. A new set of hyperparameters was then fixed with a
new Random Search optimization, and so on.
Because our datasets were imbalanced (many more children without dysgraphia than children with it) we used a balanced
accuracy metric to evaluate the quality of the models during training. Every time a set of hyperparameters and features was
fixed, the model was evaluated using a repeated stratified 10-fold cross validation [33]. Here is a summary of the method:
• Shuffle the train dataset randomly
• Split the train dataset into k groups (here k = 10), keeping a similar proportion of children with and without dysgraphia
in each group
• For each unique group:
o Take the group as a validation data set
o Take the remaining groups as a training data set
o Fit a model on the training set and evaluate it on the validation set
o Retain the evaluation score and discard the model
This whole process was repeated 1000 times, and the performances were averaged over these 1000 10-fold repetitions. The
final selected hyperparameters and features were the ones leading to the best-balanced accuracy averaged on these 1000 k-
folds.
Test of the Final Model on the test Dataset
With the final hyperparameters and features, a model was trained using the whole train dataset. This model was
finally tested on the test dataset (20 % of the children) set aside at the beginning of the machine learning procedure
and not used for the model training. The test dataset was normalized with the moving z-score calculation method
described above using the average and standard deviation values from the train dataset, in order to avoid data
leakage.
III. RESULTS
The results of the rating of the BHK of all children are presented in TABLE 3. Among the children recruited in schools, 30
have been diagnosed with dysgraphia (6.7%). This is in agreement with previous observations [1, 8]. As expected, the average
quality score of the children with dysgraphia from the hospital is lower than that of children with dysgraphia from schools. The
first ones have an average BHK quality score of -3.1 and an average speed score of -1.1 whereas the second ones have an
average quality score of -2.6 and an average speed score of 0.1. According to Welch’s t-test, these means are significantly
different (pwww.oajaiml.com | August-2021
The hyperparameters optimization and features selection loop converged to the following results:
• C = 0.374
• γ = 0.144
The best performances of the models on the validation folds were obtained with a total of 15 features listed below (cf Features
extraction for more details about the features).
• BHK specific features (4):
o Draw backs per line
o Mean of the significant differences of the margin (>2 mm)
o Standard deviation of the space between the words
o Number of telescoping per line
• General features (11):
o Mean duration of the slow moves
o Mean Rényi Entropy of order 2 on the x axis
o Mean Rényi Entropy of order 2 on the y axis
o Mean velocity of the velocity peaks
o Number of stops on the x axis
o Number of strokes per second
o Number of velocity peaks per second
o Strokes median time
o Signal to Noise ratio on the y axis
o Total lift time
o Total writing time
One can note the presence in these features of some of the best features from the Fisher criterion. Unfortunately, the SNvpd,
which was expected to be a discriminative feature, does not emerge. On the other hand, the total writing, total lift time, number
of stops on the x axis and number of velocity peaks, which were among the best features from the Fisher criterion, were selected
by the SFFS process. All these features are linked with the dynamic characteristics of dysgraphia (see Features extraction for
more precisions). With these features and hyperparameters, the results of the final model on the test dataset are the following:
- Specificity: 91%
- Sensitivity: 81%
- Accuracy: 86%
- Balanced Accuracy: 83%
This means that 91% of the children with dysgraphia and 81% of the children without dysgraphia were correctly identified as
such.
Out of 22 children with dysgraphia in the test dataset, only 2 were badly identified by the model. The first one had a BHK
quality score of -2.03 and a BHK speed score of -0.57. Therefore, he/she is very close to not presenting a dysgraphia, and one
can imagine that another human examiner could have diagnosed this child as without dysgraphia as well. The other false
124www.oajaiml.com | August-2021
negative child had a quality score of -3.49, but a speed score of 1.29, meaning that he/she wrote the BHK text quite fast. This
fast writing may have misled the model, TABLE 5.
Table 5: Confusion matrix of the final classification model on the test dataset.
Predicted label
No Dys Dys
No Dys
81% 19%
True label
9% 91%
Dys
On the other hand, out of the 97 children without dysgraphia in the test dataset, 18 were identified as having dysgraphia by the
model (false positive). The average BHK quality score of these children is -0.46, and their average speed score is -0.01. More
than half of these false positive children (12 out of 18) have a quality score and/or a speed score close to or below -1, meaning
they present signs of a poor handwriting. Diagnosing these children as having dysgraphia does not seem problematic as they
could benefit from an appointment with a clinician to help improve their handwriting. Three out of the 6 last children have
written the text in an unusual way (only on 2 or 3 lines, or with many erasures), which may have misled the model. Two
examples of written records of such children are given in FIGURE 5 and FIGURE 6.
Figure 5: Example of written record of one of the false positive children who wrote the BHK text with many erasures.
Figure 6: Example of written record of one of the false positive children who wrote the BHK text on 3 lines only.
125www.oajaiml.com | August-2021
IV. DISCUSSION
Database Richness
This paper is based on the world’s largest database of numeric handwriting samples. This database was carefully acquired using
four different models of graphic tablets and two acquisition software solutions. Thus, our results are likely to be the most
reliable for a large-scale use. Moreover, children were recruited from various origins to ensure a wide range of writing
characteristics. Recruiting children with dysgraphia from the hospital is a good way to increase the number of data available
for children with dysgraphia. But we would like to emphasize the fact that it is very important to include children with
dysgraphia from schools in the database, since a difference in the severity of dysgraphia between children recruited in hospital
and in schools has been described [8], which is in agreement with our results. This ensures that the model is not biased toward
recognizing only the most severe dysgraphia. We indeed confirmed that the children from the hospital have significantly worse
BHK quality and speed scores than the children with dysgraphia from schools. This can be explained by the fact that only the
worst writers are sent to the Reference Center for Language and Learning Disorders of the Grenoble Hospital. Thus, the model
created by Asselborn et al. in [3] seems biased, and the excellent performances claimed by the authors must be qualified. A
comment paper [4] has been published to highlight some methodological issues creating some important biases in this paper,
such as artifacts not filtered and not written by the children, only present in the (D) dataset, or the lack of correction for age-
related changes in features. Therefore, the strength of our database is not only its size, but also its inclusion of a wide range of
profiles allowing better generalizability of the models.
BHK Test Limitations
We would also like to stress that the inter-rater correlation in the French version of the BHK test goes from 0.68 for beginner
raters, to 0.90 for very experienced ones [1]. The intra-rater agreement percentage is around 85% when correcting the same
texts with a 6 months interval [1]. Thus, the mean sensitivity and specificity of around 80% obtained by our classifier are thus
comparable to what we could expect from a single human expert rated by his peers. In order to improve these figures, it could
be necessary to assess all BHK texts by multiple raters to try to get as close as possible from a purely objective and certain
label of the children.
Moving z-Score Computation
Between the age of 6 and 10, the children handwriting improves quickly, creating big differences in the quality of the written
trace between a 6-year-old and a 10-year-old child. Consequently, comparing the handwriting quality of children of different
ages is difficult. In this paper, we developed the method that we called the “moving z-score” to compensate for this handwriting
quality improvement with respect to children age. Thanks to this method, we were able to gather children of various ages in
the same database and use them all to create a dysgraphia pre-diagnosis model.
Comments on the Feature Selected for the Final Model
Almost all features in the final model we developed are interpretable (durations, number of peaks, writing regularity…). An
advantage of our model compared to a method that would be only based on highly sophisticated, non-interpretable features is
that once a child is identified as having dysgraphia, our tool could help the clinicians to identify which aspects of the
handwriting have to be improved. In addition, our tool is more valuable for researchers working on dysgraphia, as the features
used as inputs of our model are more easily interpretable in terms of neuromotor or neuropsychological processes.
126www.oajaiml.com | August-2021
Several selected features are closely related to the detection of irregularities in writing. These irregularities are not sources of
precision loss, but instead constitute the basis of the discrimination between typical and atypical writing, since children with
dysgraphia tend to present these irregularities. Some features are related to the static features of the writing, such as “Number
of telescoping per line” (which represents overlapping characters) or “Standard deviation of the space between the words”
(which represents irregularity in word separation): this is mostly what the standard BHK test evaluates. Other features are
linked to the kinematic of the movement during writing, such as “Mean Rényi Entropy” (which represents erratic movements)
or “Number of stops” (which represents the difficulty to write without making stops). Thus, irregularities in writing should not
be filtered, but instead interpreted as they are relevant for detecting children with dysgraphia.
Comments on the Model Performances
Table 6: Results from other studies. Some studies tried several models of classification of children whith dysgraphia
(D) and typically developing children (TD). 1The score used is not balanced accuracy but only the percentage of
children with dysgraphia actually detected by the algorithm. 2The score used is the accuracy, because the sets are
almost balanced.
Reference D/TD repartition Model used Score
[2] 27/27 Random Forest 96.43%
[3] 56/242 Random Forest 97.9%
[16] 48/43 SVM (RBF Kernel) 82.51%
[34] 24/971 RNN 90%1
[35] 48/43 Backpropagation 84.7%
[36] 42/36 Random Forest 67%
[36] 42/36 SVM 66%
[36] 42/36 AdaBoost 64%
[37] 57/63 Random Forest 77.6%2
[37] 57/63 SVM 78.8%2
[37] 57/63 AdaBoost 79.5%2
The classification performances presented are a little bit below the ones given in some recent papers [3, 34], but close or better
than some others [16, 35–37], and they are presented in TABLE 6. The results in these papers are good and very interesting
but each of these articles has a limitation that seems to make it unfit to be extended for a large-scale dysgraphia pre-diagnosis.
[3, 34] only study children with dysgraphia from the CRTLA. Yet we just showed that their BHK scores are in average
significantly worse than the ones of a more generic dysgraphic population recruited in schools. Therefore, there is strong chance
that models showing good performances on these children would give poorer results when tested at a large scale on children
from schools. On the contrary, we have included children with dysgraphia from schools, improving generalizability of the
model if used on populations not from medical centers. On the other hand, [16, 35, 36] only focus on a small number of children
(91 and 78), which can be an issue especially when the data have high dimensions. Moreover [16] and [35] use writing on a
tablet device (Android), which is known to affect movement control and execution [10-12]. Once again, there is no proof that
127www.oajaiml.com | August-2021
the performances they claim could be generalized. Finally, Drotár et al. [37] used more than 1000 features with a database of
120 children, which may lead to some overfitting to the database. Besides, the children with dysgraphia included in their study
come from the “Centre for Special-Needs”, which may indicate that they do not represent the general population of children
with dysgraphia, but again only the children with really low BHK score. Our study is the only one that focuses on a large
number of children with dysgraphia from various origins and with a wide range of BHK scores. Therefore, the results presented
in this paper are certainly the most realistic ones for a wide screening of the population.
V. CONCLUSION
Aiming to develop a pre-diagnosis tool for dysgraphia, we created a database of handwriting trajectory of 580 children,
including 122 children with dysgraphia, by using four graphic tablets and two acquisition software solutions. Moreover, the
age-related evolution of handwriting has been taken into account thanks to the moving z-score method. In order to avoid bias
of our pre-diagnosis algorithm towards the children with the most severe dysgraphia, we also considered children with
dysgraphia from the general population from schools. We used a SVM approach as this kind of algorithm is known to exploit
not only the most relevant features but also “minor features”. They are also known to give good performances with high
dimensional problems. Our SVM based model achieves a sensitivity of 91% for children with dysgraphia and a specificity of
81% for children without dysgraphia. Thus, our tool has an accuracy level comparable to a human examiner. Although our
model is based on BHK rating from 1 to 3 raters, it would be improved if BHK tests were rated by more raters in order to
minimize the effect of the inter-rater variability, well known for the BHK test. Overall, our dysgraphia pre-diagnosis algorithm
could be widely usable, because of its independence to the tablet, the acquisition software and the age of the children. The
approach by classification algorithms as we present in this paper and as we can find in [3] is a good first step toward automated
pre-diagnosis of dysgraphia. However, its main flaw is that it does not estimate the severity of dysgraphia. Indeed, further work
will aim at developing and estimating the performances of a regression model for dysgraphia severity, and compare it to BHK
scores.
Finally, writing the BHK text takes some time and is clearly language dependent. Developing a model able to diagnose
dysgraphia based on language-independent stimuli such as drawings would allow creating a unique international diagnosing
tool for dysgraphia.
VI. CONFLICTS OF INTEREST
The authors declare no conflict of interest.
VII. ACKNOWLEDGMENTS
We would like to thank Laurence Castéran and Dr Marie-Ange Nguyen-Morel from the Reference Center for Language and Learning
Disorders of the Grenoble University Hospital (CRTLA), Ingrid Zammouri, Dr David Cohen, and Dr Thomas Gargot who helped in the
scoring of the BHK tests at the Child Psychiatry Department at Pitité-Salpêtrière in Paris, the teachers, and all children and their parents who
accepted to contribute to this study.
This research work was funded by the CEA Bottom-Up funding program, the CDP IDEX NeuroCoG, and the FR/SFR Pôle Grenoble
Cognition of the University Grenoble Alpes.
128www.oajaiml.com | August-2021
VIII. ETHICAL GUIDELINE
This study was conducted in accordance with the Helsinki Declaration. It was approved by the Grenoble University Ethics
Committee (Agreement No. 2016-01-05-79). The writing consent of all children’s parents and the oral consent of all children
have been acquired.
IX. REFERENCES
1. Charles M, Soppelsa R, Albaret JM. Bhk: ÉChelle D’éValuation Rapide de L’éCriture. Les Éd. du Centre de
psychologie appliquée, 2004.
2. Mekyska J, Faundez-Zanuy M, Mzourek Z, Galaz Z, Smekal Z, et al. Identification and Rating of Developmental
Dysgraphia by Handwriting Analysis. IEEE Trans. Hum.-Mach. Syst. 2017;47:235–248.
3. Asselborn T, et al. Automated Human-Level Diagnosis of Dysgraphia Using a Consumer Tablet. Npj Digit. Med.
2018; 1:1–9.
4. Deschamps L, Gaffet C, Aloui S, Boutet J, Brault V, et al. Methodological Issues in the Creation of a Diagnosis Tool
for Dysgraphia. Npj Digit. Med. 2019;2:1-3.
5. Rosenblum S, Dvorkin AY, Weiss PL. Automatic Segmentation as a Tool for Examining the Handwriting Process of
Children With Dysgraphic and Proficient Handwriting. Hum. Mov. Sci. 2006;25:4–5.
6. Di Brina C, Niels R, Overvelde A, Levi G, Hulstijn W. Dynamic Time Warping: A New Method in the Study of Poor
Handwriting. Hum. Mov. Sci. 2008; 27:242–255.
7. Danna J, Paz-Villagrán V, Velay JL. Signal-To-Noise Velocity Peaks Difference: A New Method for Evaluating the
Handwriting Movement Fluency in Children With Dysgraphia. Res. Dev. Disabil. 2013;34:4375–4384.
8. Gargot T, et al. Acquisition of Handwriting in Children With and Without Dysgraphia: A Computational Approach.
PLOS ONE. 2020;15:e0237575.
9. Asselborn T, Chapatte M, Dillenbourg P. Extending the Spectrum of Dysgraphia: A Data Driven Strategy to Estimate
Handwriting Quality. Sci. Rep. 2020;10:3140.
10. Gerth S, Klassert A, Dolk T, Brenner-Fliesser M, Fischer MH, et al. Adapting to the Surface: A Comparison of
Handwriting Measures When Writing on a Tablet Computer and on Paper. Hum. Mov. Sci. 2016; 48: 62-73.
11. Guilbert J, Alamargot D, Morin MF. Handwriting on a Tablet Screen: Role of Visual and Proprioceptcive Feedback
in the Control of Movement by Children and Adults. Hum. Mov. Sci. 2019;65:30-41.
12. Alamargot D, Morin MF. Does Handwriting on a Tablet Screen Affect Student’s Graphomotor Execution? A
Comparison Between Grades Two and Nine. Hum. Mov. Sci. 2015;44: 32-41.
13. Dimauro G, Bevilacqua V, Colizzi L, Di Pierro D. Testgraphia, a Software System for the Early Diagnosis of
Dysgraphia. IEEE Access. 2020;8:19564–19575.
14. Lin Q, Luo J, Wu Z, Shen F, Sun Z. Characterization of Fine Motor Development: Dynamic Analysis of Children’s
Drawing Movements. Hum. Mov. Sci. 2015; 40:163-175.
15. Falk TH, Tam C, Schellnus H, Chau T. On the Development of a Computer-Based Handwriting Assessment Tool to
Objectively Quantify Handwriting Proficiency in Children. Comput. Methods Programs Biomed. 2011; 104:e102–
e111.
129www.oajaiml.com | August-2021
16. Sihwi SW, Fikri K, Aziz A. Dysgraphia Identification From Handwriting With Support Vector Machine Method. J.
Phys. Conf. Ser. 2019;1201:012050.
17. Guinet E, Kandel S. Ductus: A Software Package for the Study of Handwriting Production. Behav. Res. Methods.
2010:42:326–332.
18. Rosenblum S, Livneh-Zirinski M. Handwriting Process and Product Characteristics of Children Diagnosed With
Developmental Coordination Disorder. Hum. Mov. Sci. 2008;27:200-214.
19. Baur B, et al. Modified Pen Grip in the Treatment of Writer’s Cramp. Hum. Mov. Sci. 2006;25:464–473.
20. Accardo AP, Genna M, Borean M. Development, Maturation and Learning Influence on Handwriting Kinematics.
Hum. Mov. Sci. 2013;32:136-146.
21. Chang SH, Yu NY. Handwriting Movement Analyses Comparing First and Second Graders With Normal or
Dysgraphic Characteristics. Res. Dev. Disabil. 2013;342433–2441.
22. Djioua M, Plamondon R. Studying the Variability of Handwriting Patterns Using the Kinematic Theory. Hum. Mov.
Sci., 2009;28:588–601.
23. Caligiuri MP, Teulings HL, Dean CE, Niculescu AB, Lohr JB. Handwriting Movement Kinematics for Quantifying
Extrapyramidal Side Effects in Patients Treated With Atypical Antipsychotics. Psychiatry Res. 2010;177:77–83.
24. Paz-Villagrán V, Danna J, Velay JL. Lifts and Stops in Proficient and Dysgraphic Handwriting. Hum. Mov. Sci.,
2014;33, 381–394.
25. Drotar P, Mekyska J, Rektorova I, Masarova L, Smekal Z, et.al. Decision Support Framework for Parkinson’s Disease
Based on Novel Handwriting Markers. IEEE Trans. Neural Syst. Rehabil. Eng. 2015;3:1–1.
26. http://arxiv.org/abs/1202.3725.
27. Pedregosa F, et al. Scikit-Learn: Machine Learning in Python. J. Mach. Learn. Res. 2011;12:2825-2830.
28. Hochreiter S, Schmidhuber J. Long Short-Term Memory. Neural Comput. 1997;9:1735-80.
29. https://research.google/pubs/pub45166/
30. Niu X, Yang C, Wang H, Wang Y. Investigation of Ann and Svm Based on Limited Samples for Performance and
Emissions Prediction of a Crdi-Assisted Marine Diesel Engine. Appl. Therm. Eng. 2017;111:1353–1364.
31. Cortes C, Vapnik V. Support-Vector Networks. Mach. Learn. 1995;20:273–297.
32. Pudil P, Novovičová J, Kittler J. Floating Search Methods in Feature Selection. Pattern Recognit. Lett. 1994;15:1119–
1125.
33. Arlot S, Lerasle M. Choice of V for V-Fold Cross-Validation in Least-Squares Density Estimation. J. Mach. Learn.
Res. 2016;17:1-50.
34. http://arxiv.org/abs/1906.07576
35. Alamargot D, Morin MF. Does Handwriting on a Tablet Screen Affect Student’s Graphomotor Execution? A
Comparison Between Grades Two and Nine. Hum. Mov. Sci. 2015;44: 32-41.
36. Dankovičová Z, Hurtuk J, Feciľak P. “Evaluation of Digitalized Handwriting for Dysgraphia Detection Using Random
Forest Classification Method,” in 2019. IEEE 17th International Symposium on Intelligent Systems and Informatics
(SISY), Sep. 2019:000149–000154.
37. Drotár P, Dobeš M. “Dysgraphia Detection Through Machine Learning,”. Sci. Rep. 2020;10:21541.
130You can also read