Africa Day 2021 Solid engine of growth - Ramon Fernandez Deputy CEO, Finance, Performance and Development - Orange
←
→
Page content transcription
If your browser does not render page correctly, please read the page content below

Africa Day 2021
Solid engine of growth
Ramon Fernandez
Deputy CEO, Finance, Performance and Development

Alioune Ndiaye
CEO of Orange Middle East and Africa

Paris, July 30th 2021

Disclaimer

This presentation contains forward-looking statements about Orange's financial situation, results of
operations and strategy. Although we believe these statements are based on reasonable assumptions, they
are subject to numerous risks and uncertainties, including matters not yet known to us or not currently
considered material by us, and there can be no assurance that anticipated events will occur or that the
objectives set out will actually be achieved. In particular, the Covid-19 outbreak may exacerbate the risks that
the Group could face. More detailed information on the potential risks that could affect our financial results is
included in the Universal Registration Document filed on 20 April 2020 with the French Financial Markets
Authority (AMF) and in the annual report (Form 20-F) filed on 21 April 2020 with the U.S. Securities and
Exchange Commission. Forward-looking statements speak only as of the date they are made. Other than as
required by law, Orange does not undertake any obligation to update them in light of new information or
future developments.

                                                                                                      Africa Day 2021   2
Acceleration of Growth in Q2 2021
                                                                                                       +1.9 pts EBITDAaL margin yoy

   in €m                    Q2 21    yoy cb       H1 21           yoy cb
   Revenues                 1,555   +14.4%         3,043     +10.7%
   Retail services          1,359   +15.8%         2,660     +12.8%
                                                                                                                                    34.5%
   Wholesale                  157    +0.6%           310      -5.6%                                          32.7%
   Equipment sales             30    42.2%            54     +28.8%
   EBITDAaL                                        1,051     +17.0%
                                                                                                           H1 2020 cb             H1 2021
   eCAPEX                                            525     +21.0%
                                                                                                              EBITDAaL           EBITDAaL margin

   Acceleration of retail services growth…                                                …thanks to fast growth engines

    Revenue cb yoy growth in %                                                          Revenues growth Q2 yoy                              +24%
                                                                              15.8%

                                                                                14.4%
                                                           10.5%                                                     +22%
         10.2%                                                       9.8%                      +23%
                     8.5%    9.0%
 7.9%                                           7.1%                                                                                                             Q2 2020
         7.6%                         4.7%                                                                                                                       Q2 2021
                                                           8.3%        7.1%
                     6.1%
                             6.2%
  5.8%
                                                 5.1%                                          FBB                    OM                    Data
                                        1.3%

 Q2 19   Q3 19   Q4 19      Q1 20   Q2 20      Q3 20      Q4 20       Q1 21   Q2 21          1.9 m                  22,6 m                  38.2 m
                                                                                             Customers              active customers*       4G customers
                 Retail services    Total MEA                                                +30% yoy               +15% yoy                +37% yoy

                                                                                          * At least one transaction per month
                                                                                                                                                    Africa Day 2021        3
Key driver of growth, margin and cash for the Group

                                                    MEA share of
                                       Group’s adju. EBITDA (2017) / EBITDAaL
                                                        (2020)

               MEA share of                                          >15%
             Group’s revenues

                                >13%                      14%                            MEA share of
                                             13%
                                                                                EBITDA-Capex (2017) / EBITDAaL-
                                                                                eCapex (2020) of telecom activities
                   13%
                                             2017        2019         2021
      12%
                                                                                                          >20%

      2017        2019          2021

                                                                                             14%
                                                                                10%

                                                                                2017        2019          2021

                                                                                                     Africa Day 2021   4
Relevant capital allocation strategy and strong execution to fuel value

    High potential &              Operational excellence &           Sustainable
   balanced portfolio               strong costs control            value creation

   Natural risk mitigation         >+5%                         Strong ROCE growth (pts)
                                   Total CA CAGR 17-20

   4.4% yoy
   OMEA footprint CA
   Average growth over 12 years
                                   +7%
                                   EBITDAaL CAGR 17-20
                                                                     +5.7
   21st century is and will        >+15%
   remain the century of Africa    EBITDAaL-eCapex CAGR 17-20

                                   >+33%                                2017    2020
                                   OCF CAGR 17-20

                                                                                 Africa Day 2021   5
Delivering more and more value

    Asset turnover                                                              Profit margin              ROCE
    Revenue/Capital Employed N-1                                                EBIT /revenue              EBIT /Capital employed N-1

                      +6 pts
                                                                                                                     +5.7 pts
                               75.0x
                                                                                        +6.9 pts

                 69.0x

                                                         X                                             =
                 2017          2020                                                   2017     2020                2017     2020

         Capital expenditure                                                      Direct margin
                                                                                                                  Value creation for
      prioritising and optimising                                             management and control
                                                                                                                    shareholders
          to support growth                                                      of indirect costs

    Note : ROCE (n) = Adj. EBIT (n) / Net Operating Assets (n-1) including goodwill
    2012-2017: IAS18 accounting standard / 2020- IFRS 16
                                                                                                                                Africa Day 2021   6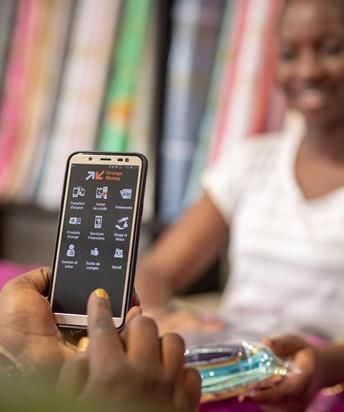
1   Operational execution excellence

2   Value-driven capital allocation strategy

3   Solid growth engine with significant potential ahead

4   A continuous optimisation of our operating model

5   Sharing value with all stakeholders

6   To realise strong and sustainable ambitions

Leading position in all our operations
1
Operational
execution
Leadership position in 8 markets (in value) Orange stronger leader in mobile excellence
First challenger in 7 markets (in value) value market shares (Points in value, 2020)
Orange leader in value Market Orange’s market share
#1 Morocco(1)
#2/4
Jordan
#2/3 share relative to the second position relative to the
#2 Mali competitor in the market market leader
#1/3 Egypt
#3/4
#3
4.1 x
3.4 x
Senegal
#1/4
Guinea-B. Central African
#1/2 Republic(1)
* #2/3
2.2 x
Guinea Cameroon
#1/4 #2/4
1.8 x
1.8 x
1.6 x
1.5 x
Sierra Leone(1)
1.3 x
#1/3 D.R.C. (1)
#2/4
1.0 x
0.9 x
0.9 x
Liberia
0.8 x
0.7 x
#1/2
0.6 x
0.6 x
0.5 x
Ivory Coast
#1/3 Madagascar
#2/4
Burkina Faso
#1/3
*
CAM
DRC
EGY
LIB
MAD
JOR
BIS
SEN
GUI
BUR
CAR
SIE
MOR
MAL
IVC
BOT
Botswana
#2/3
(1) (1) (1)
Source: Orange MEA (1)
(1) Countries estimates based on volume market share
Africa Day 2021 8
With an increasing number of customers*                                                  1
                                                                                 Operational
                                                                                  execution
                                                                                 excellence

                                               55.2m
             132m                         Orange Money accounts
     Mobile Customers

                          38.2m                                     1.9m
                          4G customers                            FBB Customers

  * As of June 30, 2021

                                                                       Africa Day 2021       9
High level of customer satisfaction
1
Operational
execution
excellence
9
Customer
NPS leadership in: C3 Centric
markets* Culture
9 customers 4 customers
Over 10 recommend Over 5 are satisfied with
Orange in all our countries the digital experience
(Customer Effort Score) Digital
Multi-
Leader position in: services
Customized usage Unified
Network quality Internet access Navigation speed Simple
12 11 11
countries countries countries
*Consolidated perimeter (16 countries) and Tunisia
Source : monthly barometer on quality of services done by an external study on a sample of prepaid
Source IPSOS
active customers and supervised by Orange MEA, IPSOS France and affiliates. Africa Day 2021 101 Operational execution excellence 2 Value-driven capital allocation strategy 3 Solid growth engine with significant potential ahead 4 A continuous optimisation of our operating model 5 Sharing value with all stakeholders 6 To realise strong and sustainable ambitions
Balanced and agile portfolio built by stages since 1996                                                                                                                2
                                                                                                                                                                     Capital
                                                                                                                                                                   allocation
                                                                                                                                                                    strategy

    A solid presence…                                                         …with limited exposure to FX risk and
                                                                              strong local shareholding structure (1)
                                Tunisia*
                                2009
   Morocco
   2010
                                           Jordan
                                           2000

   Mali                                                                                                                                  Orange
   2003                                    Egypt
                                           1998
                                                                                                      13%                                Local private investors
                                                                                                                                         Local authorities, governments
   Senegal
   1997
                                                                                              26%
   Bissau
   2007
                                           C.A.R
                                           2008                                                                           62%
                                           Cameroon
   Guinea                                  2000
   2007

   Sierra Leone                                                     1%
   2016

   Liberia                                 D.R.C.
   2016                                    2011
                                                                              23%                Intra-group debt
   Ivory Coast                                                                                                                                                         XOF
                                                                  0.65x
                                           Madagascar
                                                                                                                                            €5.8bn 45%
   1996
                                           1996
                                                                                                 External funding in                                                   XAF
   Burkina Faso
   2016
                                                                  Net debt/
                                                                                                 local currency
                                                                                                                                49%            2020
   Botswana
                                           Mauritius*             EBITDAaL                                                                   revenues                  Other
                                                                                                 External funding in
                                           2000
   1998

                                                        76%                                      foreign currency
                                                                                                                                                    6%
     Country
      Inception date

     *Under the equity method

                                                        (1)   Based on OMEA percentage of interest in each entity’s equity (internal calculation)    Africa Day 2021           12
Demonstrating resilience in the long term and reactivity in the short term 2
Capital
allocation
strategy
OMEA revenues growth vs. GDP Growth V-shape recovery after COVID-19 hit in 20Q2
(Constant/without inflation) (Revenues yoy growth)
8.3%
7.6%
6.5% 6.1% 6.2%
5.8%
6.1% 6.2% 5.3% 5.1%
5.1%
5.2%
1.3%
4.1% 4.1%
4.4%
4.2%
2009-2020
Average growth Q1.2019 Q2.2019 Q3.2019 Q4.2019 Q1.2020 Q2.2020 Q3.2020 Q4.2020
2.7% +4.4%
2.5%
2.1% +3.7%
Contingency plans exceeding COVID-19 impact
(EBITDAaL evolution)
Arab spring and Lowest economic growth
COVID-19
crisis in Côte d’Ivoire in two decades in Africa
+1.5pt
33.7%
'09 '10 '11 '12 '13 '14 '15 '16 '17 '18 '19 '20
+1.0pt
Orange growth GDP constant -0.4pt
32.2% +0.8pt
2019 Performance ex Covid contingency 2020
Covid
Note: Same perimeter & Exchange rate (2020A) - Including DRC, Liberia, Burkina Faso and Sierra Leone from 2016
Source: Orange MEA, WEO IMF – April 2021 Africa Day 2021 13All subregions contributing to a growth in acceleration 2
Capital
Top line growth acceleration EBITDAaL-eCapex growth acceleration allocation
strategy
+6.8% > 6.0 +21% ~1.2
5.7 +15% 0.9
+5.7% 5.4 0.8
0.7
5.1 0.6 EBITDAaL
1.6 1.7 1.9
4.8 1.6 eCapex
-1.0 -1.0
FY17 FY18 FY19 FY20 FY21E -1.0 -1.0
Note : historical figures restated with a constant foreign exchange rate FY17 FY18 FY19 FY20 FY21E
Note : historical figures restated with a constant foreign exchange rate
Contribution of the strongest country: Revenues and EBITDAaL CAGR 2017-2020 : growth coming
a portfolio more balanced than our peers’ from all clusters
12.8%
40%
Airtel Africa
47%
9.3%
32% revenues
MTN 7.0%
36% 6.6% 6.5% 6.5% EBITDAaL
5.6% 5.7% 5.3%
78% 4.5%
Vodacom
78%
57%
Maroc telecom
63
15% Total Sonatel Ivory Coast MENA Central
Orange MEA* 17% Revenues
OMEA cluster cluster Africa
EBITDA
Source: Companies’ financial results full year in December 2020 and march 2021
*MEA contributive figures Africa Day 2021 14A segment regularly beating analysts’ expectations 2
Capital
allocation
strategy
Revenue CAGR (cb in %) EBITDAaL/ Adju. EBITDA (before 2019) growth (cb in %)
Actual vs Consensus Actual vs Consensus
Analysts’preview
10.0% in 2020 before
6.2% 9.5% COVID
Analysts’preview
in 2020 before
5.1% 5.2% COVID
7.0%
5.2%
3.0%
2017 2018 2019 2020 2017 2018 2019 2020
Actual Consensus FY17 Consensus FY18 Consensus FY19 Consensus FY20
Africa Day 2021 151 Operational execution excellence 2 Value-driven capital allocation strategy 3 Solid growth engine with significant potential ahead 4 A continuous optimisation of our operating model 5 Sharing value with all stakeholders 6 To realise strong and sustainable ambitions
Successfull transformation of our business mix                                                                                                                                3
                                                                                                                                                                      Solid growth
                                                                                                                                                                         engine

                                                                                                 … thanks to the construction of 3 growth engines addressing both
   Acceleration of retail growth more than offset wholesale decline…
                                                                                                 retail and B2B customers taking over from the declining voice

                                 CA CAGR 2017-19                        CA CAGR 2019-21                                  Retail revenues split by service

                Retail
                                                     +8.5%                                +>9%
(incl. equipment sales)

            Wholesale -7.7%                                  ->9%
                                                                                                       Voice

              Blended                            +5.7%                                +>6.5%
                                                                                                       Data            >50%            50%
                                                                                                               31%
                          2017                                              2021

                             83%
                                                                               91%
                                                                                                                       FY17            FY19             FY21
                                       Retail (incl.equipement sales)
                                       Wholesale

                                                                                                                                                            Africa Day 2021       17
Data : penetration potential ahead 3
Solid growth
engine
Strong path of growth while 4G just starting… … with still significant potential ahead…
Mobile telco services ARPU (€) Mobile telco services revenues (in €Bn)
29% 64% 4.4x B2B
2.6 Traffic Data* Opportunities
CAGR CAGR 3.9 4G penetration in Smartphones
3% 6% subsaharan Africa in in 2025 vs between 2019
2025 vs 12% in 2020* 48% in 2020* and 2025
3.3
2.4
FY17 FY20 FY17 FY20 … that we are in the best position to realise given our hard-to-
replicate competitive advantages
4G penetration in mobile base Data revenues (in €Bn)
1.5
Direct growth
potential mainly x2 Distribution
in sub-Saharan network with Premium Extended New value-
Africa
1.5 900 000 customer mobile added
Mainly driven
0.8 points of service coverage services
26% by MENA sale
9%
FY17 FY20 FY17 FY20
Note : historical figures are restated with a constant foreign exchange rate
*source GSMA Africa Day 2021 18FBB : an agile approach to capture fibre & fixed LTE acceleration 3
Solid growth
engine
Our relevant multi-technology approach is bearing fruits… … and is precisely defined according to
new market opportunities …
FBB customer base (mSubs) FBB revenue (in €Bn)
x2 1.7 X2 +30% X2 B2B
0.4 Population growth FBB subscriptions FTTH subscriptions & wholesale
0.8 0.2 by 2050 increase by 2025 increase by 2025 opportunities
(2/3 of growth in
urban area)
FY17 FY20 FY17 FY20
FBB customer base by technology FBB revenue by technology …and leveraging on the first-mover advantage
Fibre
Fixed LTE 25%
20%
60% FTTH
Incumbent Targeted
33% connectable
x10 in fixed segment ambition in
X4.7 homes 1.6m in
ADSL in SEN, ICO and MAR, MAL,
42% 29% 2020 => x2 by
2% 42% Fixe LTE JOR BUR, EGY
9% 11% Fibre
2023
FY17 FY20 FY17 FY20
Note : historical figures are restated with a constant foreign exchange rate
Africa Day 2021 19Orange Money : we built key differentiators to pursue our success story 3
Solid growth
engine
Continuous success in mobile financing services still with
… in a market that is not yet mature…
penetration potential…
Money penetration in mobile base Money revenue
(in €Bn)
60-80% Traditional banks not able
to deal with
B2B
of adult population
such large number of people Opportunities
being unbanked
Direct growth 0.5 transacting with small amounts
potential
0.2
38%
28%
FY17 FY20 FY17 FY20 … and where we have built key differentiators
Money ARPU on active customer base
% active customers in money base (in €)
CAGR Distribution Banking
1.9 Solid Registered
Direct growth 6% network with services
3.4m reputation of as Electronic
potential 1.6 300 000 available
trustful Money
points of with Orange
35% 45% partner Institution
sale Bank Africa
FY17 FY20 FY17 FY20
Note : historical figures are restated with a constant foreign exchange rate
Africa Day 2021 20Orange Bank Africa : 3
Solid growth
to become the key player in financial inclusion in Africa engine
Successful launch in Ivory Coast ... …to be followed by a clear expansion plan
575k customers in 1 year 3 openings planned in 2022*:
With >60% with a credit Senegal, Mali, Burkina
48bn FCFA injected into the financing New services to come :
of personal projects and activities of small Micro-credits, devices financing,
entrepreneurs insurances, B2B
*Subject to the approval of central banks
Africa Day 2021 21To become the favorite digital multi-services operator in MEA 3
Solid growth
engine
Including both Customer … developing Multiservice and … enabling Data & IA and Robot Process
Relations and Distribution digitalisation... Marketplace environments… Automation in every country…
Ongoing Development of digital touchpoints New Orange Multiservice App
Creation of 2 data squads
enabling Data & IA skills in
every O-MEA country thanks
13 10 #Multiservice to a specific innovative model
Countries with Countries with
Deployment of Data Usage
live E-shops live Chatbots #Payment Cases in all countries starting
Data & IA with Capex optimisation and
#Market place
Next Best Action
Increase of existing Telco & Money apps audience
#Chatbot
#IA
11.5 2.5 #Finance
MyOrange App Orange Money 8 RPA* programs deployed in
active users (m) active users (m) O-MEA countries to learn
#API
from employee behaviour
New UX/UI Process and automatising processes
Interactions and tasks
Automation
+50% over Digital in
2020
… monitoring internal transformation to win the skills battle:
« Digital-inside » development Dat-driven culture Cloud computing Network virtualisation IA & Data science skills (Engineering/ Architecture / Visualisation)
Africa Day 2021 221 Operational execution excellence 2 Value-driven capital allocation strategy 3 Solid growth engine with significant potential ahead 4 A continuous optimisation of our operating model 5 Sharing value with all stakeholders 6 To realise strong and sustainable ambitions
EBITDAaL fueled by efficiency efforts and indirect costs management                                                                   4
                                                                                                                              Continuous
                                                                                                                              optimization

           EBITDA/aL margin significant increase                          EBITDAaL margin distribution narrowing
                                                                                 (number of operations)

                              +1.6 pts
                                                       37.5%
                                 0.8pt

           35.9%                 0.8pt
                                                                                                             2017     2020

                                                        33.7pt
            32.1pt

                                direct margin
                                Indirect costs
                                lease

             3.8pt                                       3.8pt

             Y19                                         Y20               Below 25%        25%-35%         Above 35%
     EBITDA margin (actual)                      EBITDA margin (actual)

                                                                                                                    Africa Day 2021       24
Leveraging our scale to increase cost synergies 4
Continuous
optimization
68.000 km submarine cables
Casablanca hub
• OMEA headquarters
• MENA regional office
• Network engineering centre
• Security centre
Dakar hub
• Sonatel Group headquarters
• Finance shared services centre
• Djoliba headquarters
• Network supervision centre
Abijian hub
• Orange Ivory Coast
Djoliba network 1st pan-african backbone
headquarters 10,000km
• Orange Bank Africa
headquarters
• Mowali headquarters
• Orange Money Compliance
and shared services centres
Africa Day 2021 25Concrete examples of how we make savings real 4
Continuous
optimization
Direct costs: distribution case Indirect costs: energy case
+150%
Electricity price for
+16 pts telco sector in 2012
27%
21%
17% Self top-up via 3 Solar farm project in Jordan
11% Orange Money Solar farms
launched in 2019
energy contribution
to technical opex
2017 2018 2019 2020 75%
Orange needs
+1.3 pts covered
consumption
costs
+2pt x3
/2
Telco direct EBITDAaL impact
(from 2019)
margin after
commissions
2017 2018 2019 2020 Y11 Y16 Y18 Y20
Africa Day 2021 261 Operational execution excellence 2 Value-driven capital allocation strategy 3 Solid growth engine with significant potential ahead 4 A continuous optimisation of our operating model 5 Sharing value with all stakeholders 6 To realise strong and sustainable ambitions
Make digital services more accessible :                                                                             5
to accelerate economic development in a sustainable way
                                                                                                               Sharing value
                                                                                                                  with all
                                                                                                               stakeholders

              Developing                    Democratizing
              digital skills               access to digital

         8 Orange Digital Centers
                                                   Sanza
             in our footprint:
                                          affordable smart feature
        Tunisia, Senegal, Cameroon,                phone
           Ethiopia, Ivory Coast,
          Jordan, Morocco, Mali

             Major player in                  Support to             Solar panel leader*
           financial inclusion             entrepreneurship
                                                                     in 5 countries
                                                                     To date, more than 5 400
            Orange Bank Africa            Orange Ventures MEA
                                                                     telecom sites use solar
                                          to finance 100 start-up
              Orange Money                        by 2025            panels in our footprint
                                                                     (equivalent of 55m liters of
                                                                     fuel oil savings per year)

                                                                              “Net zero carbon” target
                                    Boost digital inclusion
                                                                                      by 2040
                                                                        * In number of solar panels   Africa
                                                                                                          Africa
                                                                                                             DayDay
                                                                                                                 2021
                                                                                                                    2021   28
1 Operational execution excellence 2 Value-driven capital allocation strategy 3 Solid growth engine with significant potential ahead 4 A continuous optimisation of our operating model 5 Sharing value with all stakeholders 6 To realise strong and sustainable ambitions
Fast growth engines and strong discipline to achieve our cash objective                                                                                                                              6
                                                                                                                                                                                                 Strong and
                                                                                                                                                                                                 sustainable
                                                                                                                                                                                                  ambitions

                                                                                EBITDAaL                     OCF*
                                                     Revenues                                             > EBITDAaL
                                                      growth                       Double                   growth
                                                                                    digit
                                                                                   growth
                                                       ~6%

                                                                                          CAGR
                                                                                         2020-23

   *Organic cash flow corresponding to net cash provided by operating activities, minus (i) repayments of lease liabilities and on debts related to financed assets, and (ii) purchases
   and sales of property, plant and equipment and intangible assets, net of the change in the fixed assets payables, (iii) excluding effect of telecommunication licenses paid and
   excluding effect of significant litigations paid (and received).                                                                                                                       Africa Day 2021   30
You can also read