AIN COMMUNICATIONS - Oxford Academic ...
←
→
Page content transcription
If your browser does not render page correctly, please read the page content below
doi:10.1093/braincomms/fcz046 BRAIN COMMUNICATIONS 2020: Page 1 of 18 | 1
BRAIN
AIN COMMUNICATIONS
Is tau in the absence of amyloid on the
Alzheimer’s continuum?: A study of discordant
PET positivity
Downloaded from https://academic.oup.com/braincomms/article/2/1/fcz046/5682400 by guest on 28 October 2020
Alexandra J. Weigand,1 Katherine J. Bangen,2,3 Kelsey R. Thomas,2,3 Lisa Delano-Wood,2,3
Paul E. Gilbert,4 Adam M. Brickman5 and Mark W. Bondi2,3, for the Alzheimer’s Disease
Neuroimaging Initiative*
* A full list of Alzheimer’s Disease Neuroimaging Initiative investigators can be found in Appendix I.
The amyloid cascade model of Alzheimer’s disease posits the primacy of amyloid beta deposition preceding tau-mediated neurofib-
rillary tangle formation. The amyloid-tau-neurodegeneration biomarker-only diagnostic framework similarly requires the presence
of amyloid beta for a diagnosis on the Alzheimer’s continuum. However, medial temporal lobe tau pathology in the absence of
amyloid beta is frequently observed at autopsy in cognitively normal individuals, a phenomenon that may reflect a consequence of
aging and has been labelled ‘primary age-related tauopathy’. Alternatively, others argue that this tauopathy reflects an early stage
of the developmental continuum leading to Alzheimer’s disease. We used positron emission tomography imaging to investigate
amyloid beta and tau positivity and associations with cognition to better inform the conceptualization of biomarker changes in
Alzheimer’s pathogenesis. Five hundred twenty-three individuals from the Alzheimer’s Disease Neuroimaging Initiative who had
undergone flortaucipir positron emission tomography imaging were selected to derive positron emission tomography positivity
thresholds using conditional inference decision tree regression. A subsample of 301 individuals without dementia (i.e. those with
normal cognition or mild cognitive impairment) had also undergone florbetapir positron emission tomography imaging within
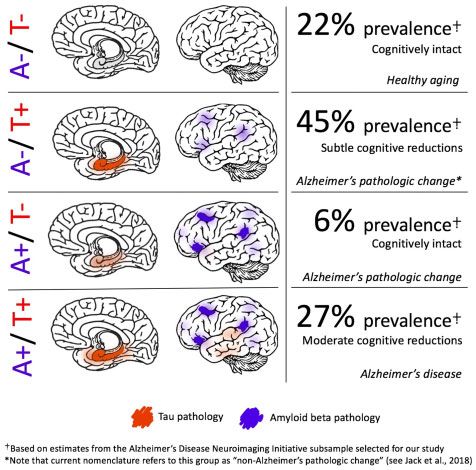
12 months and were categorized into one of the four groups based on cortical amyloid and Braak stage I/II tau positivity: A/T,
Aþ/T, A/Tþ, or Aþ/Tþ. Tau positivity in the absence of amyloid beta positivity (i.e. A/Tþ) comprised the largest group,
representing 45% of the sample. In contrast, only 6% of the sample was identified as Aþ/T, and the remainder of the sample fell
into A/T (22%) or Aþ/Tþ (27%) categories. A/T and Aþ/T groups had the best cognitive performances across memory,
language and executive function; the A/Tþ group showed small-to-moderate relative decreases in cognition; and the Aþ/Tþ
group had the worst cognitive performances. Furthermore, there were negative associations between Braak stage I/II tau values
and all cognitive domains only in the A/Tþ and Aþ/Tþ groups, with strongest associations for the Aþ/Tþ group. Among our
sample of older adults across the Alzheimer’s pathological spectrum, 7-fold fewer individuals have positron emission tomography
evidence of amyloid beta pathology in the absence of tau pathology than the converse, challenging prevailing models of amyloid
beta’s primacy in Alzheimer’s pathogenesis. Given that cognitive performance in the A/Tþ group was poorer than in individuals
without either pathology, our results suggest that medial temporal lobe tau without cortical amyloid beta may reflect an early stage
on the Alzheimer’s pathological continuum.
1 San Diego State University/University of California San Diego Joint Doctoral Program, San Diego, CA 92182, USA
2 VA San Diego Healthcare System, San Diego, CA 92161, USA
3 Department of Psychiatry, University of California, San Diego, CA 92161, USA
4 Department of Psychology, San Diego State University, San Diego, CA 92182, USA
5 Department of Neurology, Taub Institute for Research on Alzheimer’s Disease and the Aging Brain, College of Physicians and
Surgeons, Columbia University, New York, NY 10032, USA
Received August 05, 2019. Revised November 15, 2019. Accepted November 25, 2019. Advance Access publication December 20, 2019
C The Author(s) (2019). Published by Oxford University Press on behalf of the Guarantors of Brain.
V
This is an Open Access article distributed under the terms of the Creative Commons Attribution Non-Commercial License (http://creativecommons.org/licenses/by-nc/4.0/), which per-
mits non-commercial re-use, distribution, and reproduction in any medium, provided the original work is properly cited. For commercial re-use, please contact
journals.permissions@oup.com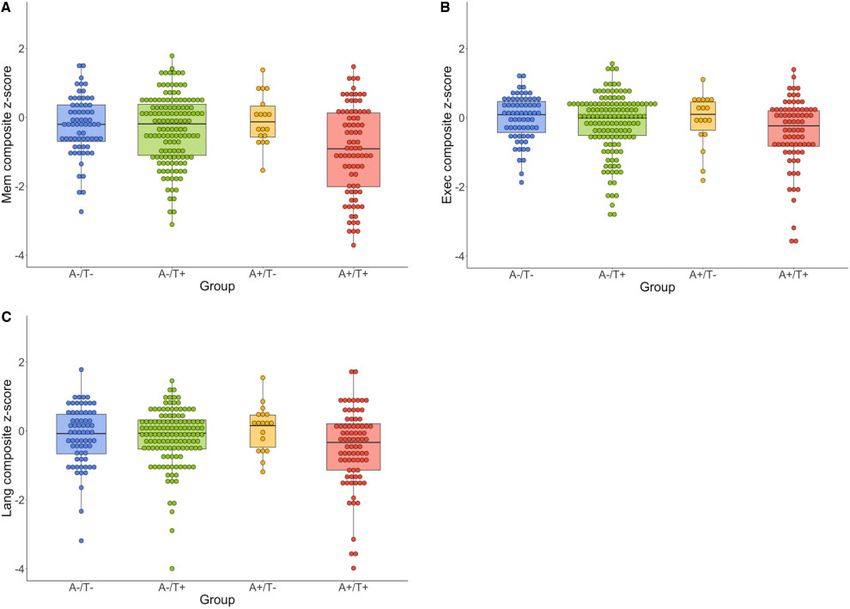
2   | BRAIN COMMUNICATIONS 2020: Page 2 of 18                                                               A. J. Weigand et al.

Correspondence to: Mark W. Bondi, PhD,
ABPP-CN, VA San Diego Healthcare System (116B),
3350 La Jolla Village Drive, San Diego,
CA 92161, USA
E-mail: mbondi@ucsd.edu

Keywords: tau imaging; amyloid imaging; Alzheimer’s disease; mild cognitive impairment; biomarkers
Abbreviations: ADNI ¼ Alzheimer’s Disease Neuroimaging Initiative; AT(N) ¼ amyloid-tau-neurodegeneration; Ab ¼ amyloid
beta; APOE ¼ apolipoprotein E; CN ¼ cognitively normal; MTL ¼ medial temporal lobe; MCI ¼ mild cognitive impairment;
PART ¼ primary age-related tauopathy; SUVR ¼ standardized uptake variable ratio

Graphical Abstract

                                                                                                                                   Downloaded from https://academic.oup.com/braincomms/article/2/1/fcz046/5682400 by guest on 28 October 2020
Introduction                                                    AD has recently come under scrutiny (Ricciarelli and
                                                                Fedele, 2017; Morris et al., 2018).
Amyloid beta (Ab) plaques and tau neurofibrillary tangles         A recent re-conceptualization of the AD diagnostic
represent two of the original defining neuropathological        framework has built upon the amyloid cascade hypothesis
features of Alzheimer’s disease (AD; Alzheimer, 1907).          by proposing a biomarker characterization of the disease
Although initially no distinction was made in the relative      in terms of Ab pathology (A), tau pathology (T), and
causal contributions of these two pathologies, the prevail-     neurodegeneration (N), thus comprising the amyloid-tau-
ing view of Alzheimer’s disease pathogenesis later shifted      neurodegeneration or ‘AT(N)’ framework (Jack et al.,
to an Ab-centric perspective that considered Ab to be the       2016, 2018a,b). Although this framework purports ag-
primary harbinger of the disease state, referred to as the      nosticism with regard to the temporal emergence of ab-
amyloid cascade model (Glenner and Wong, 1984;                  normal biomarkers, it retains an Ab-centric perspective
Hardy, 2017). The deterministic gene mutations for AD           by necessitating that abnormal Ab must be present to
result in increased accumulation of the Ab protein              constitute ‘Alzheimer’s pathologic change’ (Aþ/T), fol-
(Blacker and Tanzi, 1998) and are generally regarded as         lowed by a subsequent pathological change in tau that
confirmatory of the primacy of beta-amyloidosis in AD           transitions the diagnosis to ‘Alzheimer’s disease’ (Aþ/
pathogenesis, although a study by Oxtoby et al. (2018)          Tþ). In contrast, tau in the absence of Ab (A/Tþ), ei-
in early-onset familial AD gene mutation carriers demon-        ther with or without neurodegeneration, is labelled as
strated identical cortical PiB Ab and CSF p-tau abnormal-       ‘non-Alzheimer’s pathologic change’ within this frame-
ity rates. Furthermore, the recent failures of large-scale      work. Such nomenclature suggests that individuals in this
clinical trials targeting Ab have called into question the      category are not on the Alzheimer’s continuum but rather
verity of the amyloid cascade model (Egan et al., 2018;         on an alternative pathological trajectory (Burnham et al.,
Honig et al., 2018; Selkoe, 2019). Consequently, the role       2016; Gordon et al., 2016; Mormino et al., 2016).
of Ab as the primary driving force in the pathogenesis of       Controversy remains over the designation of tau in the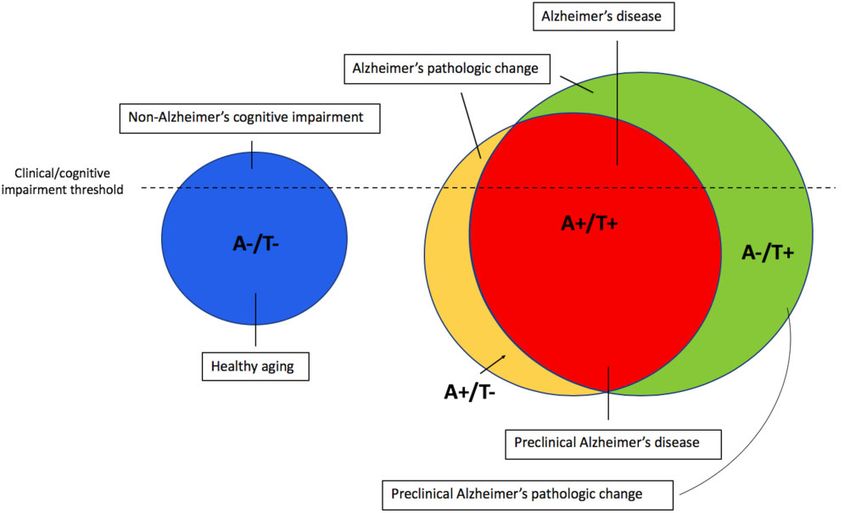
Discordant amyloid and tau positivity                                    BRAIN COMMUNICATIONS 2020: Page 3 of 18    | 3

absence of Ab as a non-Alzheimer’s disease process, how-     350 participants also had available florbetapir data
ever, as some studies indicate that this group (A/Tþ) is    acquired within 12 months of the flortaucipir data to cre-
indistinguishable from Ab-positive groups on a host of       ate Ab SUVR positivity thresholds. Subsequently, a subset
purportedly ‘non-Alzheimer’s disease’ clinical and bio-      of 301 individuals without dementia (i.e. CN and MCI)
logical factors (Knopman et al., 2013).                      who had data from both PET measures acquired within
   Analogous to the AT(N) framework’s ‘non-Alzheimer’s       12 months of one another were included in analyses
disease pathologic change’ is the concept of primary age-    investigating the concurrence of Ab and tau positivity
related tauopathy (PART), which postulates that medial       (i.e. A/T grouping) and subsequent group comparisons in
temporal lobe (MTL) tau in the absence of Ab reflects a      clinical and cognitive characteristics.
feature of aging separate from the Alzheimer’s continuum
that is ‘observed in cognitively normal individuals’, with   Amyloid positron emission
‘severe PART’ associated with amnestic changes only
                                                             tomography processing

                                                                                                                           Downloaded from https://academic.oup.com/braincomms/article/2/1/fcz046/5682400 by guest on 28 October 2020
(Crary et al., 2014). Similar controversy exists as to
whether PART should be considered a distinct patho-          Processing methods for ADNI florbetapir (18F-AV-45)
logical entity (Crary, 2016; Bell et al., 2019) or whether   data have been previously described (Landau et al., 2013;
it is better represented as an early Alzheimer’s process     Landau and Jagust, 2015). Briefly, all PET images were
given its phenomenological similarity to AD (Braak and       smoothed to the resolution of the lowest resolution scan-
Del Tredici, 2014; Duyckaerts et al., 2015) and evidence     ners (8-mm full-width half-maximum; see http://adni.loni.
of cognitive decline despite the absence of Ab-positivity    usc.edu/methods/pet-analysis-method/pet-analysis/ for a
(Jefferson-George et al., 2017; Josephs et al., 2017).       detailed description of PET preprocessing methods).
Although PART has typically been studied using post-         Preprocessed PET images were co-registered with the indi-
mortem histopathology, recent advances in positron emis-     vidual’s native-space structural magnetic resonance imag-
sion tomography (PET) imaging for tau (Jagust, 2018)         ing that was collected within the closest proximity to the
now allow for in vivo investigation of MTL tau in the        PET scan (typically 3 months or less) to obtain
absence of Ab that can clarify the characteristics of        Freesurfer-defined regional standardized uptake variable
PART and its separability from—or inclusion on—the           values. A cortical summary measure was derived by cal-
Alzheimer’s continuum.                                       culating a volume-weighted average across frontal, cingu-
   Accordingly, we examined the proportion of older          late, lateral parietal and lateral temporal regions. All
adults without dementia [i.e. cognitively normal (CN)        SUVs were intensity normalized by dividing each value
and mild cognitive impairment (MCI)] who had MTL tau         by the whole cerebellum to derive SUVRs, as recom-
in the absence of Ab (A/Tþ) relative to individuals with    mended in ADNI’s florbetapir processing methods
Ab in the absence of tau (Aþ/T), with the expectation       (Landau and Jagust, 2015). Although a positivity thresh-
that there will be a higher prevalence of A/Tþ individu-    old of 1.11 is recommended for the intensity normalized
als based on the neuropathological staging studies of        cortical summary measure (Joshi et al., 2012; Landau
                                                             and Jagust, 2015), we derived a new threshold using the
Braak and Del Tredici (2014, 2015). Furthermore, given
                                                             procedures described below to maintain methodological
prior suggestions by Crary et al. (2014) that A/Tþ rep-
                                                             consistency with the derivation of a tau positivity thresh-
resents a common feature of aging in primarily CN indi-
                                                             old (see also below). Notably, florbetapir data were
viduals (i.e. PART), we explored this notion by
                                                             selected based on the acquisition date closest in time to
comparing the biomarker groupings on neuropsychologic-
                                                             the baseline flortaucipir scan acquisition date within a
al function. In concert with findings from Braak and col-
                                                             12-month period. On average, acquisition of the florbeta-
leagues, our results may have implications for the
                                                             pir scan followed the flortaucipir scan by 0.54 months
amyloid cascade hypothesis and AT(N) framework by
                                                             with an SD of 1.69 months in either direction.
indicating the need for the recognition of MTL tauopathy
as a primary substrate of the Alzheimer’s continuum or,
at the very least, agnosticism regarding the temporal se-    Tau positron emission tomography
quence of pathological events in AD.                         processing
                                                             Processing methods for ADNI flortaucipir (18F-AV-1451)
                                                             data have been previously described (Landau and Jagust,
Materials and methods                                        2016; Maass et al., 2017). As above, preprocessed PET
                                                             images were smoothed to 8-mm full-width half-maximum
Participants                                                 and co-registered with the structural magnetic resonance
Initially, data were assessed from 523 participants of the   imaging to obtain Freesurfer-defined regional standardized
Alzheimer’s Disease Neuroimaging Initiative (ADNI) who       uptake variable values. Flortaucipir data were partial vol-
had flortaucipir data available to create tau standardized   ume-corrected using the Geometric Transfer Matrix ap-
uptake variable ratio (SUVR) positivity thresholds. Of       proach (Baker et al., 2017). Regional partial volume-
these 523 participants with available flortaucipir data,     corrected SUVR values were combined to approximate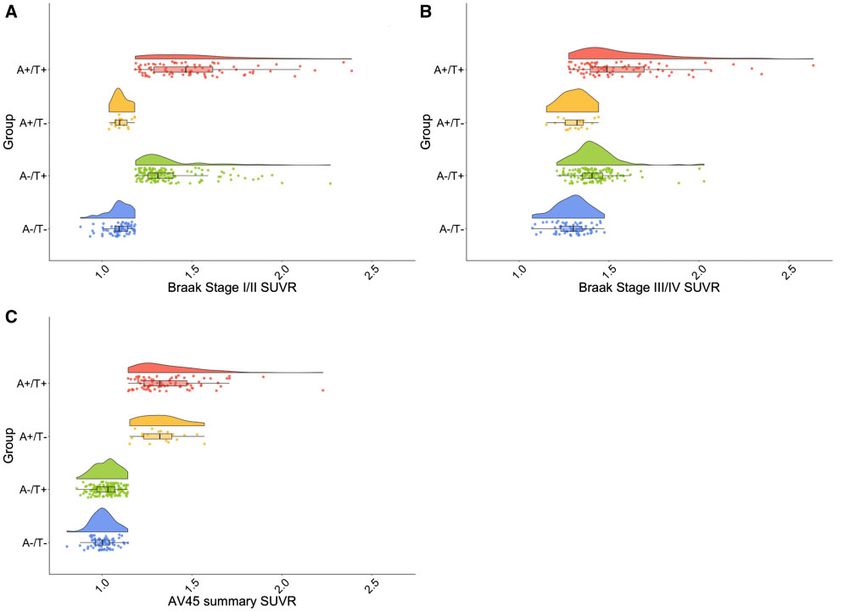
4   | BRAIN COMMUNICATIONS 2020: Page 4 of 18                                                              A. J. Weigand et al.

Braak stages I/II, III/IV and V/VI; specific Freesurfer-        Memory Scale—Revised; (iii) score between 20 and 26
defined regions included within each Braak stage can be         on the Mini–Mental State Examination; (iv) score 0.5 or
found in Maass et al. (2017). Lastly, partial volume-cor-       1.0 on the Clinical Dementia Rating Scale; and (v) met
rected Braak stage composite ROIs were intensity normal-        NINCDS/ADRDA criteria (McKhann et al., 1984) for
ized using the inferior cerebellar grey matter as a             probable Alzheimer’s disease.
reference region to create SUVRs, as recommended in                Clinical diagnosis of MCI was determined using com-
ADNI’s flortaucipir processing methods (Landau and              prehensive neuropsychological criteria (Jak et al., 2009;
Jagust, 2016).                                                  Bondi et al., 2014). Regression-based z-scores adjusting
                                                                for age, sex and education were derived for all partici-
Amyloid and tau positivity                                      pants for the following measures: Trail Making Test
thresholding                                                    Parts A and B (attention/executive domain); confronta-
                                                                tion naming (i.e. Boston Naming Test or Multilingual

                                                                                                                                  Downloaded from https://academic.oup.com/braincomms/article/2/1/fcz046/5682400 by guest on 28 October 2020
Thresholds for the determination of Ab and tau positivity
                                                                Naming Test) and Animal Fluency (language domain);
were derived with conditional inference classification trees
                                                                and Rey Auditory Verbal Learning Recall and
using the ctree() function from the party package in R
                                                                Recognition (memory domain). Participants’ observed
version 3.5.0 (https://cran.r-project.org/), similar to meth-
                                                                scores were compared with the predicted scores for a
ods used in previous ADNI studies of tau PET (Schöll
                                                                group of ‘robust’ CN participants (i.e. maintained CN
et al., 2016; Maass et al., 2017). Mini–Mental State
                                                                status throughout the duration of their participation in
Examination total score was used to drive the classifica-
                                                                ADNI) and standardized to create z-scores. A diagnosis
tion algorithm separately for both Ab and tau data to
obtain thresholds that (i) are consistent between both Ab       of MCI was made for any participant with z-scores >1
and tau PET data (i.e. to avoid an Ab threshold defined         SD below the mean for either (i) both tests within a do-
on pathologically confirmed diagnoses versus a tau              main or (ii) at least one test across all three domains.
threshold that is not validated in this way) and (ii) use a     All other participants with scores above these cut-points
global cognitive measure independent from neuropsycho-          were considered CN.
logical outcome variables used in later group compari-
sons. Analyses for each Braak composite stage were              Clinical and cognitive variables
conducted in a hierarchical manner: first, thresholds were
determined for Braak V/VI; individuals positive for Braak       Demographic variables including age, sex and education
V/VI were then removed from subsequent analyses prior           were measured for all participants and adjusted for
to the determination of Braak III/IV thresholds; and final-     within the cognitive z-scores. Apolipoprotein E (APOE)
ly, following the removal of individuals positive for           e4 positivity was determined by the presence of at least
Braak III/IV, thresholds for Braak I/II were determined.        one APOE e4 allele. Cardiovascular risk was assessed
Analyses were conducted in a single algorithm for Ab            using pulse pressure and calculated as systolic minus
using the cortical summary measure, given the more spa-         diastolic blood pressure, to ascertain the possible contri-
tially diffuse emergence of Ab deposits relative to the         bution of vascular pathology to group differences in
consistent hierarchical spatiotemporal progression of tau       cognition given that pulse pressure has been associated
pathology. Thresholds were taken at the lowest bifurca-         with post-mortem cerebrovascular disease (Nation et al.,
tion in the tree, unless otherwise noted; if two bifurca-       2012). For a subset of individuals (n ¼ 76) with
tions were made at the same level, the threshold was            Hachinski ischemic scale scores, an aggregate measure of
instead taken from the level above. Importantly, unlike         vascular risk, group differences in this measure are also
prior studies that have thresholded tau conditionally on        reported to further rule out vascular contributions to
Ab (Wang et al., 2016; Mishra et al., 2017; Jack et al.,        cognitive differences.
2019), thresholds for Ab and tau positivity were derived          Neuropsychological composite scores were created by
independently of the other to avoid bias in the prevalence      calculating z-scores for individual measures, as described
estimates of A/T groups.                                        in the previous section, and averaging within the follow-
                                                                ing domains: memory recall (Logical Memory Immediate
Diagnostic classification                                       Recall, Logical Memory Delayed Recall and Rey
Individuals with dementia were included only during der-        Auditory Verbal Learning Delayed Recall), attention/ex-
ivation of the SUVR thresholds. Clinical diagnosis of de-       ecutive function (Trail Making Test Parts A and B) and
mentia was made based on the following criteria utilized        language [confrontation naming (Boston Naming Test or
by ADNI (http://adni.loni.usc.edu/): (i) subjective memory      Multilingual Naming Test) and animal fluency]. For the
complaint reported by the participant, study partner or         creation of domain composites, all observations indicating
clinician; (ii) objective memory impairment defined by a        discontinuation of the test due to failure were retained as
score below education-adjusted cut-offs on Logical              meaningful values [i.e. maximum raw score of 300 s on
Memory Delayed Recall, Story A of the Wechsler                  Trails B (n ¼ 7) or 0 on confrontation naming (n ¼ 7)].
Discordant amyloid and tau positivity BRAIN COMMUNICATIONS 2020: Page 5 of 18 | 5
Statistical analyses The primary goal of ADNI has been to test whether ser-
Individuals were first assigned to one of the four A/T ial magnetic resonance imaging, PET, other biological
groups based on Ab and tau PET positivity (i.e. A/T, markers and clinical and neuropsychological assessment
A/Tþ, Aþ/T or Aþ/Tþ). Group comparisons on can be combined to measure the progression of MCI and
demographic, clinical, and PET SUVR data were con- early Alzheimer’s disease. This research was approved by
the Institutional Review Boards of all participating sites,
ducted using chi-square tests for independence for categor-
and written informed consent was obtained for all study
ical variables and one-way ANOVAs for continuous
participants.
variables. Analyses assessing group differences in neuro-
psychological composite scores were conducted using
ANCOVAs adjusting for APOE e4 positivity with four
observations (one per group) deleted due to missing APOE Results
Downloaded from https://academic.oup.com/braincomms/article/2/1/fcz046/5682400 by guest on 28 October 2020
e4 data. To assess the effect of using a newly derived Ab
PET threshold, we additionally ran these analyses using
Amyloid and tau positivity
the conventional 1.11 threshold for Ab. Residuals for all Thresholds were determined using a sample of 523 indi-
three domain composite scores indicated a moderate-to- viduals (355 CN, 122 MCI, and 46 with dementia) with
strong negative skew; therefore, prior to data analysis, tau PET data and 350 individuals (219 CN, 95 MCI and
these variables were shifted to a positive scale [1 þ x 36 with dementia) who additionally had Ab PET data.
min(x)] and normalized using Box-Cox transformation [(xk Supplementary Figs. 1 and 2 depict decision tree outputs
1)/k where k ¼ 1.7 for memory, 4.2 for executive, and from the conditional inference classification algorithm
3.4 for language]. Reported statistics of interest includes F- with Mini–Mental State Examination score as the re-
ratios and partial eta-squares (gp2s) for omnibus tests and sponse variable. A positivity threshold of >1.14 was
t-ratios and Cohen’s d statistics for all pairwise contrasts. derived for the intensity normalized Ab summary SUVR
P-values were also reported for all statistical tests with (P < 0.001), resulting in 140 individuals [40% overall;
Tukey adjustment for pairwise contrasts within each do- 59 CN (26.9%), 47 MCI (49.5%), 34 Alzheimer’s dis-
main. Effect sizes were interpreted as per convention: gp2 ease (94.4%)] classified as Aþ. Although there was a
¼ 0.01 (small effect), gp2 ¼ 0.09 (medium effect), gp2 ¼ lower-level bifurcation in the tree at a value of 0.95 (P ¼
0.25 (large effect); Cohen’s d ¼ 0.2 (small effect), Cohen’s 0.03), the first bifurcation value of 1.14 was chosen to
d ¼ 0.5 (medium effect), Cohen’s d ¼ 0.8 (large effect). maintain consistency with prior conventional positivity
All 95% confidence intervals were included with effect size thresholds (i.e. 1.11; Joshi et al., 2012; Landau and
statistics. Although the reported statistics reflect the differ- Jagust, 2015) and because selection of the lower thresh-
ence between estimated marginal means of Box-Cox trans- old would have resulted in 90% of individuals without
formed values, untransformed and unadjusted z-score dementia categorized as Aþ, which does not comport
means for each group are presented in tables and figures with prior PET studies (10–30% in CN using k-means
to facilitate interpretation. Finally, within-group assessment cluster methods in Cohen et al., 2013; 29% in CN and
of associations between transformed neuropsychological 43% in early MCI in Landau et al., 2012; 25% in CN
domain scores and continuous cortical Ab and Braak I/II and abnormal in Lewczuk et al., 2017) nor with neuro-
SUVR levels were conducted using Pearson partial correla- pathological studies (e.g. Arriagada et al., 1992; Braak
tions controlling for APOE e4 positivity, with partial rs and Del Tredici, 2015).
and unadjusted P-values as the reported statistics. Effect Braak stage thresholding began with the intensity nor-
sizes were again interpreted as per convention: r ¼ 0.1 malized Braak V/VI SUVR, for which a positivity thresh-
(small effect), r ¼ 0.3 (moderate effect), r ¼ 0.5 (large ef- old of >1.96 was derived (P < 0.001); 22 individuals [3
fect). Scatterplots include Box-Cox transformed and resi- CN (0.8%), 7 MCI (5.7%), 12 with dementia (26.0%)]
dualized values to depict tau PET and cognitive were classified as Braak V/VIþ and were removed from
associations as modelled. Hypothesis tests were two-sided subsequent Braak staging classifications (Schöll et al.,
and considered statistically significant at a ¼ 0.05 unless 2016). For the remaining 501 Braak V/VI individuals, a
otherwise noted. All analyses and figures were generated positivity threshold of >1.51 was derived for the intensity
in R version 3.5.0 (R Core Team, 2017), including the fol- normalized Braak III/IV SUVR (P < 0.001); 101 individ-
lowing extension packages: MASS, dplyr, car, emmeans, uals [37 CN (10.5%), 42 MCI (41.7%), 22 with demen-
sjstats, compute.es, psych, and ggplot2. Raincloud plots tia (64.7%)] were classified as Braak III/IVþ and were
were generated from code supplied in Allen et al. (2019). removed from the final Braak staging classification.
Finally, for the remaining 400 Braak III/IV individuals,
a positivity threshold of >1.18 was derived for the inten-
Data availability sity normalized Braak I/IIþ SUVR (P ¼ 0.02); 278 indi-
Data used in the preparation of this article were obtained viduals [210 CN (66.7%), 56 MCI (76.7%), 12 with
from the ADNI database (adni.loni.usc.edu). The ADNI dementia (100%)] were classified as Braak I/IIþ and the
was launched in 2003 as a public–private partnership. remaining 122 individuals [105 CN (33.3%), 17 MCI6 | BRAIN COMMUNICATIONS 2020: Page 6 of 18 A. J. Weigand et al.
(23.3%)] were classified as Braak I/II. Braak III/IVþ positivity. Furthermore, some individuals in the A/Tþ
and Braak V/VIþ individuals iteratively removed during group exhibited notable flortaucipir binding in Braak III/
the classification process were also assigned positivity for IV regions typically considered free from tau pathology
lower Braak stages. Any individual classified as Braak I/ in the absence of significant cortical Ab (see Fig. 1B;
IIþ was considered Tþ. Notably, there were no individu- mean SUVR ¼ 1.42; 18 individuals Braak III/IVþ).
als classified as Braak III/IVþ who were not also Braak
I/IIþ. Demographic and clinical
comparisons
A/T group classification
Stratification of demographic and clinical characteristics
Three hundred one individuals without dementia (212 by A/T group can be found in Table 2. Groups statistic-
CN, 89 MCI) who had florbetapir and flortaucipir PET ally differed in age (F ¼ 13.6, gp2 ¼ 0.12, P < 0.001)
Downloaded from https://academic.oup.com/braincomms/article/2/1/fcz046/5682400 by guest on 28 October 2020
data obtained within 12 months of one another were such that the A/T group was younger than all other
assigned to one of the four groups to investigate the con- groups. The Aþ/Tþ group had the largest proportion of
currence of Ab and tau positivity: A/T, A/Tþ, Aþ/ individuals with MCI (48.1%), whereas all other groups
T or Aþ/Tþ. Table 1 depicts a cross-tabulation of Ab consisted of 20–24% individuals with MCI (v2 ¼ 18.50,
and tau positivity. The largest group of individuals [135 gp2 ¼ 0.10, P < 0.001). Groups also differed in genetic
total (45%); 103 CN, 32 MCI] had evidence of promin- risk (v2 ¼ 29.60, gp2 ¼ 0.15, P < 0.001), with a higher
ent tau in the absence of Ab (A/Tþ). In contrast, only
proportion of APOE e4 carriers in the Aþ/Tþ groups
18 individuals (6%; 14 CN, 4 MCI) had evidence of
relative to the A/T and A/Tþ groups. The Aþ/T
prominent Ab in the absence of tau (Aþ/T); 81 individ-
group did not statistically differ from any other groups,
uals (27%; 42 CN, 39 MCI) were positive for both Ab
although it is notable that there were no e4/e4 homozy-
and tau (Aþ/Tþ); and 67 individuals (22%; 53 CN, 14
gotes in this group. There was no difference in vascular
MCI) were negative for both pathologies (A/T).
risk between groups as indexed by pulse pressure, al-
Notably, when the conventional 1.11 threshold for Ab
though the Aþ/T group had a numerically lower pulse
was used to categorize groups, group proportions largely
pressure by an average of 8 mmHg. Furthermore, for a
remained the same with the A/T group at 21%, A/
subset of individuals with Hachinski ischemic scale
Tþ at 40%, Aþ/T at 7% and Aþ/Tþ at 32% (see
scores, there were no group differences in this measure of
Supplementary Table 1). For completeness, classification
vascular risk.
of the 36 excluded individuals with dementia with the
original 1.14 threshold for Ab resulted in the following:
1 individual was A/T, 1 individual was A/Tþ, 1 in- Cognitive comparisons
dividual was Aþ/T, and 33 individuals were Aþ/Tþ. Memory recall
ANCOVAs assessing differences in memory domain
Florbetapir/flortaucipir PET scores between A/T groups yielded a statistically signifi-
summary statistics cant omnibus effect of moderate size (F ¼ 5.55, gp2 ¼
0.06, P ¼ 0.001; see Table 3 and Fig. 2; see also
The means and standard deviations for cortical Ab, Supplementary Table 3 for all pairwise contrasts includ-
Braak I/II and Braak III/IV SUVR levels across the four ing Tukey-adjusted P-values). Follow-up pairwise con-
A/T groups are reported in Supplementary Table 2, and trasts revealed large effects for differences between the
distributions of these variables are displayed Fig. 1. One Aþ/Tþ group and the A/T (Cohen’s d ¼ 0.84, 95%
individual in the A/Tþ group had an SUVR value of CI ¼ [0.33, 1.33]) and Aþ/T (Cohen’s d ¼ 1.32, 95%
3.46 for Braak I/II that was suppressed in Fig. 1 to im- CI ¼ [0.28, 2.34]) groups, with lower scores observed
prove visualization of the rest of the data; given that this for the Aþ/Tþ group. There was also a moderate effect
value is physiologically plausible and the Braak III/IV for the difference between Aþ/Tþ and A/Tþ groups
value for this individual was well within the range of the (Cohen’s d ¼ 0.55, 95% CI ¼ [0.20, 0.89]) with lower
sample (1.89), this individual was not excluded from any scores again observed for the Aþ/Tþ group. Lastly, there
analyses. Notably, as indicated by Fig. 1C, individuals in was a small effect for the difference between A/T and
the A/Tþ group had a range of Ab SUVR values and A/Tþ groups (Cohen’s d ¼ 0.18, 95% CI ¼ [0.30,
were not clustered just below the threshold for Ab 0.66]), with lower scores observed for the A/Tþ group.
Results remained largely the same when group compari-
Table 1 Cross-tabulation of amyloid and tau positivity sons were made using the 1.11 threshold.
resulting in four group classifications
Attention/executive function
T2 T1
ANCOVAs assessing differences in executive domain
A 67 (22%) (53 CN, 14 MCI) 135 (45%) (103 CN, 32 MCI) scores between A/T groups yielded a statistically signifi-
Aþ 18 (6%) (14 CN, 4 MCI) 81 (27%) (42 CN, 39 MCI)
cant omnibus effect of moderate size (F ¼ 4.15, gp2 ¼Discordant amyloid and tau positivity BRAIN COMMUNICATIONS 2020: Page 7 of 18 | 7
Downloaded from https://academic.oup.com/braincomms/article/2/1/fcz046/5682400 by guest on 28 October 2020
Figure 1 PET SUVR distributions by A/T group. Raincloud plots depicting distributions of SUVR values for AV1451 Braak stage I/II (A),
AV1451 Braak stage III/IV (B) and AV45 cortical summary index (C) across all A/T groups. A/T is denoted in blue, A/Tþ is denoted in
green, Aþ/T is denoted in orange and Aþ/Tþ is denoted in red. One individual had an SUVR value of 3.46 for Braak I/II that was suppressed in
all panels to improve the visualization of the rest of the data.
Table 2 A/T group differences in demographic and clinical characteristics
Group, mean (SD) Group differences
A2/T2 A2/T1 A1/T2 A1/T1 F or v2 g2 P-value
n (%) 67 (22.2) 135 (44.9) 18 (6.0) 81 (26.9)
Age 71.13 (6.28) 76.50 (7.21) 75.39 (4.85) 78.06 (7.17) 13.60 0.128 | BRAIN COMMUNICATIONS 2020: Page 8 of 18 A. J. Weigand et al.
Table 3 A/T group differences in neuropsychological domain performance
Group, mean (SD) Group differences
A2/T2, n 5 67 A2/T1, n 5 135 A1/T2, n 5 18 A1/T1, n 5 81 F-ratio gp2 P-value
Memory 0.24 (0.85) 0.35 (0.99) 0.07 (0.73) 0.96 (1.30) 5.55 0.06 0.001
Executive 0.005 (0.64) 0.21 (0.94) 0.05 (0.77) 0.78 (1.69) 4.15 0.05 0.007
Language 0.14 (0.86) 0.48 (1.62) 0.07 (0.67) 0.59 (1.25) 2.51 0.03 0.06
Note: Reported values reflect untransformed and unadjusted z-score means to facilitate the interpretation of group differences; these values were not used in models from which
statistics were derived.
Downloaded from https://academic.oup.com/braincomms/article/2/1/fcz046/5682400 by guest on 28 October 2020
Figure 2 Cognitive z-score distributions by A/T group. Dot-boxplots depicting cognitive domain scores for memory (A), executive
function (B) and language (C) composites across all A/T groups. A/T is denoted in blue, A/Tþ is denoted in green, Aþ/T is denoted in
orange and Aþ/Tþ is denoted in red. Values reflect untransformed and unadjusted z-scores.
A/T and A/Tþ groups (Cohen’s d ¼ 0.28, 95% CI pairwise contrasts including Tukey-adjusted P-values).
¼ [0.20, 0.76]), with lower scores observed for the A/ Follow-up pairwise contrasts revealed a large effect for
Tþ group. Results remained largely the same when group the difference between Aþ/Tþ and Aþ/T groups
comparisons were made using the 1.11 threshold. (Cohen’s d ¼ 1.05, 95% CI ¼ [0.04, 2.03]), with lower
scores observed for the Aþ/Tþ group. There was also a
Language moderate effect for the difference between Aþ/Tþ and
ANCOVAs assessing differences in language domain A/T groups (Cohen’s d ¼ 0.52, 95% CI ¼ [0.03,
scores between A/T groups yielded an omnibus effect of 1.01]) with lower scores again observed for the Aþ/Tþ
small size (F ¼ 2.51, gp2 ¼ 0.03, P ¼ 0.06; see Table 3 group. No notable difference was observed between Aþ/
and Fig. 2; see also Supplementary Table 5 for all Tþ and A/Tþ groups. However, there were small-to-Discordant amyloid and tau positivity BRAIN COMMUNICATIONS 2020: Page 9 of 18 | 9
moderate effects for the difference between the A/Tþ proportion of our sample (45%) had MTL tau accumula-
group and the A/T (Cohen’s d ¼ 0.29, 95% CI ¼ tion in the absence of Ab (A/Tþ). In contrast, only 6%
[0.19, 0.77]) and Aþ/T (Cohen’s d ¼ 0.27, 95% CI of the sample had evidence of Ab in the absence of tau
¼ [0.07, 0.61]) groups, with lower scores observed for (Aþ/T), despite the use of equivalent methods for deriv-
the A/Tþ group. Results remained largely the same ing positivity thresholds. The A/Tþ group tended to
when group comparisons were made using the 1.11 perform more poorly across memory, executive function,
threshold. and language domains relative to the A/T and Aþ/T
groups, although not as poorly as the Aþ/Tþ group.
Cognition and PET SUVR Only the A/Tþ and Aþ/Tþ groups exhibited associa-
tions between tau SUVR levels and all cognitive domains,
associations with stronger effects observed for the Aþ/Tþ group.
Partial correlations controlling for APOE e4 positivity Importantly, our results provide preliminary evidence to
Downloaded from https://academic.oup.com/braincomms/article/2/1/fcz046/5682400 by guest on 28 October 2020
revealed negative associations between Braak I/II SUVR suggest that tau pathology may emerge independent of
levels and all neuropsychological domain scores for only beta-amyloidosis and that A/Tþ individuals, given their
the A/Tþ (small-to-moderate rs from 0.18 to 0.27) widespread early cognitive compromises, may be best rep-
and Aþ/Tþ (moderate-to-large rs from 0.29 to 0.48) resented on the Alzheimer’s continuum. These findings
groups (see Table 4). Effect sizes were considerably larger are critically important in the conceptualization and treat-
for the Aþ/Tþ group across all domains and most not- ment of AD because they suggest a wider spectrum of
ably within the memory domain. The Aþ/T group individuals as part of the AD prodrome, as well as pro-
exhibited a moderately strong association within the ex- vide further evidence that tau represents a relevant and
ecutive domain (r ¼ 0.30), with an effect as large as promising treatment target for Alzheimer’s disease.
that of the Aþ/Tþ group. Notably, when one observa- Although there has been a recent surge of research uti-
tion from the A/Tþ group was excluded due to an out- lizing tau PET imaging in the context of Alzheimer’s dis-
lier of 3.46 in Braak I/II SUVR (6 SD above sample ease, many studies have focused on tau only in the
mean), all results were retained with similar effects. In presence of Ab, rather than assessing them independently
contrast, there were no associations between cortical Ab (Vemuri et al., 2016; Bejanin et al., 2017; Ossenkoppele
SUVR levels and any neuropsychological domain score, et al., 2019a,b). In addition, positivity for tau PET is
although a moderate effect was again observed for the often determined conditionally based on Ab (Wang et al.,
Aþ/T group within the executive domain (r ¼ 0.37). 2016; Mishra et al., 2017; Jack et al., 2019).
Table 4 displays partial rs with confidence intervals for Importantly, this strategy obviates the possibility of
all correlations and P-values, and Fig. 3 displays scatter- assessing discordance between Ab and tau positivities and
plots for these associations. offers incomplete conclusions about the respective roles
of these pathologies in the Alzheimer’s disease clinical
continuum. It is for this reason that we derived thresh-
Discussion olds for Ab and tau independently of one another and in-
dependent of our clinical and cognitive outcome
Despite the primacy of Ab over tau postulated by the variables, by using Mini–Mental State Examination as a
amyloid cascade model and AT(N) framework for AD global index of cognition to drive the classification algo-
pathological progression, our investigation of discrepan- rithm. This process yielded tau positivity thresholds that
cies in Ab and tau PET positivity revealed that the largest were similar to, albeit more conservative than, those
Table 4 Correlations between cortical amyloid/tau Braak I/II SUVR levels and neuropsychological domain
performance, stratified by A/T group
Partial correlation coefficients with 95% confidence intervals [LB, r, UB]
A2/T2, n 5 67 A2/T1, n 5 135 A1/T2, n 5 18 A1/T1, n 5 81
Tau, memory [0.28, 20.04, 0.20] P ¼ 0.75 [0.42, 20.27, 0.11]* [0.63, 20.21, 0.30] P ¼ 0.41 [0.63, 20.48, 0.29]* P < 0.001
P ¼ 0.001
Tau, executive [0.19, 0.06, 0.29] P ¼ 0.65 [0.34, 20.18, 0.01]* [0.68, 20.30, 0.22] P ¼ 0.25 [0.48, 20.29, 0.07]* P ¼ 0.01
P ¼ 0.04
Tau, language [0.06, 0.18, 0.41] P ¼ 0.14 [0.38, 20.22, 0.05]* [0.55, 20.10, 0.40] P ¼ 0.71 [0.56, 20.38, 0.18]* P < 0.001
P ¼ 0.01
Amyloid, memory [0.15, 0.09, 0.33] P ¼ 0.45 [0.14, 0.03, 0.20] P ¼ 0.76 [0.53, 20.07, 0.42] P ¼ 0.79 [0.18, 0.04, 0.26] P ¼ 0.74
Amyloid, executive [0.35, 20.12, 0.13] P ¼ 0.34 [0.04, 0.13, 0.30] P ¼ 0.12 [0.72, 20.37, 0.13] P ¼ 0.14 [0.32, 20.11, 0.11] P ¼ 0.32
Amyloid, language [0.13, 0.12, 0.35] P ¼ 0.34 [0.11, 0.06, 0.22] P ¼ 0.52 [0.64, 20.23, 0.28] P ¼ 0.37 [0.20, 0.02, 0.24] P ¼ 0.83
LB ¼ 95% CI lower bound; UB ¼ 95% CI upper bound. r values are given in bold.
*Statistically significant association at P < 0.05.10 | BRAIN COMMUNICATIONS 2020: Page 10 of 18 A. J. Weigand et al.
Downloaded from https://academic.oup.com/braincomms/article/2/1/fcz046/5682400 by guest on 28 October 2020
Figure 3 Tau PET and cognition associations for T1 groups. Scatterplots depicting the association between Braak I/II SUVR and
memory (A), executive function (B) and language (C) composites. A/Tþ is denoted in gray and Aþ/Tþ is denoted in purple. Values have been
residualized with respect to APOE e4 positivity and cognitive composites transformed to meet normality assumptions. Figures exclude one
outlier with a residualized Braak I/II SUVR of 2.14 to improve visualization, but effects remained statistically and qualitatively similar.
previously reported using analogous methods in a more of AT(N) categorizations, which found only 11.5% to be
heterogeneous sample (Schöll et al., 2016; Maass et al., classified as A/Tþ/(N or þ) using PET methods (Jack
2017), providing convergent validity for the values et al., 2019). Importantly, this prior study derived a
derived in this study. Notably, although the value we threshold for tau positivity that was contingent on Ab
derived for the Ab positivity threshold (>1.14) was status, with the tau SUVR threshold determined based on
slightly more liberal than the conventional threshold optimal discriminability of young CN A individuals
using pathologically confirmed data (>1.11; Landau and from older cognitively impaired Aþ individuals. Using a
Jagust, 2015), a reanalysis of the data with the conven- model based on discrimination of A and Aþ groups ne-
tional 1.11 threshold revealed that group classifications cessarily yields a threshold value that will maximally
remained largely the same (see Supplementary Table 1) group high tau SUVRs with the Aþ category and low
and cognitive comparisons did not notably differ from tau SUVRs with the A category, thus increasing the
the results reported above. Thus, we believe that the likelihood of producing Aþ/Tþ and A/T groups with
methods used for threshold derivation in this study pro- fewer individuals falling into discrepant groups. We, in
vide valid and reliable biomarker categorizations. contrast, derived Aþ and Tþ threshold independently of
Applying these newly derived positivity thresholds to one another by fitting our model to a global cognitive
examine discrepancies in Ab and tau positivity, we found outcome regardless of PET status for the other biomarker
that the A/Tþ group represented the largest proportion to reduce bias.
of the sample (45%), whereas more than a 7-fold lower Our resultant classifications of 45% A/Tþ and 6%
proportion (6%) were categorized as Aþ/T. Notably, Aþ/T differ from the temporal sequence of pathological
these proportions differ substantially from a recent study events anticipated by the amyloid cascade model andDiscordant amyloid and tau positivity BRAIN COMMUNICATIONS 2020: Page 11 of 18 | 11
AT(N) framework, both of which purport that Ab is the Importantly, our results do not recapitulate the usual
primary pathological substrate of Alzheimer’s disease that demographic and clinical features of the A/Tþ group
emerges some years prior to the tauopathy of Alzheimer’s proposed by proponents of PART (Crary et al., 2014).
disease. However, post-mortem histopathological studies For example, our A/Tþ group did not differ from the
of Alzheimer’s disease have indicated early pathological non-pathological A/T group in terms of APOE e4 al-
tau changes that occur in the brainstem, specifically the lelic frequency. Furthermore, although the A/Tþ group
locus coeruleus, which subsequently propagate to medial was older than the A/T group, they did not differ
temporal regions encompassing Braak stage I/II. These from the other groups (Aþ/T and Aþ/Tþ). Notably,
events largely occur before the evidence of Ab accumula- vascular risk assessed through multiple indices did not
tion (Braak et al., 2011; Braak and Del Tredici, 2015; differ between the groups and therefore any group differ-
Ehrenberg et al., 2017), in accord with the high propor- ences in cognition are likely not attributable to vascular
tion of A/Tþ observed in our study. Furthermore, our differences. The proportion of individuals with MCI did
Downloaded from https://academic.oup.com/braincomms/article/2/1/fcz046/5682400 by guest on 28 October 2020
findings of a high prevalence of Tþ in the context of A not differ among the A/T, A/Tþ and Aþ/T groups
comport with the post-mortem pathological findings of (21-24%), but it was twice as high in the Aþ/Tþ group
Braak and Del Tredici (2015). In their study, 75–80% (48%). Significantly, the A/Tþ group had an MCI rate
of individuals aged 70–80 years had evidence of Braak of 24%, which conflicts with the claim that PART is a
stages I–II tau pathology, whereas only 10–35% over condition observed primarily in CN individuals (Crary
that same age range had evidence of Ab phases 1–3 (note et al., 2014). However, given that this rate did not statis-
that the average age of our study participants was tically differ from the A/T group, we also examined
75.6 years). Moreover, across all ages, 953 (61%) of the differences in neuropsychological domain scores to further
autopsied subjects with Braak stage I/II tau pathology explore the pattern of cognitive performance across
had Ab phase 0 pathology. In a separate study, Braak groups.
From the amyloid cascade and PART perspectives, one
and Del Tredici (2014) further demonstrated that, of the
would predict similar cognitive performances between the
80% of individuals between the ages of 70–80 years with
A/T and A/Tþ groups, particularly in non-amnestic
neuropathological evidence of Braak stages I–II tau path-
domains, followed by a lower-performing Aþ/T group,
ology, only half also had evidence of Ab (including phase
followed by the lowest-performing Aþ/Tþ group. This
1), which again aligns with our findings of 45% A/Tþ
pattern was not observed across any of the three cogni-
prevalence.
tive domains. Instead, the A/T and Aþ/T groups
Prior research has acknowledged this group of A/Tþ
performed most similarly, often with the Aþ/T group
individuals, although historically they have not been
demonstrating the best performances of all groups. In
considered part of the Alzheimer’s developmental con-
contrast, the A/Tþ group exhibited small-to-moderate
tinuum. Instead, individuals with this pathological pres-
decreases in performance relative to the A/T group
entation of MTL tau in the absence of Ab have been
across all domains. The Aþ/Tþ group had the poorest
relegated to alternative categorizations such as PART,
performances in all domains with the exception of lan-
which views medial temporal tauopathy in the absence guage, for which the A/Tþ group performed equally as
of Ab as a feature of aging separate from AD (Crary poorly. Furthermore, examination of partial correlations
et al., 2014; Jellinger et al., 2015). Individuals under the between domain performance and Braak stage I/II SUVR
PART designation have been characterized as older, hav- levels revealed associations only for the A/Tþ and Aþ/
ing lower APOE e4 allelic frequencies, and typically Tþ groups, with stronger effects for the latter. Despite its
more cognitively intact with only localized amnestic confinement to the MTL in Braak stage I/II, tau appears
changes observed in severe cases (Crary et al., 2014). to have widespread effects on cognition across memory,
However, other groups contend that PART itself is a de- executive, and language domains, even in the absence of
velopmental stage (i.e. Braak I/II) of Alzheimer’s disease Ab positivity. The cognitive differences and associations
pathogenesis (Braak and Del Tredici, 2014; Duyckaerts in executive and language domains in the A/Tþ group
et al., 2015; Josephs et al., 2017). Most investigations are particularly noteworthy given that PART purports to
into PART have been conducted using post-mortem impart only amnestic cognitive changes in the most severe
histopathological data, which limits the ability to assess cases. Thus, tau appears to be exerting deleterious effects
cognitive status in close temporal proximity to the on cognition within the MTL and beyond even in A
pathological determinants due to the use of retrospective individuals, possibly through network changes to broader
cognitive data that often varies on the order of years in association cortices associated with language and execu-
its proximity to the time of autopsy. In contrast, our tive functions (Ossenkoppele et al., 2019a,b). Notably,
study was able to investigate these groupings using the reported effect sizes for group differences in cognition
in vivo PET markers of Ab and tau pathology that more are relatively small and the conclusions drawn should be
closely coincided with the administration of a neuro- interpreted cautiously in the absence of further longitu-
psychological battery, allowing for an improved cogni- dinal research. Nevertheless, these preliminary findings
tive characterization of A/Tþ individuals. suggest that MTL tau pathology in the absence of Ab12 | BRAIN COMMUNICATIONS 2020: Page 12 of 18 A. J. Weigand et al.
may not be an anticipated consequence of aging, as the AD. Such a reframing in nosology would also have critical
PART hypothesis implies. implications for drug discovery and clinical trials. As our
Given these findings, we propose that prominent MTL findings suggest, waiting for Ab positivity to become evi-
tau pathology itself is sufficient to be considered part of dent before attempting its clearance, particularly in those
the Alzheimer’s continuum, rather than the distinct entity with MTL tau positivity, would negate the opportunity to
of PART, with subsequent beta-amyloidosis accelerating clear pathological tau before it begins to affect cognition
the disease stage. These data indicate that a revision to broadly across memory, language and executive functions.
the AT(N) nomenclature (Jack et al., 2016, 2018a,b) is Prevailing theory postulates that tau pathology migrates
also warranted such that A/Tþ profiles should fall under from the brainstem to the MTL as part of the aging pro-
the category of ‘Alzheimer’s pathologic change’ rather cess and remains in this region until sufficient Ab path-
than ‘non-Alzheimer’s pathologic change,’ with the term ology has accumulated to drive it out to adjacent
‘Alzheimer’s disease’ reserved for Aþ/Tþ. If an individual neocortical regions (Bennett et al., 2017). Our data
Downloaded from https://academic.oup.com/braincomms/article/2/1/fcz046/5682400 by guest on 28 October 2020
falls into one of these categories in the context of intact showed that within the A/Tþ group, all of whom were
cognition, they would be considered in a preclinical stage Braak stage I/IIþ (i.e. confined to MTL), 18 individuals
(i.e. preclinical Alzheimer’s pathologic change or preclinical (13% of the A/Tþ group) were also Braak stage III/
Alzheimer’s disease; see Fig. 4). Interestingly, a prior study IVþ despite their Ab negativity. These data suggest that,
investigating the prevalence of abnormal biomarkers with- in some cases, tau pathology may extend beyond the
out regard to their temporal ordering noted that neurode- MTL independent of the influence of Ab. Nonetheless, it
generation (possibly due to MTL tau pathology) was more remains unclear whether Ab is needed to further the
likely to be the first abnormal biomarker than Ab spread of tau beyond the MTL and the literature offers
(Edmonds et al., 2015); perhaps the most appropriate conflicting evidence. On the one hand, several studies
staging model for Alzheimer’s pathology would follow this have demonstrated that tau accumulates at a faster rate
‘tally’ system to maintain agnosticism with regard to the in the presence of Ab (Lockhart et al., 2017; Jack et al.,
temporal emergence of these biomarkers, given the contin- 2018b; Leal et al., 2018; Schultz et al., 2018) and our
ued uncertainty over the developmental cascade leading to results indicated a stronger association between tau and
Figure 4 Suggested nomenclature for the Alzheimer’s pathological continuum. Theoretical model of Alzheimer’s nomenclature
based on A/T group and cognitive status, including relative group proportions based on A/T positivity prevalence findings in the current sample.Discordant amyloid and tau positivity BRAIN COMMUNICATIONS 2020: Page 13 of 18 | 13
cognitive performance, as well as generally poorer per- Despite its strengths, we also acknowledge that this study
formance, in the Aþ/Tþ group relative to the A/Tþ is not without its limitations. Importantly, the homogeneity
group. On the other hand, other studies show that tau of the ADNI sample may limit generalizability to more rep-
has the ability to spread beyond the MTL to adjacent resentative community-based samples and further studies
cortical regions in the absence of Ab, both in animal sampling from a diverse population are needed to ensure
models (Kaufman et al., 2018) and human PET studies that these effects persist among individuals of underrepre-
(Lowe et al., 2018). Further post-mortem evidence dem- sented races/ethnicities, socioeconomic strata and comorbid
onstrates the continued progression of tau pathology des- medical or mental health conditions. Furthermore, our
pite the enduring clearance of Ab from anti-Ab therapies study’s cross-sectional analyses limited our ability to directly
administered prior to death, suggesting an Ab-independ- examine within-subject temporal emergence of Ab and tau
ent mechanism of tau propagation (Nicoll et al., 2019). pathologies as well as cognitive change over time across the
Notably, there are several other pathologies in addition A/T groups, and longitudinal investigations of such phe-
Downloaded from https://academic.oup.com/braincomms/article/2/1/fcz046/5682400 by guest on 28 October 2020
to Ab and tau that comprise the Alzheimer’s syndrome, nomena will be an important next step to corroborate the
and the majority of individuals with Alzheimer’s disease preliminary findings presented in this study and further our
have multiple pathologies (Schneider et al., 2009; Boyle understanding of pathological progression along the
et al., 2018). Cerebrovascular pathology has proven to be Alzheimer’s continuum within individuals over time. It is
a prominent and early contributor to Alzheimer’s processes, also noteworthy that the florbetapir PET tracer for Ab has
with neuroimaging markers of small-vessel disease emerging a high affinity for neuritic plaques, but it may not detect
as early as 22 years prior to symptom onset in autosomal- diffuse plaques or soluble oligomers (Beach et al., 2014);
dominant AD (Lee et al., 2016). Data further indicate syn- thus, we cannot rule out that these other forms of Ab path-
ergistic interactions between cerebrovascular pathology and ology are present in A individuals and contribute to
hallmark Alzheimer’s pathologies, such that cerebrovascular neurofibrillary tangle formation (Koss et al., 2016; Abner
dysfunction may accelerate Ab and tau pathological pro- et al., 2018). That said, proponents of PART allow for the
gression, and vice versa (Blair et al., 2015; Nation et al., presence of diffuse plaques in addition to MTL tau (Crary
2015; Rabin et al., 2019). Another important pathological et al., 2014) and, therefore, the detection of these diffuse
feature in older adults is TDP-43, which defines the new plaques would not change the categorization of this group.
conceptualization of limbic-predominant age-related TDP- One may also question the decision to restrict the defin-
43 encephalopathy (i.e. LATE; Nelson et al., 2019) and is ition of tau positivity based on spatial location (i.e. MTL)
often comorbid with Ab and tau pathologies (James et al., while instead using a broader cortical summary measure
2016). As research progresses, a polypathologic staging for Ab positivity. Importantly, the use of a composite
scheme for AD that extends beyond Ab and tau may be across diffuse cortical regions may dilute sensitivity of the
warranted. As previously suggested, a ‘tally’ system for detection of pathology in any single region. However,
these multiple pathologies (which also includes the presence given that Ab pathology presents diffusely and variably
of subtle or mild cognitive declines) may be the best nos- throughout cortex (Braak and Braak, 1995; Lockhart
ology for representing their cumulative contributions to the et al., 2017), a composite region may better capture the
Alzheimer’s dementia syndrome (see Edmonds et al., 2015). presence of this accumulated pathology given that meas-
There are several notable strengths of the current study. urement of a single region may produce false negatives if
First, the measurement of Ab and tau positivity with PET Ab has instead accumulated in other unsampled cortical
imaging allowed for perhaps the first in vivo investigation regions. Conversely, tau pathology emerges in a specific
of PART, with improved temporal proximity between the spatiotemporal sequence across the Alzheimer’s continuum
assessment of cognition and the measurement of pathology (Braak and Braak, 1991), which increases our sensitivity
relative to previous post-mortem studies. The independent for the detection of tau pathology if we select these
derivation of positivity thresholds for Ab and tau is also a regions predicted by neuropathological staging (e.g. MTL
unique feature of our study relative to prior studies and regions for early detection). For this reason, we and other
ensured any potential A/Tþ individuals could accurately representative PET studies (see Maass et al., 2017 ) have
be detected, given that Ab positivity was not considered in determined tau positivity based on SUVR level within the
the determination of T and Tþ groups. Furthermore, the MTL (i.e. Braak stage I/II). Notably, selection of this ap-
use of neuropsychological measures sensitive to early AD proach likely contributed to our relatively high prevalence
provided a multi-domain assessment of cognition, rather of Tþ within this study (Braak et al., 2011), whereas a
than relying on brief cognitive screening or rating meas- composite of Braak stages I–IV would be more conserva-
ures insensitive to the AD prodrome and not validated tive in detecting Tþ. However, given that we observed
outside of clinic settings (see De Roeck et al., 2019 for a subtle cognitive deficits among A/Tþ individuals (with
review). These methodological strengths allowed for an tau largely confined to the MTL), this finding suggests
improved examination of the concept of PART, leading to that the observed highly prevalent MTL tau in the absence
the conclusion that this A/Tþ pathological profile has of amyloid is an important pathological grouping that
deleterious effects on cognition and may be better consid- may be considered part of the Alzheimer’s continuum ra-
ered as a stage of the Alzheimer’s continuum. ther than a feature of normal aging.You can also read