Alana Fazackerley, Client Manager, Communities, Sport and Recreation Tasmania
←
→
Page content transcription
If your browser does not render page correctly, please read the page content below
Alana Fazackerley, Client Manager, Communities, Sport and Recreation Tasmania

Golf – Golf who? – Golfind something useful to do! (maybe audit some trails!)
  Stopwatch – Stopwatch who – Stopwatch you're doing and open this door!
   Canoe – Canoe who?       – Canoe tell me some better knock, knock jokes?
Is the door open, slightly ajar – or closed?
   ERASS gives us what people are doing on a state wide basis
       You built it – but are they coming?
         How can we tell if our resources are being used

   Examples?
Why open the door?
What can you gain from collecting the data?
How do you know?
How many?
Who are they?
Level of usage?
Sustainable?
How to maintain/sustain?
Current and future capacity?
Why open the door?
What can you gain from collecting the data?
Expand, develop, improve?
Why have it?
Money well spent?
Economic value?
Other studies
Regional perspective
Tourism, economic development, planning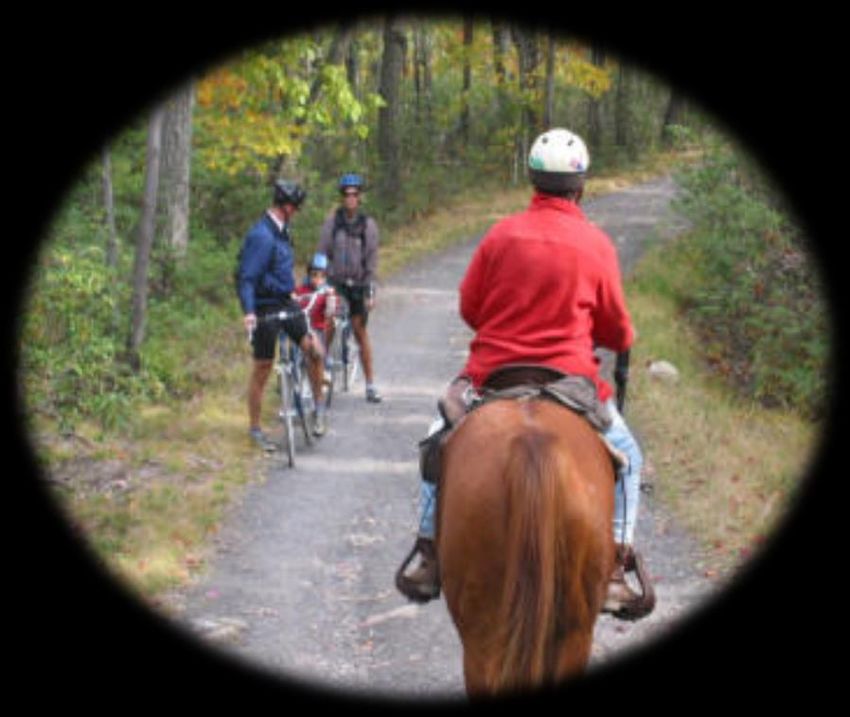
Door handle – or crow bar?
What methods or tools to use?
Type of facility
Counters, sensors or cameras
Analysis and observation
Survey
Catchment analysis
Numbers only? Or wait, there’s more!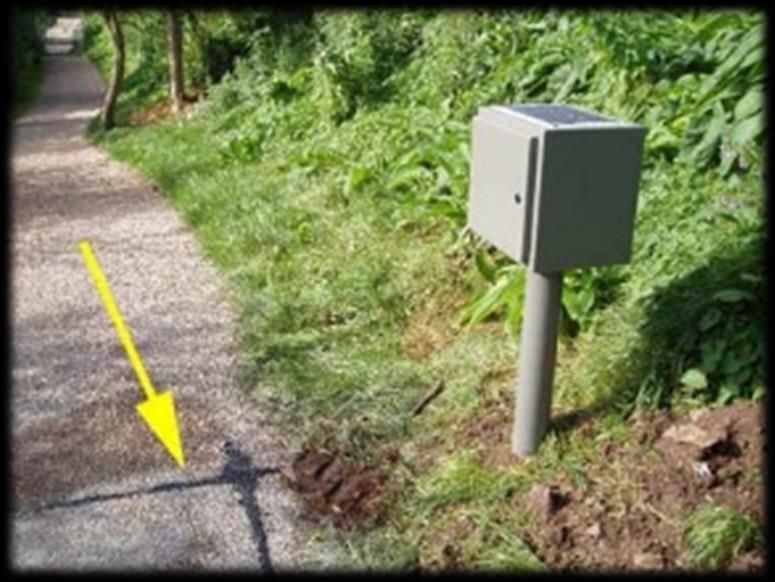
Door handle – or crow bar?
Differentiate between cyclists and walkers
Use of resources
Partnerships
Observation
Validate data
Who’s opened the door (apart from Jack)?
          Case studies and examples?
Trails and their gateway communities US (Complex study)

Where from?                  How many?
Most users of the Gandy Estimates on total annual use of the southern portion
Dancer Trail reside      of the trail are 50 000 individual user visits (28 000
locally or come from the parties) between October 2006 and September 2007
nearby Twin Cities
metropolitan area in        Income
Minnesota                   Trail users represented an average household
Why?                        income of $78 000 which is higher than the average
In general, hikers and      household income in Wisconsin
bikers visited the trail for
exercise, peace and quiet,     How much?
and nature-related reasons     Recreational use pressures were highest in the
                               summer and were dominated by hikers and bikers,
What else?                     while winter use was weather dependent and
Hikers and bikers tended       dominated by snowboarders
to affiliate with and also
take part in other non-        What age groups?
motorised recreational         The average age of trail users encountered in this
activities                     study was 47 years old
Old Beechey Rail Trail – use of trackers
Description                   Method
Otway Ranges – Colac to       Six trackers are placed at most popular parts of the trail,
Beech Forest – Length         incorporated in timber chicanes. Heat sensitive, vandal proof,
45km segmented trail,         inconspicuous – 20 years battery life. Installed in 2010
compacted earth,
undulating terrain, with a    Data is gathered every 2 months prior to a Section 86
couple of steep section and   committee meeting of representatives: delegates from
various access points         neighbouring progress associations, land owners (licenses)
                              Dept. Environment and Primary Industries reps, timber
Beneficial because            harvesters and council
prior to having the
counters there was no     Issues
method of data            At one point, wondered why there had been a spike in count –
collection.               68 000 counts. Because of heat sensitivity – the tracker on the
Comparisons are           end of the trail had picked up cows in the pasture adjacent to the
available during peak     tracker. Another time a spider web across the sensor caused a
visitor periods           dip in numbers.
No breakdown of the       If monitoring at regular intervals, problems can be caught early
types of users            when they arise.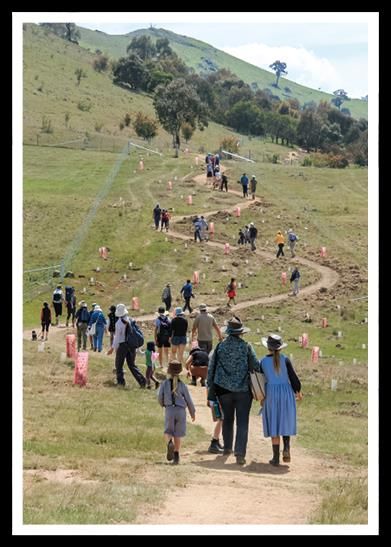
Moreland City Council (Vic)
Capital City Trail counter – recorded 306 712 users since October 2013
The $30 000 counter was placed in partnership with council and a local Velo Cycles store
Data will be used to support funding proposals to state and federal governments for better
cycle infrastructure
Albury City (NSW)
Through survey, measured 85 cyclists travelling between Albury and Wodonga from 7am to
9am on a weekday, an increase on 27 cyclists from last year
Recreational Trail Bikers’ Association (WA)
Track trail and quad bikes, with date and time stamp for each record.
Weather conditions, weekday/weekend split and influence of school holidays
Durability of trails, maintenance and funding
Manningham City Council (Vic)
Walking trail Mallum Mallum Reserve, total numbers – to track use, monitor changes, promote
opportunities
What about in Tassie? Northern Midlands Council – Longford gym via after hours entry swipe cards West Tamar Council – User matrix Dorset Council NE MTB Derby stage due to open 7 February 15 Counters may identify patterns of particular days and times of use Monitor usage and comparisons – economic benefit for businesses and new investment decisions Forest Eco Centre Launceston Aquatic – Catchment analysis
Launceston City Council
Lookout – to invest or not to invest, that is the question!
Visits captured over a 6 month summer period

                    Monkey enclosure – City Park
                    350 081 visits in the past year

                                           The Gorge
                                           January 2014 figures reflect 139 952
                                           through West Launceston gates

                                           Flood levees – cyclists
City Park Conservatory
July 22015 / 629 per day
(reopened after winter maintenance)
August 10332 / 369 per day January 21408 / 669 per day
September 17745 / 507 per day February 14030 / 610 per day
(closed for Festivale for 5 days)
October 16710 / 557 per day
March 14476 / 517 per day
November 13689 / 507 per day April 18150 / 605 per day
December 18840 / 628 per day May 3950 / 395 per day
(closed may 12 for winter maintenance)
June Closed
Total annual visits 171 345Group work
How to open the door
1. Think of a particular venue
What could you do to measure usage?
What resources would you need?
At what cost?
What limitations could there be to the method/strategy?
2. Use an example venue
Think of a scale of strategies – simplest to most complexGroup work
What’s behind the door?
Maximise results
1. Define a question to research?
2. What results would you be looking for?
3. What results might you get?
4. How could you guarantee a valid sample
of responses?
5. What would be a valid sample size?Group work Making the most of the view 1. How could you use the results? 2. What could lead from the results? 3. How could you, and/or your community benefit? 4. What other projects, programs, people or initiatives might benefit from the results – and how?
Useful resources
http://www.dpac.tas.gov.au/divisions/csrt/sportrec/publications/recreation_planning_manual Recreation Planning
Manual – Chapter 8
http://crctourism.com.au/wms/upload/resources/bookshop/Wardell_VisitorUsePA.pdf Collection, storage &
application of visitor use data in protected areas – Guiding principles and case studies – by J. Wardell and Susan
A. Moore – CRC for Sustainable Tourism Pty Ltd (Gold Coast Council)
http://www.fs.fed.us/recreation/programs/nvum/ US Forests: The NVUM program has two concurrent goals.
First, to produce estimates of the volume of recreation visitation to National Forests and Grasslands. Second,
to produce descriptive information about that visitation, including activity participation, demographics, visit
duration, measures of satisfaction, and trip spending connected to the visit.
http://www.islandresearch.com.au/ Island Research Tracker Count pedestrian counters
http://www.theweeklyreviewmelbournetimes.com.au/story/1796305/300-000-plus-users-on-moreland-bike-
trail-in-four-months/ The Weekly Review – Moreland City Council
http://www.victoriawalks.org.au/Assets/Files/FINAL_Guide_to_measuring_walking_WEBv1.0.pdf Measuring
Walking - a Guide for Victorian Councils
http://www.nprsr.qld.gov.au/experiences/horse-trails/pdf/seqhtn-visitor-use.pdf The use of infra-red sensors and
digital cameras for documenting visitor use patterns: a case study from D’Aguilar National Park, south-east
Queensland, Australia
http://www.stategrowth.tas.gov.au/__data/assets/pdf_file/0004/88780/Tasmanian_Walking_and_Cycling_for_Ac
tive_Transport_Strategy.pdf Tasmanian Walking and Cycling for Active Transport StrategyYou can also read