An Evaluation of the Human-Interpretability of Explanation
←
→
Page content transcription
If your browser does not render page correctly, please read the page content below
An Evaluation of the Human-Interpretability of
                                                                   Explanation
                                             Isaac Lage*1 , Emily Chen*1 , Jeffrey He*1 , Menaka Narayanan*1 , Been Kim2 ,
                                                               Sam Gershman1 and Finale Doshi-Velez1
arXiv:1902.00006v1 [cs.LG] 31 Jan 2019

                                                                                  1
                                                                                      Harvard University
                                                                                       2
                                                                                         Google Brain

                                                                                           Abstract
                                                    Recent years have seen a boom in interest in machine learning systems that can provide a
                                                human-understandable rationale for their predictions or decisions. However, exactly what kinds
                                                of explanation are truly human-interpretable remains poorly understood. This work advances
                                                our understanding of what makes explanations interpretable under three specific tasks that
                                                users may perform with machine learning systems: simulation of the response, verification of a
                                                suggested response, and determining whether the correctness of a suggested response changes
                                                under a change to the inputs. Through carefully controlled human-subject experiments, we
                                                identify regularizers that can be used to optimize for the interpretability of machine learning
                                                systems. Our results show that the type of complexity matters: cognitive chunks (newly defined
                                                concepts) affect performance more than variable repetitions, and these trends are consistent
                                                across tasks and domains. This suggests that there may exist some common design principles
                                                for explanation systems.

                                         1     Introduction
                                         Interpretable machine learning systems provide not only decisions or predictions but also expla-
                                         nation for their outputs. Explanations can help increase trust and safety by identifying when the
                                         recommendation is reasonable and when it is not. While interpretability has a long history in AI
                                         [Michie, 1988], the relatively recent widespread adoption of machine learning systems in real,
                                         complex environments has lead to an increased attention to interpretable machine learning systems,
                                         with applications including understanding notifications on mobile devices [Mehrotra et al., 2017,
                                         Wang et al., 2016], calculating stroke risk [Letham et al., 2015], and designing materials [Raccuglia
                                         et al., 2016]. Techniques for ascertaining the provenance of a prediction are also popular within the
                                         machine learning community as ways for us to simply understand our increasingly complex models
                                         [Lei et al., 2016, Selvaraju et al., 2016, Adler et al., 2016].
                                             The increased interest in interpretability has resulted in many forms of explanation being
                                         proposed, ranging from classical approaches such as decision trees [Breiman et al., 1984] to input

                                                                                              1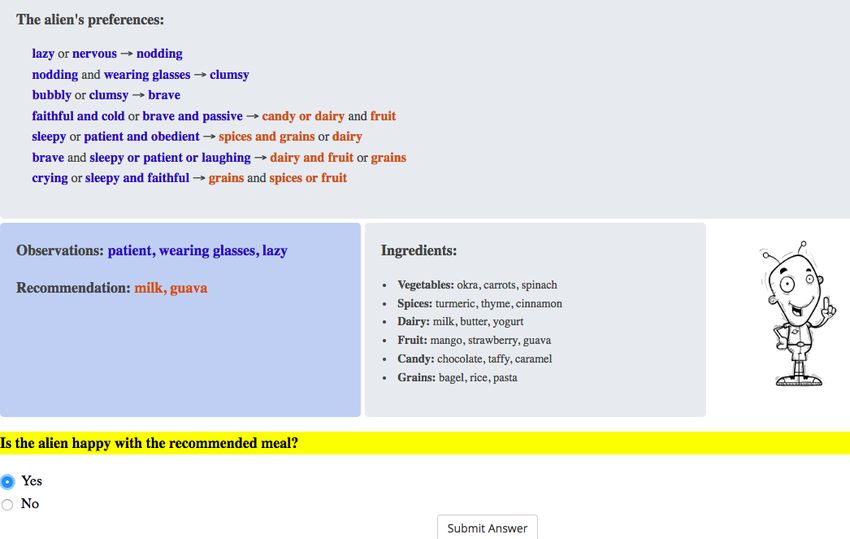
gradients or other forms of (possibly smoothed) sensitivity analysis [Selvaraju et al., 2016, Ribeiro
et al., 2016, Lei et al., 2016], generalized additive models [Caruana et al., 2015], procedures [Singh
et al., 2016], falling rule lists [Wang and Rudin, 2015], exemplars [Kim et al., 2014, Frey and Dueck,
2007] and decision sets [Lakkaraju et al., 2016]—to name a few. In all of these cases, there is a
face-validity to the proposed form of explanation: if the explanation was not human-interpretable,
clearly it would not have passed peer review.
    That said, these works provide little guidance about when different kinds of explanation might
be appropriate, and within a class of explanations—such as decision-trees or decision-sets—what
factors most influence the ability of humans to reason about the explanation. For example, it is
hard to imagine that a human would find a 5000-node decision tree as interpretable as a 5-node
decision tree for any reasonable notion of interpretable, but it is not clear whether it is more urgent
to regularize for fewer nodes of shorter average path lengths. In Doshi-Velez and Kim [2017], we
point to a growing need for the interpretable machine learning community to engage with the human
factors and cognitive science of interpretability: we can spend enormous efforts optimizing all
kinds of models and regularizers, but that effort is only worthwhile if those models and regularizers
actually solve the original human-centered task of providing explanation.
    Determining what kinds of regularizers we should be using, and when, require carefully con-
trolled human-subject experiments. In this work, we make modest but concrete strides towards
providing an empirical grounding for what kinds of explanations humans can utilize. Focusing
on decision sets, we determine how three different kinds of explanation complexity—clause and
explanation lengths, number and presentation of cognitive chunks (newly defined concepts), and
variable repetitions—affect the ability of humans to use those explanations across three different
tasks, two different domains, and three different performance metrics. We find that the type of
complexity matters: cognitive chunks affect performance more than variable repetitions, and these
trends are consistent across tasks and domains. This suggests that there may exist some common
design principles for explanation systems.

2    Related Work
Interpretable Machine Learning Interpretable machine learning methods aim to optimize models
for both succinct explanation and predictive performance. Common types of explanation include
regressions with simple, human-simulatable functions [Caruana et al., 2015, Kim et al., 2015a,
Rüping, 2006, Bucilu et al., 2006, Ustun and Rudin, 2016, Doshi-Velez et al., 2015, Kim et al.,
2015b, Krakovna and Doshi-Velez, 2016, Hughes et al., 2016, Jung et al., 2017], various kinds
of logic-based methods [Wang and Rudin, 2015, Lakkaraju et al., 2016, Singh et al., 2016, Liu
and Tsang, 2016, Safavian and Landgrebe, 1991, Wang et al., 2017], techniques for extracting
local explanations from black-box models [Ribeiro et al., 2016, Lei et al., 2016, Adler et al.,
2016, Selvaraju et al., 2016, Smilkov et al., 2017, Shrikumar et al., 2016, Kindermans et al., 2017,
Ross et al., 2017], and visualization [Wattenberg et al., 2016]. There exist a range of technical
approaches to derive each form of explanation, whether it be learning sparse models [Mehmood
et al., 2012, Chandrashekar and Sahin, 2014], monotone functions [Canini et al., 2016], or efficient
logic-based models [Rivest, 1987]. Related to our work, there also exists a history of identifying

                                                  2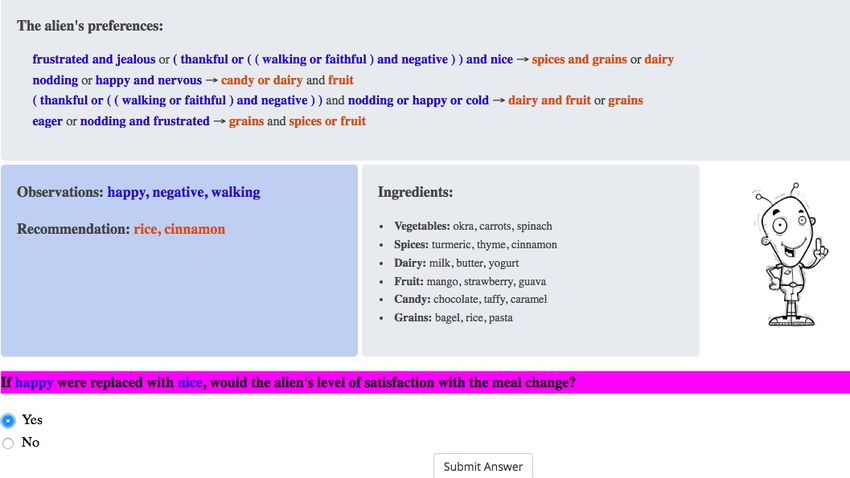
human-relevant concepts from data, including disentangled representations [Chen et al., 2016] and
predicate invention in inductive logic programming [Muggleton et al., 2015]. While the algorithms
are sophisticated, the measures of interpretability are often not—it is common for researchers to
simply appeal to the face-validity of the results that they find (i.e., “this result makes sense to the
human reader”) [Caruana et al., 2015, Lei et al., 2016, Ribeiro et al., 2016].
    Human Factors in Explanation In parallel, the literature on explanation in psychology also
offers several general insights into the design of interpretable AI systems. For example, humans
prefer explanations that are both simple and highly probable [Lombrozo, 2007]. Human expla-
nations typically appeal to causal structure [Lombrozo, 2006] and counterfactuals [Keil, 2006].
Miller [1956] famously argued that humans can hold about seven items simultaneously in working
memory, suggesting that human-interpretable explanations should obey some kind of capacity limit
(importantly, these items can correspond to complex cognitive chunks—for example, ‘CIAFBINSA’
is easier to remember when it is recoded as ‘CIA’, ‘FBI’, ‘NSA.’). Orthogonally, Kahneman [2011]
notes that humans have different modes of thinking, and larger explanations might push humans into
a more careful, rational thinking mode. Machine learning researchers can convert these concepts
into notions such as sparsity or simulatability, but answering questions such as “how sparse?” or
“how long?” requires empirical evaluation in the context of machine learning explanations.
    A/B Testing for Interpretable ML Existing studies evaluting the human-interpretability of
explanation often fall into the A-B test framework, in which a proposed model is being compared to
some competitor, generally on an intrinsic task. For example, Kim et al. [2014] showed that human
subjects’ performance on a classification task was better when using examples as representation than
when using non-example-based representation. Lakkaraju et al. [2016] performed a user study in
which they found subjects are faster and more accurate at describing local decision boundaries based
on decision sets rather than rule lists. Subramanian et al. [1992] found that users prefer decision
trees to tables in games, whereas Huysmans et al. [2011] found users prefer, and are more accurate,
with decision tables rather than other classifiers in a credit scoring domain. Hayete and Bienkowska
[2004] found a preference for non-oblique splits in decision trees (see Freitas [2014] for a more
detailed survey). These works provide quantitative evaluations of the human-interpretability of
explanation, but rarely identify which properties are most essential for which contexts—which is
critical for generalization.
    Domain Specific Human Factors for Interpretable ML Specific application areas have also
evaluated the desired properties of an explanation within the context of the application. For example,
Tintarev and Masthoff [2015] provides a survey in the context of recommendation systems, noting
differences between the kind of explanations that manipulate trust [Cosley et al., 2003] and the
kind that increase the odds of a good decision [Bilgic and Mooney, 2005]. In many cases, these
studies are looking at whether the explanation has an effect on performance on a downstream task,
sometimes also considering a few different kinds of explanation (actions of similar customers, etc.).
Horsky et al. [2012] describe how presenting the right clinical data alongside a decision support
recommendation can help with adoption and trust. Bussone et al. [2015] found that overly detailed
explanations from clinical decision support systems enhance trust but also create over-reliance;
short or absent explanations prevent over-reliance but decrease trust. These studies span a variety of
extrinsic tasks, and again given the specificity of each explanation type, identifying generalizable

                                                  3
properties is challenging.
General Human Factors for Interpretable ML Closer to the objectives of this work, Kulesza
et al. [2013] performed a qualitative study in which they varied the soundness (nothing but the
truth) and the completeness (the whole truth) of an explanation in a recommendation system setting.
They found completeness was important for participants to build accurate mental models of the
system. Allahyari and Lavesson [2011], Elomaa [2017] also find that larger models can sometimes
be more interpretable. Schmid et al. [2016] find that human-recognizable intermediate predicates in
inductive knowledge programs can sometimes improve simulation time. Poursabzi-Sangdeh et al.
[2017] manipulate the size and transparency of an explanation and find that longer explanations
and black-box models are harder to simulate accurately (even given many instances) on a real-
world application predicting housing prices. Our work fits into this category of empirical study of
explanation evaluation; we perform controlled studies on a pair of synthetic applications to assess
the effect of a large set of explanation parameters.
3 Methods
Our central research question is to determine which properties of decision sets are most relevant
for human users to be able to use the explanations for a set of synthetic tasks described below.
In order to carefully control various properties of the explanation and the context, we generate
explanations by hand that mimic those learned by machine learning systems. We emphasize that
while our explanations are not machine-generated, our findings provide suggestions to the designers
of interpretable machine learning systems about which parameters are most urgent to optimize when
producing explanations since they affect usability most heavily.
The question of how humans utilize explanation is broad. For this study, we focused on expla-
nations in the form of decision sets (also known as rule sets). Decision sets are a particular form
of procedure consisting of a collection of cases, each mapping some function of the inputs to a
collection of outputs. An example of a decision set is given below
Figure 1: Example of a decision set explanation.
where each line contains a clause in disjunctive normal form (an or-of-ands) of the inputs (blue
words), which, if true, maps to the output (orange words–also in disjunctive normal form).
Decision sets make a reasonable starting point for a study on explanation because there exist
many techniques to optimize them given data [Frank and Witten, 1998, Cohen, 1995, Clark and
Boswell, 1991, Lakkaraju et al., 2016]; they are easy for humans to parse since they can scan for the
rule that applies and choose the accompanying output [Lakkaraju et al., 2016]; and there are many
parameters to tune that may influence how easy it is to parse a specific decision set, including the
number of lines, number of times variables are repeated, and whether terms represent intermediate
concepts. Finally, decision sets can either be trained as the machine learning model for a given
4Setting: Domain Setting: Choice of Task Explanation Variation Metrics
Recipe Verification V1: Explanation Size Response Time
Clinical Simulation V2: Cognitive Chunks Accuracy
Counterfactual V3: Repeated Terms Subjective Satisfaction
Table 1: We conduct experiments in 2 parallel domains–one low-risk (recipe) and one high risk
(clinical). In each domain, we conduct 3 experiments testing different types of explanation variation.
For each of those, we vary 1-2 factors (described in detail in Section 3.3). For each setting of these
factors, we ask people to perform 3 core cognitive tasks and for each of these, we record 3 metrics
measuring task performance.
application, or they can be trained to locally approximate a more complex model like a neural
network using procedures like the one described in Ribeiro et al. [2016].
Of course, within decision sets there are many possible variations, tasks, and metrics. Table 1
summarizes the core aspects of our experiments. We considered three main kinds of explanation
variation—variations in explanation size (number of lines, length of lines), variations in introducing
new cognitive chunks (newly defined concepts), and variations in whether terms repeat. The effect
of these variations were tested across three core cognitive tasks in two domains, for a total of six
settings. We also considered three metrics—accuracy, response time, and subjective satisfaction—as
measures of task performance that we may care about. In the following, we first describe each of
these core experimental aspects and then we detail the remaining aspects of the experimental design.
3.1 Setting: Domain
The question of what kinds of explanation a human can use implies the presence of a setting, task,
and metric that the explanation will facilitate. Examples include improving safety, where a user
might use the explanation to determine when the machine learning system will make a mistake; and
increasing trust, where a user might be convinced to use a machine learning system if it justifies
its actions in plausible ways. While evaluating how well explanations facilitate real world tasks is
the ultimate goal, it is challenging because we must control for the knowledge and assumptions
that people bring with them when making these decisions. For example, even if the task is the
same—improving safety—people may bring different assumptions based on aspects of the domain
(e.g., perceived risk of the decision).
To rigorously control for outside knowledge that could influence our results, we created two
domains—recommending recipes and medicines to aliens —to which humans could not bring any
prior knowledge. Further, each question involved a supposedly different alien to further encourage
the users to not generalize within the experiment. All non-literals (e.g., what ingredients were
spices) were defined in a dictionary so that all participants would have the same concepts in both
experiments. Although designed to feel very different, this synthetic set-up also allowed us to
maintain exact parallels between inputs, outputs, categories, and the forms of explanations.
• Recipe Study participants were told that the machine learning system had studied a group
of aliens and determined each of their individual food preferences in various settings (e.g.,
5weekend). This scenario represents a setting in which customers may wish to inspect product
recommendations. This domain was designed to feel like a low-risk decision. Here, the inputs
are settings, the outputs are groups of food, and the recommendations are specific foods.
• Clinical Study participants were told that the machine learning system had studied a group
of aliens and determined personalized treatment strategies for various symptoms (e.g., sore
throat). This scenario closely matches a clinical decision support setting in which a doctor
might wish to inspect the decision support system. This domain was designed to feel like a
high-risk decision. Here, the inputs are symptoms, the outputs are classes of drugs, and the
recommendations are specific drugs. We chose drug names that start with the first letter of the
drug class (e.g., antibiotics were Aerove, Adenon and Athoxin) so as to replicate the level of
ease and familiarity of food names.
We hypothesized that the trends would be consistent across both domains.
3.2 Setting: Choice of Task
In any domain, there are many possible tasks that an explanation could facilitate. For example, one
could be interested in error in recipe suggestions or a mechanism for alien disease. To stay general,
as well as continue to rigorously control for outside knowledge and assumptions, we follow the
suggestion of Doshi-Velez and Kim [2017] and consider a core set of three cognitive tasks designed
to test how well humans understand the explanation:
• Simulation Predicting the system’s recommendation given an explanation and a set of input
observations. Participants were given observations about the alien and the alien’s preferences
and were asked to make a recommendation that would satisfy the alien. See Figure 9.
• Verification Verifying whether the system’s recommendation is consistent given an explana-
tion and a set of input observations. Participants were given a recommendation as well as the
observations and preferences and asked whether it would satisfy the alien. See Figure 2.
• Counterfactual Determining whether the system’s recommendation changes given an ex-
planation, a set of input observations, and a perturbation that changes one dimension of the
input observations. Participants were given a change to one of the observations in addition to
the observations, preferences and recommendation and asked whether the alien’s satisfaction
with the recommendation would change. See Figure 10.
As before, we hypothesized that while some tasks may be easier or harder, the trends of what makes
a good explanation would be consistent across tasks.
3.3 Explanation Variation
While decision sets are interpretable, there are a large number of ways in which they can be varied
that potentially affect how easy they are for humans to use. Following initial pilot studies (see
Appendix 6), we chose to focus on three main sources of variation:
6• V1: Explanation Size. We varied the size of the explanation across two dimensions: the total
number of lines in the decision set, and the number of terms within the output clause. The first
corresponds to increasing the vertical size of the explanation—the number of cases—while
the second corresponds to increasing the horizontal size of the explanation—the complexity
of each case. We focused on output clauses because they were harder to parse: input clauses
could be quickly scanned for setting-related terms, but output clauses had to be read through
and processed completely to determine the correct answer. We hypothesized that increasing
the size of the explanation across either dimension would increase response time. For example,
the explanation in Figure 2 has 4 lines (in addition to the first 3 lines that define what we call
explicit cognitive chunks), and 3 terms in each output clause.
• V2: Cognitive Chunks. We varied the number of cognitive chunks, and whether they were
implicitly or explicitly defined. We define a cognitive chunk as a clause in disjunctive normal
form of the inputs that may recur throughout the decision set. Explicit cognitive chunks are
mapped to a name that is then used to reference the chunk throughout the decision set, while
implicit cognitive chunks recur throughout the decision set without ever being explicitly
named. On one hand, creating new cognitive chunks can make an explanation more succinct,
while on the other hand, the human must now process an additional idea. We hypothesized
that explicitly introducing cognitive chunks instead of having long clauses that implicitly
contained them would reduce response time. For example, the explanation in Figure 2 has 3
explicit cognitive chunks, and the explanation in Figure 10 has 3 implicit cognitive chunks.
• V3: Repeated Terms. We varied the number of times that input conditions were repeated
in the decision set. If input conditions in the decision list have little overlap, then it may be
faster to find the appropriate one because there are fewer relevant cases to consider than if the
input conditions appear in each line. Repeated terms was also a factor used by Lakkaraju et al.
[2016] to measure interpretability. We hypothesized that if an input condition appeared in
several lines of the explanation, this would increase the time it took to search for the correct
rule in the explanation. For example, each of the observations in Figure 2 appears twice in the
explanation (the observations used in the explicit cognitive chunks appear only once, but the
final chunk appears twice).
3.4 Metrics
In a real domain, one may have a very specific metric, such as false positive rate given no more than
two minutes of thinking or the number of publishable scientific insights enabled by the explanation.
In our experiments, we considered three basic metrics that are likely to be relevant to most tasks:
response time, accuracy, and subjective satisfaction:
• Response Time was measured as the number of seconds from when the task was displayed
until the subject hit the submit button on the interface.
• Accuracy was measured if the subject correctly identified output consistency for verification
questions, the presence or absence of a change in recommendation correctness under the
7perturbation for counterfactual questions, and any combination of correct categories for
simulation questions.
• Subjective Satisfaction was measured on a 5-point Likert scale. After submitting their
answer for each question, but before being told if their answer was correct, the participant
was asked to subjectively rate the quality of the explanation on a scale from 1 to 5 where 1
was very easy to use, 3 was neutral and 5 was very hard to use.
3.5 Experimental Design and Interface
The three kinds of variation and two domains resulted in six total experiments. The experiments had
parallel structures across the domains. For each question, we ask a simulation, a verification and
a counterfactual version with parallel logic structures but different observations. Question order
was block-randomized for every participant so participants were always shown a verification, then
a simulation, then a counterfactual question, but which condition these came from was randomly
determined. Domain and experiment were between subject variables, while task and explanation
variation are within subjects variables. Each participant completed a single, full experiment.
Conditions The experiment levels were as follows:
• V1: Explanation Size. We manipulated the length of the explanation (varying between 2,
5, and 10 lines) and the length of the output clause (varying between 2 and 5 terms). Each
combination was tested once with each question type, for a total of 18 questions. All inputs
appeared 3 times in the decision set.
• V2: Cognitive Chunks. We manipulated the number of cognitive chunks (repeated clauses in
disjunctive normal form of the inputs) introduced (varying between 1, 3 and 5), and whether
they were embedded into the explanation (implicit) or abstracted out into new cognitive
chunks and later referenced by name (explicit). Each combination was tested once with each
question type, for a total of 18 questions. 1 input was used in each experiment to evaluate the
answer directly, and 2 were used to evaluate the cognitive chunks, which was used to evaluate
the answer. All of the cognitive chunks were used to determine the correct answer to ensure
that the participant had to traverse all concepts instead of skimming for the relevant one. For
explicit cognitive chunks, the input used to evaluate it appeared only once, but the chunk
appeared 2 times. All other inputs appeared twice. All decision sets had 4 lines in addition to
any explicit cognitive chunks. All output clauses had 3 elements.
• V3: Repeated Terms. We manipulated the number of times the input conditions appeared in
the explanation (varying between 2, 3, 4 and 5) and held the number of lines and length of
clauses constant. Each combination was tested once within an experiment, for a total of 12
questions. All decision sets had 6 lines. All output clauses had 3 elements.
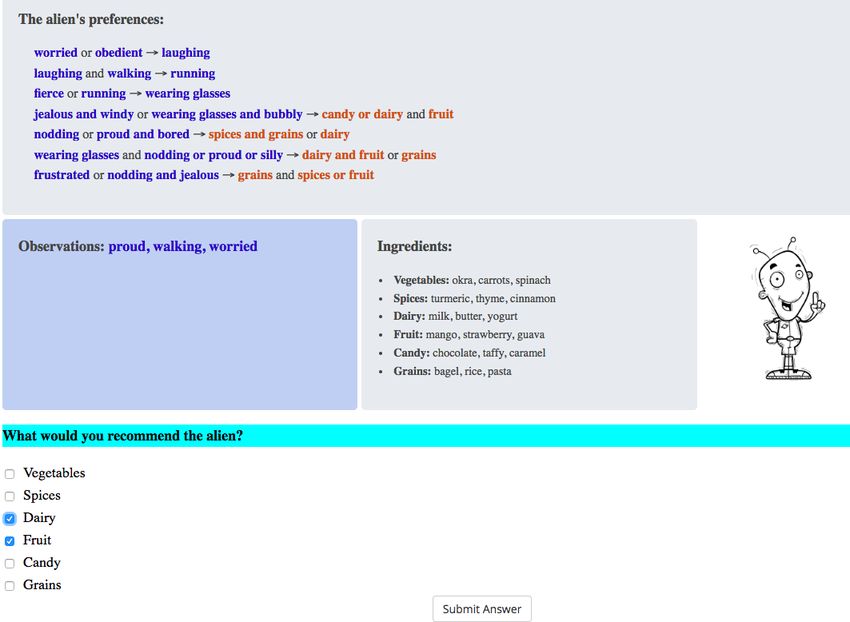
8Figure 2: Screenshot of our interface for the verification task in the recipe domain. The bottom left
box shows the observations we give participants about the alien, and a meal recommendation. They
must then say whether the machine learning system agrees with the recommendation based on the
explanation. Each task is coded in a different color (e.g., yellow) to visually distinguish them.
Experimental Interface Figure 2 shows our interface for the verification task in the Recipe
domain. The observations section refers to the inputs into the algorithm. The recommendation
section refers to the output of the algorithm. The preferences section contains the explanation—the
reasoning that the supposed machine learning system used to suggest the output (i.e., recommenda-
tion) given the input, presented as a procedure in the form of a decision set. Finally, the ingredients
section in the Recipe domain (and the disease medications section in the Clinical domain) contained
a dictionary defining concepts relevant to the experiment (for example, the fact that bagels, rice,
and pasta are all grains). Including this list explicitly allowed us to control for the fact that some
human subjects may be more familiar with various concepts than others. At the bottom is where the
subject completes the task: responses were submitted using a radio button for the verification and
counterfactual questions, and using check-boxes for simulation questions.
The choice of location for these elements was chosen based on pilot studies (described in
Appendix 6) —while an ordering of input, explanation, output might make more sense for an AI
expert, we found that presenting the information in the format of Figure 2 seemed to be easier for
subjects to follow in our preliminary explorations. We also found that presenting the decision set
as a decision set seemed easier to follow than converting it into paragraphs. Finally, we colored
the input conditions in blue and outputs in orange within the explanation. We found that this
highlighting system made it easier for participants to parse the explanations for input conditions.
We also highlighted the text of each question type in a different color based on informal feedback
that it was hard to differentiate between verification and counterfactual questions.
9Additional Experimental Details In addition to the variations and settings of interest, there were
many details that had to be fixed to create consistent experiments. In the recipe domain, we held the
list of ingredients, food categories, and possible input conditions constant. Similarly, in the clinical
domain, we held the list of symptoms, medicine categories, and possible input conditions constant.
All questions had three observations, and required using each one to determine the correct answer.
Verification questions had two recommendations from two distinct categories. Each recommen-
dation in the verification task matched half of the lines in the decision set. Determining the correct
answer for verification questions never required differentiating between OR and XOR.
Counterfactual questions required a perturbation: we always perturbed exactly one observation.
The perturbed observation appeared once. The perturbed example always evaluated to a new line of
the decision set. Counterfactual questions had a balanced number of each sequence of true/false
answers for the original and perturbed input.
Finally, to avoid participants building priors on the number of true and false answers, the
verification and counterfactual questions had an equal number of each. This notion of balancing did
not apply to the simulation task, but in the results, high accuracies rule out random guessing.
Participants We recruited 150 subjects for each of our six experiments through Amazon Mechan-
ical Turk (900 subjects all together). Participants were given a tutorial on each task and the interface,
and were told that their primary goal was accuracy, and their secondary goal was speed. Before
completing the task, participants were given a set of three practice questions, one drawn from each
question type. If they answered these correctly, they could move directly to the experiment, and
otherwise they were given an additional set of three practice questions.
We excluded participants from the analysis who did not get all of one of the two sets of three
practice questions correct. While this may have the effect of artificially increasing the accuracy rates
overall—we are only including participants who could already perform the task to a reasonable
extent—this criterion helped filter the substantial proportion of participants who were simply
breezing through the experiment to get their payment. We also excluded 6 participants who got
sufficient practice questions correct but then took more than five minutes to answer a single question
under the assumption that they got distracted while taking the experiment. Table 2 describes the
total number of participants that remained in each experiment out of the original 150 participants.
Number of Participants
Experiment Recipe Clinical
Explanation Size (V1) 59 69
New Cognitive Chunks (V2) 62 55
Variable Repetition (V3) 70 52
Table 2: Number of participants who met our inclusion criteria for each experiment.
Most participants were from the US or Canada and were less than 50 years old. A majority had
a Bachelor’s degree. There were somewhat more male participants than female. We note that US
and Canadian participants with moderate to high education dominate this survey, and results may be
10different for people from different cultures and backgrounds. Table 3 summarizes the demographics
of all subjects included in the analysis across the experiments.
Participant Demographics
Feature Categories and Proportion
Age 18-34 61.1% 35-50 33.5% 51-69 5.4%
Gender Male 62.7% Female 37.0% Other 0.3%
Education High School 33.2% Bachelors 53.4% Masters and Beyond 9.1%
Region US/Canada 92.8% Asia 4.8% South America 1.6%
Table 3: Participant Demographics. There were no participants over 69 years old. 4.3% of partici-
pants reported “other” for their education level. The rates of participants from Australia, Europe
and Latin America were all less than 0.5%. (All participants were included in the analyses, but we
do not list specific proportions for them for brevity.)
4 Results
We report response time, accuracy and subjective satisfaction (whether participants thought the task
was easy to complete or not) across all six experiments in Figures 3, 5 and 7, respectively. Response
time is shown for subjects who correctly answered the questions. Response time and subjective
satisfaction were normalized across participants by subtracting the participant-specific mean.
We evaluated the statistical significance of the trends in these figures using a linear regression for
the continuous outputs (response time, subjective score) and a logistic regression for binary output
(accuracy). For each outcome, one regression was performed for each of the experiments V1, V2,
and V3. If an experiment had more than one independent variable—e.g., number of lines and terms
in output—we performed one regression with both variables. We included whether the task was a
verification or a counterfactual question as 2 distinct binary variables that should be interpreted with
respect to the simulation task. Regressions were performed with the statsmodels library [Seabold
and Perktold, 2010] and included an intercept term. In Table 4, Table 6 and Table 8, we report the
results of these regressions with p-values that are significant at α = 0.05 after a Bonferroni multiple
comparisons correction across all tests of all experiments highlighted in bold.
We next describe our main findings. We find that greater complexity results in longer response
times, but the magnitude of the effect varies across the different kinds of explanation variation in
sometimes unexpected ways. These results are consistent across domains, tasks, and metrics.
Greater complexity results in longer response times, but the magnitude of the effect varies by
the type of complexity. Unsurprisingly, adding complexity generally increases response times. In
Figure 3, we see that increasing the number of lines, the number of terms within a line, adding new
cognitive chunks, and repeating variables all show trends towards increasing response time. Table 4
reports which of these response time trends are statistically significant: the number of cognitive
chunks and whether these are implicitly embedded in the explanation or explicitly defined had a
statistically significant effect on response time in both domains, the number of lines and the number
11of output terms had a statistically significant effect on response time only in the recipe domain, and
the number of repeated variables did not have a statistically significant effect in either domain.
More broadly, the magnitude of the increase in response time varies across these factors. (Note
the the y-axes in Figure 3 all have the same scale for easy comparison.) Introducing new cognitive
chunks can result in overall increases in response time on the order of 20 seconds, whereas increases
in length has increases on the order of 10 seconds. Increases in variable repetition does not always
have a consistent effect, and even when it does, the trend does not appear to be on the order of more
than a few seconds. These relationships have implications for designers of explanation systems:
variable repetitions seem to have significantly less burden than new concepts.
Another interesting finding was that participants took significantly longer to answer when new
cognitive chunks were made explicit rather than implicitly embedded in a line. That is, participants
were faster when they had to process fewer, longer lines (with an implicit concept) rather than when
they had to process more, simpler lines. One might have expected the opposite—that is, it is better
to break complex reasoning into smaller chunks—and it would be interesting to unpack this effect
in future experiments. For example, it could be that explicitly instantiating new concepts made the
explanation harder to scan, and perhaps highlighting the locations of input terms (to make them
easier to find) would negate this effect.
Consistency across domains: Magnitudes of effects change, but trends stay the same. In
all experiments, the general trends are consistent across both the recipe and clinical domains.
Sometimes an effect is weaker or unclear, but never is an effect clearly reversed. There were 21
cases of factors that had a statistically significant effect on a dependent variable in at least 1 of the 2
domains. For 19 of those, the 95% confidence interval of both domains had the same sign (i.e., the
entire 95% confidence interval was positive for both domains or negative for both domains). For the
other 2 (the effect of verification questions on accuracy and response time for experiment V1), one
of the domains (clinical) was inconclusive (interval overlaps zero). The consistency of the signs of
the effects bodes well for there being a set of general principles for guiding explanation design, just
as there exist design principles for user interfaces and human-computer interaction.
Consistency across tasks: Relative trends stay the same, different absolute values. The ef-
fects of different kinds of complexity on response time were also consistent across tasks. That
said, actual response times varied significantly between tasks. In Figure 3, we see that the response
times for simulation questions are consistently low, and the response times for counterfactual
questions are consistently high (statistically significant across all experiments except V2 in the
Recipe domain). Response times for verification questions are generally in between, and often
statistically significantly higher than the easiest setting of simulation. For designers of explanation,
this consistency of the relative effects of different explanation variations bodes well for general
design principles. For designers of tasks, the differences in absolute response times suggests that
the framing of the task does matter for the user.
12Response Time
(a) Recipe V1 Time (b) Recipe V2 Time (c) Recipe V3 Time
(d) Clinical V1 Time (e) Clinical V2 Time (f) Clinical V3 Time
Figure 3: Response times across the six experiments. Responses were normalized by subtracting
out the subject-specific mean to create centered values, and only response times for those subjects
who got the question right are included. Vertical lines indicate standard errors.
Clinical Recipe
Factor Weight P-Value Weight P-Value
Number of Lines (V1) 1.17 1.41E-05 1.01 0.00317
Number of Output Terms (V1) 2.35 7.37E-05 1.57 0.0378
Verification (V1) 10.5 3.98E-07 4.11 0.121
Counterfactual (V1) 21 1.58E-19 13.7 1.79E-06
Number of Cognitive Chunks (V2) 6.04 8.22E-11 5.88 4.45E-17
Implicit Cognitive Chunks (V2) -13 2.16E-05 -7.93 0.000489
Verification (V2) 16.3 6.91E-06 15.4 1.27E-08
Counterfactual (V2) 8.56 0.0265 19.9 6.65E-12
Number of Variable Repetitions (V3) 1.9 0.247 0.884 0.463
Verification (V3) 13 0.00348 13.7 3.03E-05
Counterfactual (V3) 20.3 2.41E-05 16.6 1.91E-06
Figure 4: Significance tests for each factor for normalized response time. A single linear regression
was computed for each of V1, V2, and V3. Coefficients for verification and counterfactual tasks
should be interpreted with respect to the simulation task. Highlighted p-values are significant at α =
0.05 with a Bonferroni multiple comparisons correction across all tests of all experiments.
13Accuracy
(a) Recipe V1 Accuracy (b) Recipe V2 Accuracy (c) Recipe V3 Accuracy
(d) Clinical V1 Accuracy (e) Clinical V2 Accuracy (f) Clinical V3 Accuracy
Figure 5: Accuracy across the six experiments. Vertical lines indicate standard errors.
Clinical Recipe
Factor Weight P-Value Weight P-Value
Number of Lines (V1) 0.029 0.236 0.00598 0.842
Number of Output Terms (V1) -0.136 0.011 -0.117 0.0771
Verification (V1) 0.925 0.000652 0.476 0.174
Counterfactual (V1) -1.41 1.92E-14 -1.7 1.24E-11
Number of Cognitive Chunks (V2) -0.0362 0.42 -0.0364 0.416
Implicit Cognitive Chunks (V2) -0.246 0.093 -0.179 0.222
Verification (V2) 0.646 0.0008 0.532 0.00904
Counterfactual (V2) -0.368 0.0294 -0.773 4.36E-06
Number of Variable Repetitions (V3) 0.0221 0.804 -0.0473 0.524
Verification (V3) 0.146 0.596 0.196 0.371
Counterfactual (V3) -1.07 7.25E-06 -0.67 0.00066
Figure 6: Significance tests for each factor for accuracy. A single logistic regression was computed
for each of V1, V2, and V3. Coefficients for verification and counterfactual tasks should be
interpreted with respect to the simulation task. Highlighted p-values are significant at α = 0.05 with
a Bonferroni multiple comparisons correction across all tests of all experiments.
14Subjective Satisfaction
(a) Recipe V1 Satisfaction (b) Recipe V2 Satisfaction (c) Recipe V3 Satisfaction
(d) Clinical V1 Satisfaction (e) Clinical V2 Satisfaction (f) Clinical V3 Satisfaction
Figure 7: Subjective satisfaction across the six experiments. Participants were asked to rate how
difficult it was to use each explanation to complete the task on a scale from 1 (very easy) to 5 (very
hard). Responses were normalized by subtracting out the subject-specific mean to create centered
values. Vertical lines indicate standard errors.
Clinical Recipe
Factor Weight P-Value Weight P-Value
Number of Lines (V1) 0.0495 8.5E-13 0.0491 5.57E-11
Number of Output Terms (V1) 0.116 2.28E-14 0.116 2.54E-12
Verification (V1) 0.13 0.0187 0.169 0.00475
Counterfactual (V1) 1.01 1.16E-65 1.04 1.5E-59
Number of Cognitive Chunks (V2) 0.177 3.96E-24 0.254 3.76E-54
Implicit Cognitive Chunks (V2) -0.228 4.1E-05 -0.121 0.0171
Verification (V2) 0.0697 0.305 0.092 0.14
Counterfactual (V2) 0.288 2.42E-05 0.52 1.61E-16
Number of Variable Repetitions (V3) 0.057 0.0373 0.0676 0.00411
Verification (V3) 0.0326 0.664 0.169 0.00899
Counterfactual (V3) 0.887 1.93E-29 0.767 2.41E-30
Figure 8: Significance tests for each factor for normalized subjective satisfaction. A single linear
regression was computed for each of V1, V2, and V3. Coefficients for verification and counterfactual
tasks should be interpreted with respect to the simulation task. Highlighted p-values are significant
at α = 0.05 with a Bonferroni multiple comparisons correction across all tests of all experiments.
15Consistency across metrics: Subjective satisfaction follows response time, less clear trends in
accuracy. So far, we have focused our discussion on trends with respect to response time. In
Table 8, we see that subjective satisfaction largely replicates the findings of response time. We see
a statistically significant preference for simulation questions over counterfactuals. We also see a
statistically significant effect of the number of cognitive chunks, explanation length, and number of
output terms. The finding that people prefer implicit cognitive chunks to explicit cognitive chunks
appeared only in the recipe domain. These results suggest that, in general, peoples’ subjective
preferences may reflect objective measures of interpretability like response time. However, we must
also keep in mind that especially for a Turk study, subjective satisfaction may match response times
because faster task completion corresponds to a higher rate of pay.
Unlike response time and subjective satisfaction, where the trends were significant and consistent,
the effect of explanation variation on accuracy was less clear. None of the effects due to explanation
variation were statistically significant, and there are no clear trends. We believe that this was because
in our experiments, we asked participants to be fast but accurate, effectively pushing any effects into
response time. That said, even when participants were coached to be accurate, some tasks proved
harder than others: counterfactual tasks had significantly lower accuracies than simulation tasks.
5 Discussion
Identifying how different factors affect a human’s ability to utilize explanation is an essential piece
for creating interpretable machine learning systems—we need to know what to optimize. What
factors have the largest effect, and what kind of effect? What factors have relatively little effect?
Such knowledge can help us expand to faithfulness of the explanation to what it is describing with
minimal sacrifices in human ability to process the explanation.
Consistent patterns provide guidance for design of explanation systems. In this work, we
found consistent patterns across metrics, tasks, and domains for the effect of different kinds of
explanation variation. These patterns suggest that, for decision sets, the introduction of new cognitive
chunks or abstractions had the greatest effect on response time, then explanation size (overall length
or length of line), and finally there was relatively little effect due to variable repetition. These
patterns are interesting because machine learning researchers have focused on making decision
set lines orthogonal (e.g., [Lakkaraju et al., 2016]), which is equivalent to minimizing variable
repetitions, but perhaps, based on these results, efforts should be more focused on explanation
length and if and how new concepts are introduced.
We also find consistent patterns across explanation forms for the effect of certain tasks. Simula-
tion was the fastest, followed by verification and then counterfactual reasoning. The counterfactual
reasoning task also had the lowest accuracies. This suggests that participants doing the verification
and counterfactual reasoning tasks were likely first simulating through the explanation and then
doing the verification or counterfactual reasoning. (We note that while our results focus on response
time, if participants were time-limited, we would expect effects in response time to turn into effects
in accuracy.) While these observations are less relevant to designers of explanation systems, they
may be valuable for those considering how to design tasks.
16There exist many more directions to unpack. While we found overall consistent and sensible
trends, there are definitely elements from this study that warrent further investigation. Particularly
unexpected was that participants had faster response times when new cognitive chunks were implicit
rather than explicit. It would be interesting to unpack whether that effect occurred simply because it
meant one could resolve the answer in one long line, rather than two (one to introduce the concept,
one to use it), and whether the familiarity of the new concept has an effect. More broadly, as
there are large ML efforts around representation learning, understanding how humans understand
intermediate concepts is an important direction.
Other interesting experimental directions include the metrics and the interface. Regarding the
metrics, now that we know what kinds of explanations can be processed the fastest, it would be
interesting to see if subjective satisfaction correlates to those variables in the absence of a task. That
is, without any time pressure or time incentive, do people still prefer the same properties purely
subjectively? Regarding the interface, we chose ours based on several rounds of pilot studies and
then fixed it. However, one can imagine many ways to optimize the display of information, such as
highlighting relevant lines. Ultimately, the choice of the display will have to reflect the needs of the
downstream task.
More broadly, there are many interesting directions regarding what kinds of explanation are best
in what contexts. Are there universals that make for interpretable procedures, whether they be cast as
decision sets, decision trees, or more general pseudocode; whether the task is verification, forward
simulation, or counterfactual reasoning? Do these universals also carry over to regression settings?
Or does each scenario have its own set of requirements? When the dimensionality of an input gets
very large, do trade-offs for defining new intermediate concepts change? A better understanding of
these questions is critical to design systems that can provide effective explanation to human users.
Finally, future work will need to connect performance on these basic tasks to finding errors,
deciding whether to trust the model, and other real-world tasks. These tasks are more difficult to do
in controlled settings because each user must have a similar level of grounding in the experimental
domain to determine whether an action might be, for example, safe. Our work is just one part of a
process of building our understanding of how humans use explanation.
6 Conclusion
In this work, we investigated how the ability of humans to perform a set of simple tasks—simulation
of the response, verification of a suggested response, and determining whether the correctness of a
suggested response changes under a change to the inputs—varies as a function of explanation size,
new types of cognitive chunks and repeated terms in the explanation. We found consistent effects
across tasks, metrics, and domains, suggesting that there may exist some common design principles
for explanation systems.
Acknowledgements The authors acknowledge PAIR at Google, a Google Faculty Research
Award, and the Harvard Berkman Klein Center for their support. IL is supported by NIH 5T32LM012411-
02.
17References
Philip Adler, Casey Falk, Sorelle A Friedler, Gabriel Rybeck, Carlos Scheidegger, Brandon Smith,
and Suresh Venkatasubramanian. Auditing black-box models for indirect influence. In Data
Mining (ICDM), 2016 IEEE 16th International Conference on, pages 1–10. IEEE, 2016.
Hiva Allahyari and Niklas Lavesson. User-oriented assessment of classification model understand-
ability. In 11th scandinavian conference on Artificial intelligence. IOS Press, 2011.
Mustafa Bilgic and Raymond J Mooney. Explaining recommendations: Satisfaction vs. promotion.
In Beyond Personalization Workshop, IUI, volume 5, page 153, 2005.
Leo Breiman, Jerome Friedman, Charles J Stone, and Richard A Olshen. Classification and
regression trees. CRC press, 1984.
Cristian Bucilu, Rich Caruana, and Alexandru Niculescu-Mizil. Model compression. In Proceedings
of the 12th ACM SIGKDD international conference on Knowledge discovery and data mining,
pages 535–541. ACM, 2006.
Adrian Bussone, Simone Stumpf, and Dympna O’Sullivan. The role of explanations on trust
and reliance in clinical decision support systems. In Healthcare Informatics (ICHI), 2015
International Conference on, pages 160–169. IEEE, 2015.
Kevin Canini, Andy Cotter, MR Gupta, M Milani Fard, and Jan Pfeifer. Fast and flexible monotonic
functions with ensembles of lattices. Advances in Neural Information Processing Systems (NIPS),
2016.
Rich Caruana, Yin Lou, Johannes Gehrke, Paul Koch, Marc Sturm, and Noemie Elhadad. Intelligible
models for healthcare: Predicting pneumonia risk and hospital 30-day readmission. In Proceedings
of the 21th ACM SIGKDD International Conference on Knowledge Discovery and Data Mining,
pages 1721–1730. ACM, 2015.
Girish Chandrashekar and Ferat Sahin. A survey on feature selection methods. Computers &
Electrical Engineering, 40(1):16–28, 2014.
Xi Chen, Yan Duan, Rein Houthooft, John Schulman, Ilya Sutskever, and Pieter Abbeel. Infogan:
Interpretable representation learning by information maximizing generative adversarial nets,
2016.
Peter Clark and Robin Boswell. Rule induction with cn2: Some recent improvements. In European
Working Session on Learning, pages 151–163. Springer, 1991.
William W Cohen. Fast effective rule induction. In Proceedings of the twelfth international
conference on machine learning, pages 115–123, 1995.
18Dan Cosley, Shyong K Lam, Istvan Albert, Joseph A Konstan, and John Riedl. Is seeing believing?:
how recommender system interfaces affect users’ opinions. In Proceedings of the SIGCHI
conference on Human factors in computing systems, pages 585–592. ACM, 2003.
Finale Doshi-Velez and Been Kim. A roadmap for a rigorous science of interpretability. arXiv
preprint arXiv:1702.08608, 2017.
Finale Doshi-Velez, Byron Wallace, and Ryan Adams. Graph-sparse lda: a topic model with
structured sparsity. Association for the Advancement of Artificial Intelligence, 2015.
Tapio Elomaa. In defense of c4. 5: Notes on learning one-level decision trees. ML-94, 254:62, 2017.
Eibe Frank and Ian H Witten. Generating accurate rule sets without global optimization. 1998.
Alex A Freitas. Comprehensible classification models: a position paper. ACM SIGKDD explorations
newsletter, 15(1):1–10, 2014.
Brendan J Frey and Delbert Dueck. Clustering by passing messages between data points. science,
315(5814):972–976, 2007.
Boris Hayete and Jadwiga R Bienkowska. Gotrees: Predicting go associations from proteins.
Biocomputing 2005, page 127, 2004.
Jan Horsky, Gordon D Schiff, Douglas Johnston, Lauren Mercincavage, Douglas Bell, and Blackford
Middleton. Interface design principles for usable decision support: a targeted review of best
practices for clinical prescribing interventions. Journal of biomedical informatics, 45(6):1202–
1216, 2012.
Michael C Hughes, Huseyin Melih Elibol, Thomas McCoy, Roy Perlis, and Finale Doshi-Velez.
Supervised topic models for clinical interpretability. arXiv preprint arXiv:1612.01678, 2016.
J. Huysmans, K. Dejaeger, C. Mues, J. Vanthienen, and B. Baesens. An empirical evaluation of the
comprehensibility of decision table, tree and rule based predictive models. DSS, 2011.
Jongbin Jung, Connor Concannon, Ravi Shroff, Sharad Goel, and Daniel G Goldstein. Simple rules
for complex decisions. 2017.
Daniel Kahneman. Thinking, fast and slow. Macmillan, 2011.
Frank Keil. Explanation and understanding. Annu. Rev. Psychol., 2006.
B. Kim, C. Rudin, and J.A. Shah. The Bayesian Case Model: A generative approach for case-based
reasoning and prototype classification. In NIPS, 2014.
Been Kim, Elena Glassman, Brittney Johnson, and Julie Shah. iBCM: Interactive bayesian case
model empowering humans via intuitive interaction. 2015a.
19Been Kim, Julie Shah, and Finale Doshi-Velez. Mind the gap: A generative approach to interpretable
feature selection and extraction. In Advances in Neural Information Processing Systems, 2015b.
Pieter-Jan Kindermans, Kristof T Schütt, Maximilian Alber, Klaus-Robert Müller, and Sven Dähne.
Patternnet and patternlrp–improving the interpretability of neural networks. arXiv preprint
arXiv:1705.05598, 2017.
Viktoriya Krakovna and Finale Doshi-Velez. Increasing the interpretability of recurrent neural
networks using hidden markov models. arXiv preprint arXiv:1606.05320, 2016.
Todd Kulesza, Simone Stumpf, Margaret Burnett, Sherry Yang, Irwin Kwan, and Weng-Keen Wong.
Too much, too little, or just right? ways explanations impact end users’ mental models. In Visual
Languages and Human-Centric Computing (VL/HCC), 2013 IEEE Symposium on, pages 3–10.
IEEE, 2013.
Himabindu Lakkaraju, Stephen H Bach, and Jure Leskovec. Interpretable decision sets: A joint
framework for description and prediction. In Proceedings of the 22nd ACM SIGKDD International
Conference on Knowledge Discovery and Data Mining, pages 1675–1684. ACM, 2016.
Tao Lei, Regina Barzilay, and Tommi Jaakkola. Rationalizing neural predictions. arXiv preprint
arXiv:1606.04155, 2016.
Benjamin Letham, Cynthia Rudin, Tyler H McCormick, David Madigan, et al. Interpretable
classifiers using rules and bayesian analysis: Building a better stroke prediction model. The
Annals of Applied Statistics, 9(3):1350–1371, 2015.
Weiwei Liu and Ivor W Tsang. Sparse perceptron decision tree for millions of dimensions. In AAAI,
pages 1881–1887, 2016.
Tania Lombrozo. The structure and function of explanations. Trends in cognitive sciences, 10(10):
464–470, 2006.
Tania Lombrozo. Simplicity and probability in causal explanation. Cognitive psychology, 55(3):
232–257, 2007.
Tahir Mehmood, Kristian Hovde Liland, Lars Snipen, and Solve Sæbø. A review of variable
selection methods in partial least squares regression. Chemometrics and Intelligent Laboratory
Systems, 118:62–69, 2012.
Abhinav Mehrotra, Robert Hendley, and Mirco Musolesi. Interpretable machine learning for
mobile notification management: An overview of prefminer. GetMobile: Mobile Computing and
Communications, 21(2):35–38, 2017.
Donald Michie. Machine learning in the next five years. In Proceedings of the 3rd European
Conference on European Working Session on Learning, pages 107–122. Pitman Publishing, 1988.
20George A Miller. The magical number seven, plus or minus two: some limits on our capacity for
processing information. Psychological review, 63(2):81, 1956.
Stephen H Muggleton, Dianhuan Lin, and Alireza Tamaddoni-Nezhad. Meta-interpretive learning
of higher-order dyadic datalog: Predicate invention revisited. Machine Learning, 100(1):49–73,
2015.
Forough Poursabzi-Sangdeh, Daniel G. Goldstein, Jake M. Hofman, Jennifer Wortman Vaughan,
and Hanna Wallach. Manipulating and measuring model interpretability. In NIPS Workshop on
Transparent and Interpretable Machine Learning in Safety Critical Environments, 2017.
Paul Raccuglia, Katherine C Elbert, Philip DF Adler, Casey Falk, Malia B Wenny, Aurelio Mollo,
Matthias Zeller, Sorelle A Friedler, Joshua Schrier, and Alexander J Norquist. Machine-learning-
assisted materials discovery using failed experiments. Nature, 533(7601):73–76, 2016.
Marco Tulio Ribeiro, Sameer Singh, and Carlos Guestrin. Why should i trust you?: Explaining the
predictions of any classifier. In Proceedings of the 22nd ACM SIGKDD International Conference
on Knowledge Discovery and Data Mining, pages 1135–1144. ACM, 2016.
Ronald L Rivest. Learning decision lists. Machine learning, 2(3):229–246, 1987.
Andrew Ross, Michael C Hughes, and Finale Doshi-Velez. Right for the right reasons: Training
differentiable models by constraining their explanations. In International Joint Conference on
Artificial Intelligence, 2017.
Stefan Rüping. Thesis: Learning interpretable models. PhD thesis, Universitat Dortmund, 2006.
S Rasoul Safavian and David Landgrebe. A survey of decision tree classifier methodology. IEEE
transactions on systems, man, and cybernetics, 21(3):660–674, 1991.
Ute Schmid, Christina Zeller, Tarek Besold, Alireza Tamaddoni-Nezhad, and Stephen Muggleton.
How does predicate invention affect human comprehensibility? In International Conference on
Inductive Logic Programming, pages 52–67. Springer, 2016.
Skipper Seabold and Josef Perktold. Statsmodels: Econometric and statistical modeling with python.
In Proceedings of the 9th Python in Science Conference, volume 57, page 61, 2010.
Ramprasaath R Selvaraju, Abhishek Das, Ramakrishna Vedantam, Michael Cogswell, Devi Parikh,
and Dhruv Batra. Grad-cam: Why did you say that? visual explanations from deep networks via
gradient-based localization. arXiv preprint arXiv:1610.02391, 2016.
Avanti Shrikumar, Peyton Greenside, Anna Shcherbina, and Anshul Kundaje. Not just a black box:
Interpretable deep learning by propagating activation differences. ICML, 2016.
Sameer Singh, Marco Tulio Ribeiro, and Carlos Guestrin. Programs as black-box explanations.
arXiv preprint arXiv:1611.07579, 2016.
21You can also read