An overlooked pink species of land iguana in the Galápagos - PNAS
←
→
Page content transcription
If your browser does not render page correctly, please read the page content below
An overlooked pink species of land iguana in
the Galápagos
Gabriele Gentilea,1, Anna Fabiania, Cruz Marquezb, Howard L. Snellc, Heidi M. Snellc, Washington Tapiad,
and Valerio Sbordonia
aDipartimento di Biologia, Università Tor Vergata, 00133 Rome, Italy; bCharles Darwin Foundation, Puerto Ayora, Galápagos Islands, Ecuador; cDepartment
of Biology and Museum of Southwestern Biology, University of New Mexico, Albuquerque, NM 87131; and dGalápagos National Park Service, Puerto Ayora,
Galápagos Islands, Ecuador
Edited by Francisco J. Ayala, University of California, Irvine, CA, and approved November 11, 2008 (received for review July 2, 2008)
Despite the attention given to them, the Galápagos have not yet
finished offering evolutionary novelties. When Darwin visited the
Galápagos, he observed both marine (Amblyrhynchus) and land
(Conolophus) iguanas but did not encounter a rare pink black-
striped land iguana (herein referred to as ‘‘rosada,’’ meaning
‘‘pink’’ in Spanish), which, surprisingly, remained unseen until
1986. Here, we show that substantial genetic isolation exists
between the rosada and syntopic yellow forms and that the rosada
is basal to extant taxonomically recognized Galápagos land igua-
nas. The rosada, whose present distribution is a conundrum, is a
relict lineage whose origin dates back to a period when at least
some of the present-day islands had not yet formed. So far, this
species is the only evidence of ancient diversification along the
Galápagos land iguana lineage and documents one of the oldest
events of divergence ever recorded in the Galápagos. Conservation
efforts are needed to prevent this form, identified by us as a good
species, from extinction.
Fig. 1. Galápagos Islands. The islands where land iguanas occur or have
occurred in historic times are in gray. The locations of sampling sites are
genetic isolation 兩 molecular phylogeny 兩 evolution 兩 islands 兩 lizards reported in Materials and Methods.
S ince Darwin’s pioneering work in the archipelago, the
Galápagos Islands have been a major scientific resource for
evolutionary biologists. This archipelago, currently consisting of
Earlier genetic studies suggest that the split of the marine and
land iguana lineages could have occurred as late as 10.5 million
about a dozen volcanic islands and more than 100 associated years ago, when the archipelago did not have the current
islets, is located on the equator, about 1,000 kilometers west of configuration and none of the present islands had yet emerged.
the South-American coast (Fig. 1). Given their volcanic origin, Such studies also suggested that the present pattern of diversi-
the Galápagos Islands host unique flora and fauna that have fication of land iguanas originated recently, during the Pleisto-
evolved over millions of years in geographic isolation, generating cene Epoch (6). However, no previous studies included the
a variety of endemic species with unique and varied ecological, rosada form. Here, we address its genetic distinctiveness and
morphological, and behavioral adaptations (1, 2). taxonomic status by means of mtDNA sequencing and micro-
Land iguanas are among the most spectacular representative satellite genotyping.
species of the Galápagos Islands. They once lived in many areas
of the Galápagos archipelago (Fig. 1). Currently, many factors Results
contribute to their threatened status (3), one of which may be Phylogenetic Relationships and Genetic Divergence. Combined
incomplete taxonomy (4). Two species of Galápagos land igua- (Pincongruence length difference (ILD) test ⫽ 0.17) and separate phylo-
nas are currently recognized: Conolophus pallidus and Conolo- genetic analyses of the mitochondrial control region (CR) and
phus subcristatus, with the former occurring only on Santa Fe, cytochrome b (cytb) data sets as well as parsimony, maximum
whereas C. subcristatus occurs on Fernandina, Isabela, Santa likelihood (ML), and Bayesian methods of inference produced
Cruz, Plaza Sur, Seymour Norte (a translocated population), and very similar results. Eight nodes (Fig. 3 A–H) within the
Baltra.
Charles Darwin visited the Galápagos in 1835. During the 5
Author contributions: G.G. designed research; G.G., A.F., C.M., H.L.S., H.M.S., W.T., and V.S.
weeks of his stay in the archipelago, he did not explore Volcan
EVOLUTION
performed research; G.G. and A.F. analyzed data; and G.G. wrote the paper.
Wolf (the northernmost volcano in Isabela). Thus, although he
The authors declare no conflict of interest.
noticed and commented on both marine and land iguanas (5), he
This article is a PNAS Direct Submission.
did not encounter a distinct form of land iguana that occurs only
on that volcano. Perhaps even more surprising, this form (herein Data deposition: The sequences reported in this paper have been deposited in the GenBank
database [accession nos. FJ536155–FJ536164 (CR) and FJ536145–FJ536154 (cytb) for Am-
referred to as ‘‘rosada,’’† meaning ‘‘pink’’ in Spanish) remained blyrhynchus and FJ536004 –FJ536144 (CR) and FJ535863–FJ536003 (cytb) for Conolophus].
unrecorded despite many other scientists having visited Volcan 1To whom correspondence should be addressed. E-mail: gabriele.gentile@uniroma2.it.
Wolf over the past century. Since it was accidentally seen by †This paper and the name ‘‘rosada’’ used herein are disclaimed for nomenclatural purpose
some Galápagos National Park rangers in 1986, this form has [Articles 8.2, 8.3 in ICZN International Code of Zoological Nomenclature. Fourth Edition
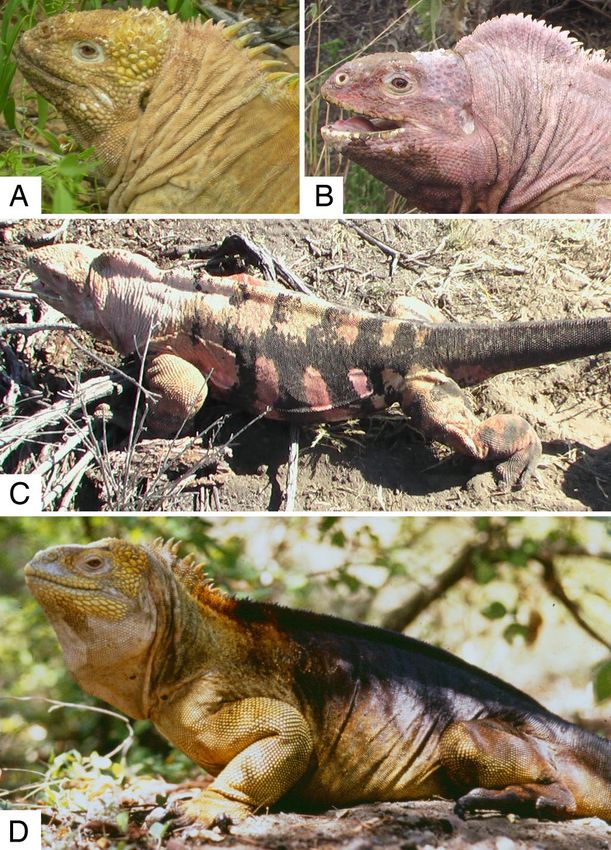
received no attention. The rosada form is characterized by a (ITZN, Padova, 1999)]. We postpone a formal description.
distinct phenotype (Fig. 2). It can be clearly distinguished from This article contains supporting information online at www.pnas.org/cgi/content/full/
Downloaded by guest on April 19, 2021
the syntopic yellow form (C. subcristatus) by evident idiosyncra- 0806339106/DCSupplemental.
sies in morphology and color. © 2009 by The National Academy of Sciences of the USA
www.pnas.org兾cgi兾doi兾10.1073兾pnas.0806339106 PNAS 兩 January 13, 2009 兩 vol. 106 兩 no. 2 兩 507–511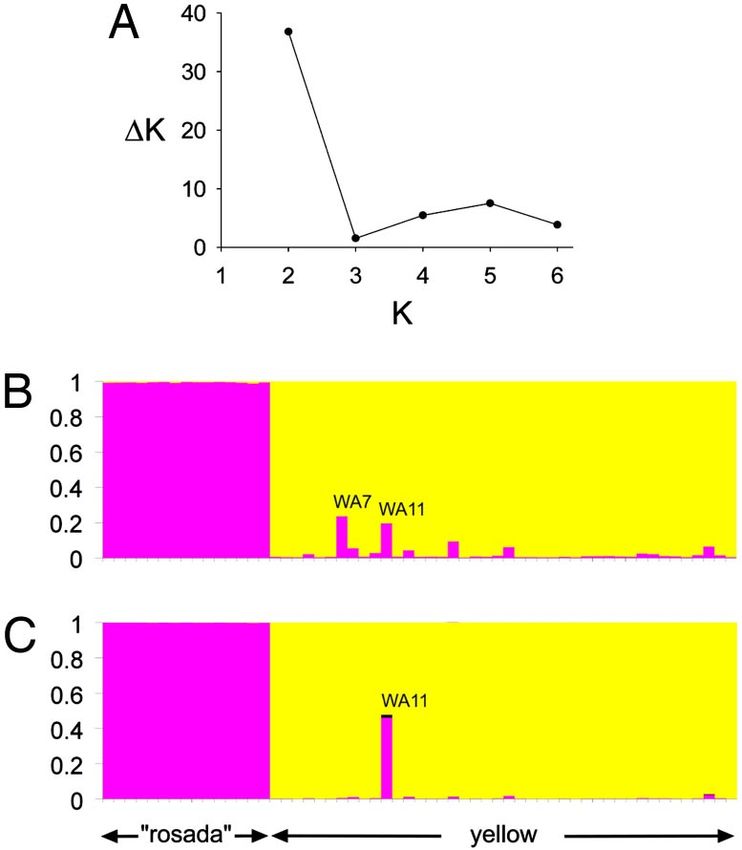
Fig. 3. ML phylogenetic tree. The tree is rooted at the midpoint. The
                                                                                                                     branches subtending the node A and the genus Amblyrhynchus have been
                                                                                                                     equally shortened. The asterisk denotes a terminal node. Numbers at the
                                                                                                                     nodes indicate statistical support as follows (from top): MP, ML, Bayesian
                                                                                                                     analysis. For MP and ML, only bootstrap values higher than 70 are shown. For
                                                                                                                     Bayesian analysis numbers indicate posterior probability values. The number
                                                                                                                     of individuals examined is reported inside each terminal triangle.

                                                                                                                     Microsatellite Structure and Variation. The first STRUCTURE
                                                                                                                     analysis indicated K ⫽ 2 as the most appropriate number of
                                                                                                                     clusters (Fig. 4A). The MICRO-CHECKER analysis performed
                                                                                                                     on the 2 clusters did not indicate scoring error attributable to
                                        Fig. 2. Adult male iguanas of the yellow (A, Sierra Negra; D, Volcan Wolf)   stuttering or allele dropout. Only locus CS8 showed evidence of
                                        and rosada (B and C, Volcan Wolf) forms (photograph by G.G.)
                                                                                                                     null alleles in the second cluster (P ⬍ 0.001). All rosada
                                                                                                                     individuals were included in the first cluster (rosada group) with
                                        Conolophus clade were strongly supported. Strikingly, the                    q ⫽ ⬎0.99. All yellow individuals were assigned to the second
                                        primary split was between the rosada form and all other
                                        populations. Not surprisingly, the populations of (i) Santa Fe,
                                        (ii) the central islands (Baltra, Santa Cruz, and Plaza Sur), and
                                        (iii) the western islands (Fernandina and Isabela) each formed
                                        a monophyletic group. All topologies alternative to positioning
                                        rosada at the base of the Conolophus tree were rejected, with
                                        PShimodaira-Hasegawa (S-H) test ranging from 0.004 to ⬍⬍0.001. On
                                        the other hand, the S-H test accepted the alternative hypoth-
                                        eses: (i) Santa Fe (central islands, western islands): P ⫽ 0.444
                                        and (ii) (Santa Fe, central islands) western islands: P ⫽ 0.434.
                                           On average, ML average genetic distances among populations
                                        within the central islands group and within the western islands
                                        group (excluding the rosada form) were 0.0026 ⫾ 0.0011 (SD)
                                        and 0.0044 ⫾ 0.0023, respectively. Higher values were observed
                                        between the 2 groups (0.0148 ⫾ 0.0008). The ML average genetic
                                        distance between C. pallidus and C. subcristatus was 0.0177 ⫾
                                        0.0006. The 15 rosada individuals were identical, and their ML
                                        average genetic distance from the rest of the land iguanas was
                                        0.0741 ⫾ 0.0018. The ML average genetic distance between
                                        Amblyrhynchus and Conolophus was 0.2576 ⫾ 0.0038.
                                           The recombination detection program (RDP3) analysis did not
                                        provide any evidence of mtDNA recombination between marine and
                                        land iguanas, including the rosada form (all tests were not significant
                                                                                                                     Fig. 4. STRUCTURE analyses. (A) ⌬K values are shown for K ranging between
                                        with P set at 0.05 and Bonferroni correction).                               2 and 6. Maximum value is observed when K ⫽ 2. (B) Results after the first
                                           Our estimate of the divergence time for the basal split between           analysis indicate individuals WA7 and WA11 (yellow morphotypes) as possible
Downloaded by guest on April 19, 2021

                                        the rosada and the rest of land iguana lineages (Fig. 3, node A)             hybrids. The second analysis, which was more refined, indicates WA11 as a
                                        was ⬇5.70 million years (⫾1.32, SD).                                         possible second-generation hybrid (see text).

                                        508 兩 www.pnas.org兾cgi兾doi兾10.1073兾pnas.0806339106                                                                                           Gentile et al.
cluster (yellow group) with an average q ⫽ 0.97 (0.05, SD). Two surprising, considering that hybridization can still occur between
yellow individuals assigned to the yellow cluster, WA7 and marine and land iguanas (13), 2 genera morphologically, eco-
WA11, exhibited q values equal to 0.76 and 0.80, respectively logically, behaviorally, and genetically very distant.
(Fig. 4B). The mtDNA haplotype of the rosada is highly differentiated
The second set of STRUCTURE analyses confirmed the from those of marine iguanas and the rest of land iguanas. The
assignment of the individual WA7 to the yellow group (q ranging results of the RDP3 analyses allow us to reject the hypothesis that
from 0.87 to 0.95, depending on values used), whereas the such differentiation might have occurred by mtDNA recombi-
individual WA11 showed mixed ancestry with a substantial pro- nation after hybridization between land and marine forms. The
portion of genes derived from a rosada grandparent (q ranging from hypothesis of the origin of the rosada by recent hybridization
0.87 to 0.46, depending on values used; Fig. 4C). alone between the 2 forms is not supported either. In fact, a
Evidence for linkage disequilibrium between loci CS5 and CS9 rosada-like haplotype is not found in our sample of yellow
(P ⬍ 0.05, after Bonferroni correction) was found only for the iguanas, or in marine iguanas. This is indicated by a phylogenetic
yellow group. This group also showed deviation from Hard- analysis that we performed by combining original haplotypes
Weinberg Equilibrium (HWE) at locus CS9 attributable to from the present study with those found by Rassmann et al. (6)
heterozygosity deficiency (P ⬍ 0.05). The two clusters showed in their sample of 150 marine iguanas from 21 locations on 14
FST ⫽ 0.25 (P ⬍⬍ 0.001). The genetic differentiation was islands [see supporting information (SI)].
confirmed using the stepwise mutation model (RhoST ⫽ 0.93, In addition to the taxonomic implications, this form, which we
P ⬍⬍ 0.001), and a comparison between FST and RhoST showed recognize as a good species, is very important because it carries
a significant role for allele size in determining the level of substantial evolutionary legacy, being basal to all other land
population differentiation (P ⬍⬍ 0.001). iguana remnant populations. Thus far, the rosada form is the
The levels of variation differed between the 2 groups, with an only evidence of deep diversification along the Galápagos land
observed heterozygosity (HO) value of 0.67 for the yellow group iguana lineage. No analogous evidence has been found in marine
and 0.38 for the rosada group. Similarly, average allelic richness iguanas so far.
was 6.29 (⫾2.46) and 3.78 (⫾2.22) in the groups of yellow and These findings call for a conservation program aimed at
rosada clusters, respectively. Private alleles (i.e., alleles whose evaluating the risk of extinction of this newly recognized species,
occurrence is restricted to only 1 group of individuals) consti- which, based on currently available data, would be assignable to
tuted 74% of all alleles. Thirteen and 47 private alleles were the ‘‘critically endangered’’ category by meeting criteria B and C
observed in the rosada and yellow groups, respectively. of the International Union for Conservation of Nature (IUCN)
Red List (14).
Discussion
The most surprising result was the deep divergence of the rosada Materials and Methods
lineage at the basis of the Conolophus clade. This species alters Sampling. The reader is referred to Fig. 1 for the location of sampling sites. For
the current thinking about the timing of diversification of land mtDNA analysis, samples were collected as follows (the number of individuals
iguanas, which was previously supposed to have occurred in the sampled is in square brackets): C. subcristatus: (1) Roca Limba [5], (2) Cueva
Pleistocene Epoch (6). Although with a large SD, our estimate Norte [9], (3) Puerto Bravo [27], (4) Piedras Blanca [31], (5) Caleta Tagus [6], (6)
sets the origin of this relict lineage back to a period when at least Bahia Urbina [10], (7) Bahia Elizabeth [5], (8) Bahia Cartago [8], (9) Villamil [2],
some of the present-day islands had not yet formed. In fact, the (10) Seymour Norte [3], (11) Baltra [8], (12) Cerro Dragón [4], (13) Venecia [7],
oldest extant islands in the archipelago, San Cristóbal and and (14) Plaza Sur [10]; C. pallidus: (15) Santa Fe [6]; and Amblyrhynchus
cristatus: (14) Plaza Sur [5] and (16) P.ta Albemarle [5]. For microsatellite DNA,
Española, are at least 2.35 and 3.3 million years old, respectively,
samples were collected at Volcan Wolf at sites (3) Puerto Bravo [29] and (4)
if not older (7). Thus, given its present distribution, the rosada Piedras Blanca [28]. Of these, 15 individuals (11 male and 4 female) were of the
form clearly represents a conundrum because it occurs only on rosada form.
Volcan Wolf, which is considered younger than Volcan Sierra
Negra (0.53 million years, the oldest volcano of Isabela) (8) and Blood Drawing and DNA Extraction. Blood (⬇1 mL) was drawn from the caudal
almost as old as Volcan Cerro Azul (0.35 million years) (9). or brachial vein and preserved in 5 mL of lysis buffer (100 mM Tris, 100 mM
The ML average genetic distance between C. subcristatus and EDTA, 2% mg/mL SDS). DNA was extracted using the QIAamp DNA Mini Kit
C. pallidus is much lower than between the rosada form and each (Qiagen).
of the 2 named species, supporting the distinctiveness of the
taxon. Our preliminary data on the morphology of the rosada mtDNA Amplification. We used the primer pair 12S1984-CB437LD (15) to
and yellow forms also indicate differentiation: in addition to amplify by PCR a 1,126-bp fragment of the CR positions 1370 –2495 in GenBank
their color pattern and independent of their gender, all rosada sequence AY948121. PCR conditions were as described in ref. 14. The primers
TGLU14121 (5⬘-CCGAAAAATCCACCTTGTTATTCAAC-3⬘) and TTHRREV (5⬘-
individuals investigated are distinguished from the other 2
GGGGGTGGTTTAATTCCCAGC-3⬘) were developed and used to amplify by PCR
species by flat dorsal head scales and the prominent adipose a 1,200-bp fragment that includes the whole cytb gene and small fragments
nuchal crest with small conic scales. The rosada also shows strong of the tRNAs for glutamic acid and threonine. Sequences were run on an ABI
differences in the pattern of the ‘‘head-bob’’ (nodding), a PRISM 3100 (Applied Biosystems) automated sequencer. Conditions for the
behavior important in territoriality (10) and courtship (11). PCR amplification of the cytb gene are available as supplementary data.
EVOLUTION
The microsatellite data also indicated strong differentiation Sequences were edited with SEQUENCHER 4.1.2 (Gene Codes). The alignment
between the rosada and yellow forms, with mutation and genetic obtained by using CLUSTAL X (16) was checked by eye. The final data set
drift (in particular for the rosada form) being important deter- consists of 1118 bp of CR and 1113 bp of cytb.
minants. A similar magnitude of microsatellite differentiation
was observed among C. subcristatus populations from other Phylogenetic Analyses. Phylogeny inference was performed using the CR and
islands (12). Although the 2 forms still share 26% of alleles, none the cytb data sets both separately and combined. We tested for phylogenetic
incongruence of CR and cytb by performing the ILD test (17), after removing
of the rosada individuals investigated incorporated genes from
the invariant characters (18). Analyses were conducted using maximum par-
the syntopic yellow iguanas, at least in the past 2 generations, and simony (MP) (19), ML (20), and Bayesian inference (21), as implemented in
only 1 yellow individual shows possible mixed ancestry with a PAUP* 4.0b10 (22), TREEFINDER 2006 (23), and MRBAYES 3.1.2 (24), respec-
rosada grandparent. Thus, introgressive hybridization appears to tively. MP heuristic parameters were as follows: starting trees obtained by
be rare and not sufficiently strong to have prevented genetic random-addition (10 replicates) and Tree Bisection and Reconnection (TBR)
Downloaded by guest on April 19, 2021
differentiation. In any case, incomplete reproductive isolation branch swapping. Gaps in the CR were coded as unordered characters at the
between the rosada and syntopic yellow land forms is not end of the data matrix (contiguous gaps were treated as 1 single gap). ML trees
Gentile et al. PNAS 兩 January 13, 2009 兩 vol. 106 兩 no. 2 兩 509were sought via a genetic algorithm, by which method they were less prone vs. rosada) as prior population information. This was aimed to infer the
to get trapped in local optima (25). Different models were used for the CR and ancestry of all individuals that, from the previous run, could potentially have
the cytb data. MODELTEST 3.7 (26) was used to select the HKY85⫹⌫ (Ti/Tv mixed ancestry. In this run, we used a model that accounted for the occurrence
rate ⫽ 2.464, ␣ ⫽ 0.161) for the CR. The GTR⫹⌫ model was instead used for the of null alleles (39), as the MICRO-CHECKER analysis suggested. Aware of the
cytb, with all parameters estimated separately for the first, second, and third resolution limit of the number of loci used (40, 41), we set the parameter
positions. The same models were used in the Bayesian analysis. Gaps were GENSBACK ⫽ 2 to investigate the hypothesis that each individual belongs to
recoded as binary data and considered as a separate partition to which a the alternative phenotype or has 1 parent or grandparent with the alternative
binary (restriction) model of evolution was applied as implemented in MR- phenotype. To test for sensitivity of the data to (in our case, the probability
BAYES. For each partition, parameters’ values were estimated during the that an individual may be misclassified or has mixed ancestry within the past
search. The first, second, and third positions of the cytb were treated as 2 generations), we conducted 3 runs by setting the parameter MIGRPRIOR ⫽
separate partitions. Such partitioned analyses were aimed at modeling the 0.1, 0.05, and 0.01, as suggested by Pritchard et al. (37). For all STRUCTURE
data more accurately to reduce systematic errors that could mislead phyloge- analyses, membership coefficients (q) were calculated using 1.0 ⫻ 106 repe-
netic analyses (27, 28). For MP and ML, nodal support was tested by boot- titions of a Markov chain Monte Carlo simulation, after an initial ‘‘burnin’’ of
strapping (29), with 1,000 pseudoreplicates. A. cristatus, the sister taxon of 5.0 ⫻ 105 repetitions. Tests for significant deviations from HWE and genotyp-
Conolophus (30), was used as an outgroup within the Iguaninae group. ing disequilibrium were performed as implemented in GENEPOP 3.3 (42). The
Alternative tree topologies were investigated using the S-H test (31). We level of polymorphism was measured as the mean number of alleles per locus
estimated times of divergence using a nonparametric approach, as imple- and both HO and expected heterozygosity, respectively, using the program
mented in R8S 1.70 (ref. 32; see SI for details). GENETIX 4.05 (43). Because the observed number of alleles in a sample is
Tip-to-tip distances along the ML tree were averaged to calculate ML dependent on sample size, allelic richness was also estimated with the pro-
average genetic distances between populations within and between each gram FSTAT 2.9.3 (44). Population differentiation was investigated taking into
group resulting from the phylogenetic analysis. consideration both the infinite and stepwise mutation models. Assuming an
infinite mutation model, the Wright’s fixation index FST was assessed by the
Recombination Analysis. We tested for possible mtDNA recombination be- estimator with the program FSTAT 2.9.3. The estimator RhoST of the RST
tween Amblyrhynchus and Conolophus by applying the following methods: (i) statistic, which is based on a stepwise mutation model, was calculated using
RDP (33), (ii) GENECONV (34), and (iii) CHIMAERA (35), as implemented in RDP3 the program RSTCALC (45). To determine whether stepwise-like mutations
(ref. 33; see SI for details). contributed to genetic differentiation, we performed a statistical test based
on randomization of allele size (46). The test, implemented in the program
Microsatellite Characterization. The extracted DNA was genotyped at 9 mic- SPAGeDi (47), can be interpreted as testing whether FST ⫽ RhoST. In case of tests
rosatellite loci as in Tzika et al. (12). with multiple comparisons, the sequential method of Holm (48), also known
as ‘‘sequential Bonferroni,’’ was applied as implemented in the MULTIPLICITY
Microsatellite Structure and Variation. MICRO-CHECKER 2.2.3 (36) was used to PROGRAM 2 (49).
check for possible typing errors, null alleles, large allele dropout, and errors
attributable to stutter peaks. Population structure and individual assignment ACKNOWLEDGMENTS. We thank the Parque Nacional Galápagos and the
were performed using a Bayesian method implemented in STRUCTURE 2.2 Charles Darwin Research Station, G. dell’Omo, S. Rosa, R. Palozzi, M. Cruz, and
(37). We first performed a STRUCTURE analysis to assess the number of groups all the people who supported this study in the collection of samples. We
acknowledge D. Tautz, K. Rassmann, and A. Caccone for making their samples
(K). We used a model that assumed admixture and uncorrelated allele fre-
available for our study. We thank to A. Caccone and M. Milinkovitch for their
quencies and used no prior population information. The K value that maxi- criticism on an early version of this paper. Samples were collected under CITES
mized the statistic ⌬K (38) was chosen as the optimal K value. Based on the permits IT/IM/2003/MCE/02328, IT/IM/2004/MCE/00041, and IT/IM/2005/MCE/
assignment obtained, once the K value was assessed, we reran STRUCTURE 01819 granted to the first author. This work was supported by the Italian
using the number of distinct clusters and the phenotype of individuals (yellow Ministry of Education, University, and Research (MIUR), with a grant to G.G.
1. Darwin C (1859) The Origin of Species by Means of Natural Selection (John Murray, 16. Thompson JD, Gibson TJ, Plewniak F, Jeanmougin F, Higgins DG (1997) The CLUSTAL㛭X
London). windows interface: Flexible strategies for multiple sequence alignment aided by
2. Bowman RI (1983) Patterns of Evolution in Galápagos Organisms, eds Bowman RI, quality analysis tools. Nucleic Acids Res 24:4876 – 4882.
Berson M, Leviton AE (American Association for the Advancement of Science, Pacific 17. Farris JS, Kallersjo M, Kluge AG, Bult C (1994) Testing significance of incongruence.
Division, San Francisco), pp 237–537. Cladistics 10:315–319.
3. Snell, HL Snell MH, Tracy CR (1984) Variation among populations of Galápagos land 18. Cunningham CW (1997) Can three incongruence tests predict when data should be
iguanas (Conolophus)—Contrasts of phylogeny and ecology. Biol J Linn Soc 21:185– combined? Mol Biol Evol 14:733–740.
207. 19. Farris JS (1970) Methods for computing Wagner trees. Syst Zool 18:374 –385.
4. Daugherty C, Cree A, Hay JM, Thompson MB (1990) Neglected taxonomy and contin- 20. Felsenstein J (1981) Evolutionary trees from DNA sequences: A maximum likelihood
ued extinctions in Tuatara. Nature 347:177–178. approach. J Mol Evol 17:368 –376.
5. Darwin C (1950) The Voyage of the Beagle (Dutton, New York). 21. Bayes T (1763/1958) Studies in the history of probability and statistics: IX. Thomas
6. Rassmann K, Markmann M, Trillmich F, Tautz D (2004) Iguanas, Biology and Conser- Bayes’s essay towards solving a problem in the doctrine of chances. Biometrika 45:296 –
vation, eds Alberts AC, Carter RL, Hayes WK, Martins EP (Univ California Press, Berke- 315.
ley), pp 71– 83. 22. Swofford DL (2002) PAUP*. Phylogenetic Analysis Using Parsimony (* and Other
7. White WM, McBirney AR, Duncan RA (1993) Petrology and geochemistry of the Methods), Version 4 (Sinauer Associates, Sunderland, MA).
Galápagos Islands: Portrait of a pathological mantle plume. J Geophys Res-Solid Earth 23. Jobb G (2006) TREEFINDER, Version of May 2006 (Munich, Germany). Distributed by the
98:533–563. author at www.treefinder.de. Accessed May 2006.
8. Nordlie BE (1973) Morphology and structure of the western Galápagos volcanoes and 24. Ronquist F, Huelsenbeck JP (2005) Statistical Methods in Molecular Evolution, ed
a model for their origin. Geol Soc Am Bull 84:2931–2956. Nielsen R (Springer, New York), pp 183–233.
9. Naumann T, Geist D (2000) Physical volcanology and structural development of Cerro 25. Jobb G, von Haeseler A, Strimmer K (2004) TREEFINDER: A powerful graphical analysis
Azul Volcano, Isabela Island, Galápagos: Implications for the development of Galápa- environment for molecular phylogenetics. BMC Evol Biol 4:18 doi:10.1186/1471–2148-
gos-type shield volcanoes. Bull Volcanol 61:497–514. 4 –18.
10. Carpenter CC (1969) Behavioral and ecological notes on the Galápagos land iguanas. 26. Posada D, Crandall KA (1998) MODELTEST: Testing the model of DNA substitution.
Herpetologica 25:155–164. Bioinformatics 14:817– 818.
11. Christian KA, Tracy CR (1982) Iguanas of the World, eds Burghardt GM, Rand AS (Noyes 27. Reeder TW (2003) A phylogeny of the Australian Sphenomorphus group (Scincidae:
Publications, Park Ridge, NJ), pp 366 –379. Squamata) and the phylogenetic placement of the crocodile skinks (Tribolonotus):
12. Tzika AC, et al. (2008) Population genetics of Galápagos land iguana (genus Conolo- Bayesian approaches to assessing congruence and obtaining confidence in maximum
phus) remnant populations. Mol Ecol 17:4943– 4952. likelihood inferred relationships. Mol Phylogenet Evol 27:384 –397.
13. Rassmann K, Trillmich F, Tautz D (1997) Hybridization between the Galapagos land and 28. Brandley MC, Schmitz A, Reeder TW (2005) Partitioned Bayesian analyses, partition
marine iguana (Conolophus subcristatus and Amblyrhynchus cristatus) on Plaza Sur. J choice, and the phylogenetic relationships of scincid lizards. Syst Biol 54:373–390.
Zool Lond 242:729 –739. 29. Felsenstein J (1985) Confidence limits on phylogenies: An approach using the boot-
14. International Union for Conservation of Nature (2001) IUCN Red List Categories and strap. Evolution 39:783–791.
Criteria, Version 3.1 (IUCN Species Survival Commission) (IUCN, Gland, Switzerland) 30. Wiens JJ, Hollingsworth BD (2000) War of the iguanas: Conflicting molecular and
http://www.iucnredlist.org/info/categories㛭criteria2001). Accessed June 2008. morphological phylogenies and long-branch attraction in iguanid lizards. Syst Biol
15. Hanley TC, Caccone A (2005) Development of primers for the characterization of the 49:143–159.
Downloaded by guest on April 19, 2021
mitochondrial control region of Galápagos land and marine iguanas (Conolophus and 31. Shimodaira H, Hasegawa M (1999) Multiple comparisons of log-likelihoods with
Amblyrhynchus). Mol Ecol Notes 5:599 – 601. applications to phylogenetic inference. Mol Biol Evol 16:1114 –1116.
510 兩 www.pnas.org兾cgi兾doi兾10.1073兾pnas.0806339106 Gentile et al.32. Sanderson MJ (2002) Estimating absolute rates of molecular evolution and divergence 41. Vähä JP, Primmer CR (2006) Efficiency of model-based Bayesian methods for detecting
times: A penalized likelihood approach. Mol Biol Evol 19:101–109. hybrid individuals under different hybridization scenarios and with different numbers
33. Martin DP, Williamson C, Posada D (2005) RPD2: Recombination detection and analysis of loci. Mol Ecol 15:63–72.
from sequence alignments. Bioinformatics 21:260 –262. 42. Raymond M, Rousset F (1995) An exact test for population differentiations. Evolution
34. Padidam M, Sawyer S, Fauquet CM (1999) Possible emergence of new geminiviruses by 49:1280 –1283.
frequent recombination. Virology 265:218 –225. 43. Belkhir K, Borsa P, Chikhi L, Raufaste N, Catch F (2004) Laboratoire Génome, Popula-
35. Posada D, Crandall KA (2001) Evaluation of methods for detecting recombination from tions, Interactions CNRS UMR 5000 (Univ de Montpellier II, Montpellier, France).
DNA sequences: Computer simulation. Proc Natl Acad Sci USA 98:13757–13762. 44. Goudet J (1995) Fstat version 1.2: A computer program to calculate F-statistics. J Hered
36. Van Oosterhout C, Hutchinson WF, Derek PM, Wills DPM, Shipley P (2004) MICRO- 86:485– 486.
CHECKER: Software for identifying and correcting genotyping errors in microsatellite 45. Goodman SJ (1997) RSTCalc: A collection of computer programs for calculating esti-
data. Mol Ecol Notes 4:535–538. mates of genetic differentiations from microsatellite data and determining their
37. Pritchard JK, Stephens M, Donnelly P (2000) Inference of population structure using significance. Mol Ecol 6:881– 885.
multilocus genotype data. Genetics 55:945–959. 46. Hardy OJ, Charbonnel N, Fréville H, Heuertz M (2003) Microsatellite allele sizes: A simple
38. Evanno G, Regnaut S, Goudet J (2005) Detecting the number of clusters of individuals test to assess their significance on genetic differentiation. Genetics 163:1467–1482.
using the software STRUCTURE: A simulation study. Mol Ecol 14:2611–2620. 47. Hardy OJ, Vekemans X (2002) SPAGeDi: A versatile computer program to analyse
39. Falush D, Stephens M, Pritchard JK (2007) Inference of population structure using mul- spatial genetic structure at the individual or population levels. Mol Ecol Notes 2:618 –
tilocus genotype data: Dominant markers and null alleles. Mol Ecol Notes 7:574 –578. 620.
40. Boecklen WJ, Howard DJ (1997) Genetic analysis of hybrid zones: Numbers of markers 48. Holm S (1979) A simple sequentially rejective multiple test procedure. Scand J Stat 6:65–70.
and power of resolution. Ecology 78:2611–2616. 49. Brown BW, Russell K (1996) Multiplicity Program (Univ of Texas, Houston).
EVOLUTION
Downloaded by guest on April 19, 2021
Gentile et al. PNAS 兩 January 13, 2009 兩 vol. 106 兩 no. 2 兩 511You can also read