Analysis of Climate Elements in Central and Western Istria for the Purpose of Determining Irrigation Requirements of Agricultural Crops
←
→
Page content transcription
If your browser does not render page correctly, please read the page content below
ORIGINAL SCIENTIFIC PAPER                                                                           | 225

                Analysis of Climate Elements in Central
                and Western Istria for the Purpose of
                Determining Irrigation Requirements of
                Agricultural Crops
Ivan ŠIMUNIĆ1 (✉)
Tanja LIKSO2
Stjepan HUSNJAK3
Marina BUBALO KOVAČIĆ1

            Summary

                A consequence of climate changes is an increasing frequency of drought, which on average
            occurs in Croatia every third to fifth year and during the vegetation period it can reduce crop
            yield significantly. The aim of the research is both to determine crop water requirements in
            an average and in a dry year and to determine the decline in crop yields in an average and in
            a dry year. The multi-annual climate data series for a 30-year period, 1981-2010 from station
            Pazin in central Istria and 1981-2010 from Poreč in western Istria was used. Based on these
            data, a reference evapotranspiration was calculated for an average and a dry year using the
            Penman-Monteith method through "Cropwat" software. The crop water requirement for five
            different crops is determined by soil water balance using the Palmer method (Palmer, 1965),
            corrected according to Širić and Vidaček (1988), using "Hidrokalk" software. Crop response
            to the lack of soil water and yield decline were determined according to the method published
            by Doorenbos and Kassam (1979). Correlation test was used to determine correlation
            between precipitation and crop yields. In central Istria, water shortage in an average year
            ranged from 3.4 mm (olives) to 110.7 mm (alfalfa) and yield decline ranged from 1.1%
            (olives) to 18.6% (alfalfa), while in a dry year water shortage ranged from 43.2 mm (olives)
            to 229.5 mm (alfalfa) and ranged from 10.3% (olives) to 37.7% (alfalfa). In western Istria, in
            an average year water shortage ranged from 35.5 mm (olives) to 239.7 mm (alfalfa) and yield
            decline ranged from 7% (olives) to 40.2% (tomatoes), and in a dry year water shortage ranged
            from 74.4 mm (olives) to 288.9 mm (alfalfa) and yield decline ranged from 14.4% (olives) to
            40.7% (alfalfa). The determined water shortage and reduced yields are sufficient indicators of
            irrigation requirements in Istria.

            Key words

            climate elements, central and western Istria, agricultural crops, irrigation

            1
                University of Zagreb, Faculty of Agriculture, Department of Amelioration, Svetošimunska cesta 25,
                Zagreb, Croatia
            2
                Meteorological and Hydrological Service, Ravnice 48, Zagreb, Croatia
            3
                University of Zagreb, Faculty of Agriculture, Department of Soil Science, Svetošimunska cesta 25,
                Zagreb, Croatia

            ✉ Corresponding author: simunic@agr.hr

            Received: December 21, 2020 | Accepted: September 22, 2021

            a  CS
            Agric. conspec. sci. Vol. 86 (2021) No. 3 (225-233)
226 | Ivan ŠIMUNIĆ, Tanja LIKSO, Stjepan HUSNJAK, Marina BUBALO KOVAČIĆ
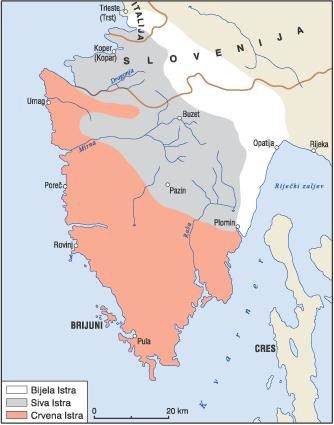
Introduction USDA, SCS method. The values of soil water constants for each
area were taken into account as the average of the values of the
Over the last decades, climate change is a burning issue and most represented soil type, red soil ‒ terra rossa (Husnjak, 2014),
a major world problem and therefore solutions are being sought as shown in Figure 1. The soil studied in central Istria had the
to mitigate / prevent its consequences. Climate change can following characteristics: field water capacity was 42 vol% and
be represented as a change in climate elements (temperature, wilting point was 19 vol%, while in western Istria the value of field
precipitation, humidity, wind, insolation) relative to average values water capacity was 45 vol% and wilting point was 21 vol%. Crop
or as a change in the distribution of climate events relative to water requirements and yield decline were related to five crops:
average values. Climate change causes more frequent occurrences tomatoes, cabbage, alfalfa, vineyards and olives. The root depth
of floods and droughts, which can cause major damage to for the calculation of soil water balance was 30 cm (tomatoes,
agriculture and the environment. As a consequence of climate cabbage and alfalfa), 50 cm for the vineyard and 60 cm for olives.
change, the rise in frequency and intensity of extreme weather Concerning all the previously mentioned crops, the vegetation
events, such as drought, heavy rain and gales, among others, has period was considered and phenological phases and their duration
a negative impact on yields and their quality (Mađar et al., 1998; were determined. Each phenological phase was corrected by the
Fischer et al., 2005; Parry et al., 2005; Kovačević et al., 2013; Dokić crop coefficient.
et al, 2015).
Crop yield decline was determined according to the method
The yields of agricultural crops fluctuate over many years and published by Doorenbos and Kassam (1979).
are influenced by many abiotic and biotic factors. A large number
of studies indicate that crop yields primarily vary as a result of
extreme climate conditions, although other factors, such as soil (1)
fertility, the applied agro-technology and plant species may also Ya ‒ Actual yield
affect crop yields (Kovačević and Josipović, 2015; Tomić et al.,
2020). Ym ‒ Maximum possible yield
ky ‒ Yield response factor
Climate characteristics and soil water regime, as well as their
variable and complex interrelations, define the efficiency of plant ETa ‒ Actual evapotranspiration
production (Šimunić et al., 2007). According to Beltrão et al. ETc ‒ Crop (maximum) evapotranspiration.
(1996), the highest yields are obtained at the time of the most Correlation test was used to determine correlation between
favourable air-water ratio in the soil, mainly in the critical periods precipitation and crop yields.
for each crop.
Due to increasing frequency of droughts, varying intensity and
duration in Croatia, the project "Plan of Irrigation and Agricultural
Land Management in the Republic of Croatia" (Romić et al.,
2005) was adopted, which strives to define favourable conditions
for planned and less risky agricultural production. Within the
previously mentioned project, the planning and implementation
of irrigation in the area of Istria County was started and this
article is based on the results obtained from recent studies.
The specific objective of this research is to determine crop
water requirements in an average and in a dry year in central and
western Istria and to determine crop yield decline in those years.
Materials and methods
For the central part of Istria, the multi-annual climate
data series for a 30 ‒ year period (1981‒2010) from the main
meteorological station Pazin and for the western part of Istria,
the data series of the same length, but for the period (1986‒2015)
from climatological station Poreč was used. Based on the climate
data, a reference evapotranspiration was calculated for an average
and a dry year (probability of occurrence in 25% cases). The
reference evapotranspiration was calculated using the Penman‒
Monteith method through "Cropwat" software version 8.0. Crop
water requirement was determined by soil water balance using
the Palmer method (Palmer, 1965), corrected according to Širić
and Vidaček (1988), using "Hidrokalk" computer program and
its explanation is in text that follows. For soil water balance
calculation, the corresponding values of effective precipitation Figure 1. Geomorphological areas of the Istrian peninsula (Source:
for an average and a dry year were used, which was calculated by http://istra.lzmk.hr/clanak.aspx?id=957)
aCS
Agric. conspec. sci. Vol. 86 (2021) No. 3Analysis of Climate Elements in Central and Western Istria for the Purpose of Determining Irrigation Requirements of Agricultural Crops | 227
Results and discussion warming trend, with some inter‒annual variations. During a 30-
year period, positive air temperature trend is evident on both
Annual air temperature, annual precipitation amounts and meteorological stations located in central and western part of
corresponding trends for meteorological stations (MS) Pazin and Istria, which could be an indicator of climate change. According
Poreč are presented in Figures 2a, 2b, 3a and 3b. to Kutilek and Nielsen (2010), the average temperature increased
by 1.1-1.3oC in 100 years in Central Europe. The effects of climate
change have become increasingly evident over the past decades
(Patt and Schröter, 2008). Positive trends of air temperature and
precipitation amounts in their research have been quoted by
Šimunić et al. (2013 and 2019) and Miseckaite et al. (2018).
Figure 2a. Mean annual air temperature (°C), multi‒annual mean and
corresponding linear trend of mean annual air temperature for MS
Pazin
Figure 3a. Annual precipitation amount (mm), multi‒annual mean
(mm) and corresponding linear trend of annual precipitation amount
for MS Pazin
Figure 2b. Mean annual air temperature (oC), multi‒annual mean
(°C) and corresponding linear trend of mean annual air temperature
for MS Poreč
The precipitation regime is one of the most variable climate
characteristics of some area, both spatially and temporally
Figure 3b. Annual precipitation amount (mm), multi‒annual mean
(Croatian Meteorological and Hydrological Service and Croatian
(mm) and corresponding linear trend of annual precipitation amount
Meteorological Society, 2003). This can also be seen in the area of for MS Poreč
Pazin and Poreč.
During the observed period, at MS Pazin mean annual air Concerning MS Pazin, annual precipitation amounts were
temperatures ranged from 10.6°C to 12.6°C while multi‒annual within the range from 791.0 mm to 1642.0 mm, while multi‒
mean air temperature was 11.6°C. The corresponding linear annual mean of precipitation amounts was 1043.7 mm. Within
trend of mean annual air temperature is 2.67°C/100 yrs, which is the 30‒year period the difference between the maximum and the
evident from Figure 2a. During the analysed period (1986-2015) minimum value of annual precipitation amount was 851 mm.
at MS Poreč mean annual air temperatures ranged between 12.7°C On the other hand, for MS Poreč annual precipitation amounts
and 15.1°C. The multi‒annual mean air temperature was 13.8°C, were within the range from 549.7 mm to 1403.3 mm. The multi‒
higher than at MS Pazin. The corresponding mean annual air annual mean of annual precipitation amounts for MS Poreč was
temperature trend for MS Poreč is 5.3°C/100 yrs, which is shown 858.1 mm, which is comparable to the previously mentioned
in Figure 2b. The positive mean annual air temperature trend is mean for MS Pazin. During the analysed period for MS Poreč,
evident for both stations. The above mentioned indicates that the the difference between the maximum and the minimum value of
air temperature trend in Istria is in accordance with the global annual precipitation amounts was 853.6 mm.
aCS
Agric. conspec. sci. Vol. 86 (2021) No. 3228 | Ivan ŠIMUNIĆ, Tanja LIKSO, Stjepan HUSNJAK, Marina BUBALO KOVAČIĆ
As previously shown, the difference between the maximum
and the minimum value of annual precipitation amount for the
above-mentioned station is almost the same. There are some
differences in annual precipitation amounts from year to year,
which is described by the coefficient of variation. A greater
variability of annual precipitation amounts is obvious for MS
Poreč. In addition, MS Pazin and Poreč have positive trends
of annual precipitation amount, 624.1 mm/100 yrs and 442.0
mm/100 yrs, respectively. The trends of precipitation extremes in
Europe vary greatly and depend not only on the region, but also
on the indicator used to describe an extreme (Groisman et al.,
2005). Changes in precipitation are the prime drivers of change in
the availability of both surface water and groundwater resources
(Beare and Heaney, 2002). Changes in precipitation amount and
its distribution have direct influence on soil water content and
Figure 4a. Annual variation of the mean, the maximum and the min- affect crop cultivation.
imum values of monthly precipitation amounts. The multi‒annual
mean of annual precipitation amounts is 1043.7 mm, MS Pazin (1981-
2010) The relationship between reference evapotranspiration
and effective precipitation
The annual course of monthly precipitation amounts in Reference evapotranspiration that integrates the effects of
Croatia can be divided into two types (Zaninović et al., 2008), climate elements and indicates the overall evaporation has been
depending on the time of the year when the month with the lowest presented in Table 1a and 1b. In the same tables has been presented
precipitation amount occurs: the maritime type of annual course, and the relationship between reference evapotranspiration and
with the lowest precipitation amount occurring during the warm effective precipitation, both for multi‒annual mean and dry year.
period of the year (April to September), and the continental annual Tables 1a and 1b show that multi‒annual mean reference
course, with the lowest precipitation amount occurring during the evapotranspiration was 980.0 mm or 2.7 mm.day-1 and it
cold half of the year (October to March). The annual course of was higher than reference evapotranspiration based on the
monthly precipitation amount for MS Pazin has characteristics frequency of the occurrence of climate elements upon 25%
of continental precipitation regime (Figure 4a). The main precipitation probability, which was 918.1 mm or 2.5 mm.day-1.
maximum is in late autumn, in November (358.7 mm). The lowest Moreover, with a multi‒annual mean of climate elements, the
precipitation amount can be expected in February (141.0 mm). daily evapotranspiration is higher during the vegetation period
Monthly precipitation amounts can vary significantly from year to than in the year with the frequency of the occurrence of climate
year. The variability of monthly precipitation amounts (expressed elements upon 25% precipitation probability. In relation to
by the coefficient of variation) is large with the maximum in effective precipitation for the multi‒annual mean and reference
October (0.71) and the minimum in June (0.45). On the other evapotranspiration calculated on the basis of multi‒annual
hand, MS Poreč has the maritime type of the annual course of climate elements, Tables 1a and 1b shows that the difference in
monthly precipitation amount (Figure 4b) with the maximum water shortage is smaller than in effective precipitation at the
precipitation amount in October (279.4 mm) and the minimum frequency of occurrence in 25% of cases and reference evaporation
in April (126.3 mm). calculated on the basis of associated climatic elements. In both
cases, precipitation deficit occurs throughout the growing season.
The exact crop water deficit in the focus of this research can be
determined by the soil water balance.
Crop water requirements in average and dry years
Soil water balance determined crop water requirements and
water deficit in average and dry years for the central and western
part of Istria (Tables 2a and 2b).
As shown both in Table 2a and in 2b there was a difference in
soil water deficit in the central and in the western part of Istria.
A smaller deficit for all crops was recorded in the central part of
Istria, both in average and in dry years compared with the western
part of Istria. This can be related to the precipitation amount and
the average annual air temperature. The area of central Istria has
Figure 4b. Annual variation of the mean, the maximum and the min- a multi ‒ annual average of 1044 mm of precipitation, and the
imum values of monthly precipitation amounts. The multi‒annual western area 854 mm. Apart from the difference in precipitation
mean of annual precipitation amounts is 1043.7 mm, MS Poreč (1986- amount, there is also a difference in the average air temperature. In
2015) the central part of Istria, the average air temperature was 11.6°C,
aCS
Agric. conspec. sci. Vol. 86 (2021) No. 3Analysis of Climate Elements in Central and Western Istria for the Purpose of Determining Irrigation Requirements of Agricultural Crops | 229
Table 1a. Relationship between effective precipitations, multi‒annual mean and dry year and reference evapotranspiration based on multi‒annu-
al mean of climate elements and based on the frequency of the occurrence of climate elements upon 25% precipitation probability in the central
part of Istria (Pazin)
Multi‒annual mean (mm) Dry year (mm)
Month Difference Difference
Effective precipitation ETo Effective precipitation ETo
Jan 59.4 18.6 40.8 34.8 21.7 13.1
Feb 54.7 28.0 26.7 48.5 25.2 23.3
Mar 62.2 49.6 12.6 21.2 52.7 -31.5
Apr 70.7 72.0 -1.3 62.2 66.0 -3.8
May 70.2 102.3 -32.1 126.9 80.6 46.3
June 75.7 120.0 -44.3 65.2 117.0 -51.8
July 55.9 142.6 -86.7 35.7 142.6 -106.9
Aug 81.7 120.9 -39.2 47.7 127.1 -79.4
Sep 83.9 75.0 8.9 17.5 84.0 -66.5
Oct 92.4 46.5 45.9 73.4 46.5 26.9
Nov 98.8 27.0 71.8 150.4 27.0 123.4
Dec 85.3 21.7 63.6 26.7 21.7 5.0
Total 890.9 824.2 66.7 710.2 812.1 -101.9
Table 1b. Relationship between effective precipitations, multi‒annual mean and dry year and reference evapotranspiration based on multi‒annu-
al mean of climate elements and based on the frequency of the occurrence of climate elements upon 25% precipitation probability in the western
part of Istria (Poreč)
Multi‒annual mean (mm) Dry year (mm)
Month Difference Difference
Effective precipitation ETo Effective precipitation ETo
Jan 49.9 21.7 28.2 24.0 24.0 0.0
Feb 49.4 30.8 18.6 27.0 28.0 -1.0
Mar 45.7 58.9 -13.2 11.7 55.8 -44.1
Apr 54.4 81.0 -26.6 33.0 75.0 -42.0
May 58.7 117.8 -59.1 113.2 93.0 20.2
June 62.3 144.0 -81.7 62.8 132.0 -69.2
July 45.1 167.4 -122.3 20.9 158.1 -137.2
Aug 65.5 148.8 -83.3 68.0 145.7 -77.7
Sep 82.8 96.0 -13.2 20.9 99.0 -78.1
Oct 83.1 55.8 27.3 69.9 62.0 7.9
Nov 91.2 33.0 58.2 136.5 30.0 106.5
Dec 64.4 24.8 39.6 30.4 15.5 14.9
Total 752.5 980.0 -227.5 618.3 918.1 -299.8
aCS
Agric. conspec. sci. Vol. 86 (2021) No. 3230 | Ivan ŠIMUNIĆ, Tanja LIKSO, Stjepan HUSNJAK, Marina BUBALO KOVAČIĆ
and in the western part of Istria 13.8°C. The smallest water deficit The reaction of cultivation crops to water deficit and esti-
in average years in the central part of Istria was in case of olives mation of yield decline in average and dry years
(3.6 mm), and the highest in alfalfa (110.7 mm), while in dry
It is well-known that any soil water deficit causes some
years, water deficit oscillated from 43.2 mm (olives) up to 229.5
decrease in yields, depending on the lack of precipitation and the
mm (alfalfa). The smallest soil water deficit in average years in the
phase of crop development. The estimation of a decline in yields
western part of Istria was again in case of olives (35.5 mm) and the
both for the central and the western part of Istria has been shown
highest in alfalfa (239.7 mm). In dry years, water deficit fluctuated
in Tables 3a and 3b.
from the smallest value 74.4 mm (in olives) up to the highest
value from 288.9 mm (in alfalfa). As shown in the previously
mentioned tables, a higher soil water deficit has been determined Table 3a. Estimation of decreased yields (%) in the central part of
in shallow-rooted crops (tomatoes, cabbage and alfalfa) compared Istria (Pazin)
with deep-rooted crops (grape‒vine and olives). The explanation
for this is the fact that greatest changes in moisture occur in the Estimation of a decline in yield (%)
surface layer of soil and with depth the soil contains a greater Crop
Average years Dry years
reserve of moisture and therefore plants with deeper roots face
less stress during shorter dry periods. Soil water deficit affects the Tomatoes 18.1 34.4
growth and development of field crops, which affect their yield
and quality. Water deficit is especially harmful if it occurs in the Cabbage 14.3 26.9
“plant’s critical period of water need” (Tomić, 1988; Šimunić et al.,
2013). Hence, efficient agricultural production requires provision Alfalfa 18.6 37.7
of water through adequate irrigation system to compensate the
Grape‒vine 4.1 13.3
estimated water deficit for plant requirements.
Olives 1.1 10.3
Table 2a. Soil water deficit in the cultivation of crops both in average
years and in dry years in the central part of Istria (Pazin)
Table 3b. Estimation of decreased yields (%) in the western part of
Soil water deficit Istria (Poreč)
Crop
Average years (mm) Dry years (mm) Estimation of a decline in yield (%)
Crop
Tomatoes 63.2 191.9 Average years Dry years
Cabbage 64.5 191.2 Tomatoes 40.2 38.6
Alfalfa 110.7 229.5 Cabbage 32.7 30.5
Grape‒vine 16.4 105.0 Alfalfa 33.2 40.7
Olives 3.6 43.2 Grape‒vine 16.2 15.9
Olives 7.0 14.4
Table 2b. Soil water deficit in crop cultivation both in average years
and in dry years in the western part of Istria (Poreč) As evident from Table 3a and 3b there was a different decline
Soil water deficit in yields in average and dry years both between crops and between
Crop regions. Estimation of decreased yields for all the crops in average
Average years (mm) Dry years (mm) and dry years was lower in the central part of Istria compared with
the western part of Istria. There is an obvious difference in yield
Tomatoes 192.7 272.4
and it is related to soil water deficit due to the fact that the yield in
Cabbage 188.2 242.2 this case was estimated only on the basis of soil water deficit. For
this reason, there is a higher yield decline in shallow-rooted crops,
Alfalfa 239.7 288.9 because in dry years there is a greater lack of moisture during the
growing season in the surface (arable) layer of soil. Similar results,
Grape‒vine 88.0 142.5 in terms of declining crop yields, were confirmed by Mađar et al,
1998; Šimunić et al., 2007 and 2013; Kovačević et al., 2012 and
Olives 35.5 74.4
Kovačević and Josipović, 2015.
Table 4 shows crop yields for a 5‒year period in the area of
Istria County.
aCS
Agric. conspec. sci. Vol. 86 (2021) No. 3Analysis of Climate Elements in Central and Western Istria for the Purpose of Determining Irrigation Requirements of Agricultural Crops | 231
Table 4. Crop yields in the area of Istria County
Year Total precipitation amount (mm) Yield (t/ha)
Pazin Poreč Tomatoes Cabbage and kale Alfalfa Grape Olives
2001 791 668 9.95 12.76 4.14 7.9 1.55
2002 1355 1224 10.45 16.52 4.38 8.55 2.00
2003 852 630 7.39 7.12 3.4 7.45 1.53
2005 1072 995 16.07 19.94 4.57 10.1 2.88
2006 1032 864 17.99 18.4 4.39 8.75 2.31
t/ha 10.3 12.82 1.17 2.65 1.35
Yield difference
% 59 64 26 26 47
In the 5‒year period there is a difference in the yield of each the effect of precipitation amount upon agricultural production, it
crop. The lowest yields of all crops were in the year with the lowest is not sufficient to be conversant solely with annual precipitation
annual precipitation amount (2003), while the highest crop yields amount, but precipitation distribution during a year is also of
were when the annual precipitation amount was around the high importance. Precipitation is just one of several abiotic factors
average value (2006). In the year with the highest precipitation that affect agricultural production, i.e. yield and soil with its
amount (2002), crop yields were between the value of the yield characteristics, relief, terrain position, plant cultivar, as well as
aged in the drought and the year with the average precipitation applied agrotechnics in agricultural operations play a significant
amount. Crop yield decline ranged from the largest decrease of role in terms of yields. The problem of yield decline can be largely
64% in cabbage and kale to the smallest decrease of 26% in alfalfa solved through irrigation.
and vineyards. If we compare the estimated crop yield decline Correlation matrix is presented in Table 5. It can be noticed
and the achieved results, it is evident that yield decline in the that there is no significant correlation between precipitation and
area of Istria County is higher for cabbage, tomatoes and olive each crop yield, which is in accordance with previously described
crops and lower for alfalfa and grape. Considering the issue of reasons.
Table 5. Pearson’s correlation matrix between annual percipitatation and yield
Yield
Variables Precipitation Tomatoes Cabbage and kale Alfalfa Grape Olives
Precipitation 1
Tomatoes 0.255 1
Cabbage and kale 0.582 0.864 1
Alfalfa 0.565 0.758 0.972 1
Grape 0.467 0.772 0.891 0.824 1
Olives 0.462 0.835 0.872 0.763 0.979 1
Values in bold are different from 0 with a significance level of P ≤ 0.05
aCS
Agric. conspec. sci. Vol. 86 (2021) No. 3232 | Ivan ŠIMUNIĆ, Tanja LIKSO, Stjepan HUSNJAK, Marina BUBALO KOVAČIĆ
Conclusions Fischer G., Shah M., Tubiello, F. N., Velhuizen H. (2005). Socio-economic
and climate change impacts on agriculture: an intergrated assessment
Several conclusions can be reached based on the obtained 1990-2080. Phil Trans R Soc B 360: 2067-2083. doi: 10.1098/
results: rstb.2005.1744
1. In the 30-year period in question, air temperature in the Groisman P. Ya, Knight R. W., Easterling D. R., Karl T. R., Hegerl G. C.,
Razuvaev V. N. (2005). Trends in Intense Precipitation in the Climate
area of the central Istria increased by 0.6°C, and in the area
Record. J Clim 18(9): 1326-1350. doi: 10.1175/JCLI3339.1
of the western Istria by 1.6°C. Husnjak S. (2014). Soil systematics of Croatia. Croatian University Press,
2. During the same period in the area of the central Istria the Zagreb, pp. 373 (in Croatian)
amount of precipitation increased by 187 mm, and in the Kovačević V., Josipović M. (2015). Issues in cereal growing in the eastern
area of the western Istria by 133 mm. Croatia. In: (Matić S., Tomić F., Anić I. (eds) Proceedings of scientific
symposium „Food production and forestry - the basis for the
3. The determined soil water deficit in the central part of development of eastern Croatia”, Croatian Academy of Science and
Istria in years with average amount of precipitation ranged Arts, pp. 109-120 (in Croatian)
from 3.6 mm (olives), up to 110.7 mm (alfalfa), while in Kovačević V., Kovačević D., Pepo P., Marković M. (2013). Climate change
dry years water deficit ranged from 43.2 mm (olives) up to in Croatia, Serbia, Hungary and Bosnia and Herzegovina: comparison
229.5 mm (alfalfa). the 2010 and growing seasons. Poljoprivreda 19(2): 16-22
Kovačević V., Rastija M., Josipović M. (2012). Precipitation and
4. Soil water deficit in the western part of Istria in years with
temperature regimes specifities for maize growing in the eastern
average precipitation ranged from 35.5 mm (olives) up Croatia since 2000. In: Kovačević D. (ed) Proceedings of the Third
to 239.7 mm (alfalfa). In dry years soil water deficit was International Scientific Symposium „Agrosym Jahorina 2012“, Faculty
within the range from 74.4 mm (olives) up to 288.9 mm of Agriculture, University of East Sarajevo, pp. 81‒86
(alfalfa). Kutilek M., Nielsen D.R. (2010). Fact about Global Warming: Rational or
5. Estimation of yield decline (%) in the central part of Istria Emotional Issues? Catena, Essays in GeoEcology, pp. 227
Mađar S., Šoštarić J., Tomić F., Marušić J. (1998). Some climate change
in years with an average amount of precipitation ranged
and its impact to agriculture in Eastern Croatia. In: Maceljski M. (ed)
from 1.1% (olives), up to 18.6% (alfalfa), while in dry years Proceedings of scientific symposium with international participation
it ranged from 10.3% up to 37.7%. „Agriculture and Forestry Adaptibility to Climate Change“, Croatian
6. Estimation of yield decline (%) in the western part of Istria Academy of Science and Arts, pp. 127‒135 (in Croatian)
in the years with an average amount of precipitation ranged Miroslav Krleža lnstitute of Lexicography, Istrian encyclopaedia, Available
from 7.0% (olives), up to 40.2% (tomatoes), while in dry at: http://istra.lzmk.hr/clanak.aspx?id=957 [Accessed 25. 11. 2020.]
Miseckaite O., Čadro S., Tunguz V., Lukashevich V., Šimunić I., Orlović‒
years it ranged from 14.4% (olives) up to 40.7% (alfalfa).
Leko P. (2018). Climate and Aridity Change. In: Bhattarai U., Prasad
7. In the 5‒year period in the area of Istria County the lowest Pande V. (eds) Proceedings of 8th Asian Regional Conference‒
yields of all the crops were in the year with the lowest Irrigation in Support of Evergreen Revolution, Nepal National
annual precipitation amount, while the highest crop yields Committee of ICID (NENCID), pp. 143‒152
were when the annual precipitation amount was around Palmer C.W. (1965): Meteorological drought. U.S. Department of
the average value. In the year with the highest precipitation Commerce-Research, No 45, Washington.
Parry M., Rosenzweig C., Livermore M. (2005). Climate change, global
amount, crop yields were between the value of the
food supply and risk of hunger. Phil Trans R Soc B 360: 2125‒38. doi:
yield aged in the drought and the year with the average 10.1098/rstb.2005.1751
precipitation. Patt A., Schröter D. (2008). Perceptions of Climate Risk in Mozambique:
8. Crop yield decline ranged from the largest decrease of 64% Implications for the Success of Adaptation Strategies. Glob Environ
(cabbage and kale), to the smallest decrease of 26% (alfalfa Change 18: 458-467. doi: 10.1016/j.gloenvcha.2008.04.002
and vineyards). Romić D., Marušić J., Tomić F., Petošić D., Šimunić I., Romić M., Mesić
M., Husnjak S., Varga B., Petraš J., Vranješ M., Ondrašek G. (2005).
9. The problem of yield decline can be largely solved through National irrigation and agricultural land and water management
irrigation. project. University of Zagreb, Faculty of Agriculture and Faculty of
Civil Engineering, Zagreb (in Croatian)
References Šimunić I., Husnjak S., Tomić F. (2007). Influence of drought on reduction
of yields of agricultural crops. Agronomski glasnik, 69(5): 343-354.
Beare S., Heaney A. (2002). Climate Change and Water Resources in the (in Croatian)
Murray Darling Basin, Australia. Word Congress of Environmental Šimunić I., Likso T., Miseckaite O., Orlović-Leko P., Ciglenečki I., Spalević
and Resource Economists. pp. 1-33. V. (2019). Climate change and soil water regime. Agriculture &
Beltrão J., Antunes da Silva A., Asher J. B. (1996). Modelling the Effect of Forestry 65 (3): 05-18. doi: 10.17707/AgricultForest.65.3.01
Capillary Water Rise in Corn Yield in Portugal. Irrig Drain Syst 10: Šimunić I., Spalević V., Vukelić‒Shutoska M., Moteva M., Üzen N. (2013).
179‒186 Climate Changes and Water Requirements in Field Crop Production.
Croatian Meteorological and Hydrological Service (DHMZ) and Croatian In: Blesić M. (ed) Proceedings‒24th International Scientific‒Expert
Meteorological Society (HMD) (2003). Zavižan between snow, wind Conference of Agriculture and Food Industry, University of Sarajevo,
and sun, Zagreb, pp. 257 Faculty of Agriculture and Food Sciences, pp. 309‒313
Dokić N., Oršolić R., Kovačević V., Rastija M., Iljkić D. (2015). Weather Širić I., Vidaček Ž. (1988). Hidrokalk – a computer program for calculating
characteristics with aspect of maize and sunflower growing in surface water balance in soil. Faculty of Agricultural Sciences –
context of climatic changes. In: Pospišil M. (ed) Proceedings of 50th Institute of Agroecology, University of Zagreb, Zagreb.
Croatian and 10th International Symposium on Agriculture, Faculty Tomić F. (1988). Irrigation. Croatian Association of Agricultural Engineers
of Agriculture, University of Zagreb, pp. 383-383 and Technicians and Faculty of Agricultural Sciences, University of
Doorenbos, J., Kassam. A. H. (1979). Résponse des rendements á l'eau. Zagreb, Zagreb.
Bulletin FAO d'irrigation et de drainage, No. 33, Rome. Tomić F., Krička T., Ban D., Goreta Ban S., Šatović Z., Oplanić M., Pinzan
aCS
Agric. conspec. sci. Vol. 86 (2021) No. 3Analysis of Climate Elements in Central and Western Istria for the Purpose of Determining Irrigation Requirements of Agricultural Crops | 233
E., Bašić F. (2020). Assessment of the situation and a signpost for Zaninović K., Gajić-Čapka M., Perčec Tadić M., Vučetić M., Milković J.,
sustainable intensification of Croatian agriculture in the conditions Bajić A., Cindrić K., Cvitan L., Katušin Z., Kaučić D., Likso T., Lončar
of climate change, with an emphasis on Istria. In: Krapac M., Goreta E., Lončar Ž., Mihajlović D., Pandžić K., Patarčić M., Srnec L. i Vučetić
Ban S. (eds) Proceedings of scientific symposium „Sustainable V. (2008). Climate atlas of Croatia 1961-1990, 1971-2000. Croatian
development of agriculture and tourism in the context of climate Meteorological and Hydrological Service, Zagreb (in Croatian)
change“, Institute of Agriculture and Tourism, pp. 1-27 (in Croatian)
aCS86_24
aCS
Agric. conspec. sci. Vol. 86 (2021) No. 3You can also read