Analysts' conference March 29, 2021 - TAKKT AG

Page created by Charlie Howell
 
CONTINUE READING
Analysts' conference March 29, 2021 - TAKKT AG
Analysts‘ conference
March 29, 2021
Analysts' conference March 29, 2021 - TAKKT AG
Agenda

               1. Organization and vision
               2. Strategy
               3. Financial year 2020
               4. Outlook for 2021

TAKKT AG    March 2021                  Analysts' Conference   2
Analysts' conference March 29, 2021 - TAKKT AG
Organization and vision

TAKKT AG   March 2021    Analysts' Conference   3
Analysts' conference March 29, 2021 - TAKKT AG
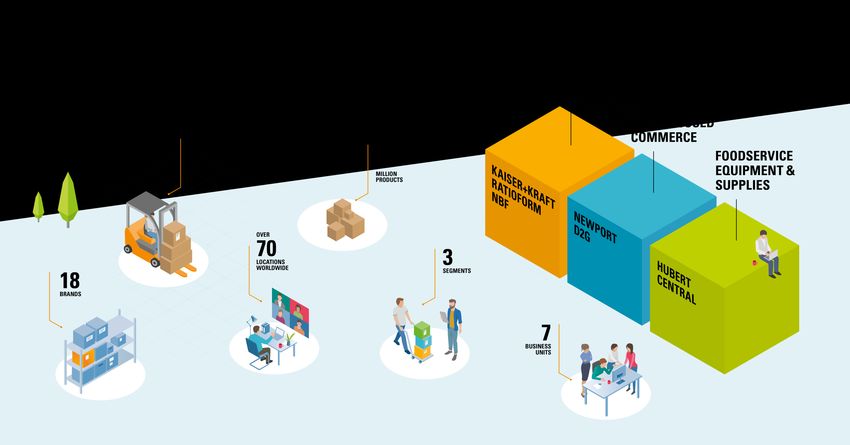
TAKKT Group specializes in B2B distance selling for business equipment

TAKKT AG       March 2021                Analysts' Conference               4
Analysts' conference March 29, 2021 - TAKKT AG
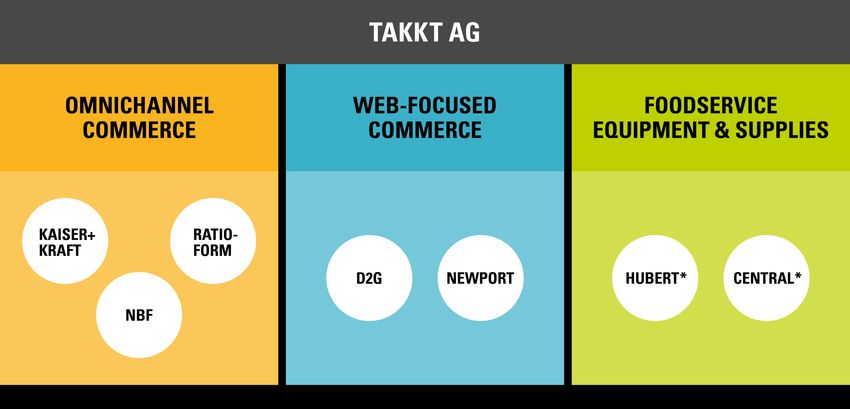
TAKKT Group structure

TAKKT AG      March 2021   Analysts' Conference   5
Analysts' conference March 29, 2021 - TAKKT AG
TAKKT AG   March 2021   Analysts' Conference   6
TAKKT AG   March 2021   Analysts' Conference   7
Strategy

TAKKT AG   March 2021   Analysts' Conference   8
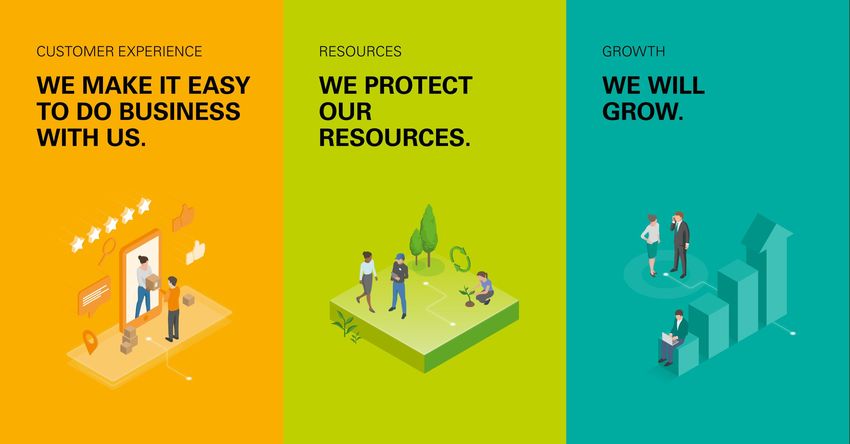
TAKKT has set new ambitions in certain areas to be achieved by 2025

           Grow profitably             Transform the business model                Act sustainably

  • Long-term organic sales growth   • Organizational realignment with   • Share of women in top
    of around 5% per year              focus on two business models        executive positions of at least
                                                                           30 percent
  • Additional growth through        • Above-average organic
    acquisitions                       e-commerce growth                 • Share of sustainable products of
                                                                           over 20 percent
  • Sustainable increase in EBITDA   • Consistently high
                                       recommendation in customers       • 100 percent carbon-neutral
                                       and employees (cNPS and eNPS)       print advertising and shipping
                                                                           processes

TAKKT AG          March 2021                   Analysts' Conference                                           9
Grow profitably:
   Organic growth and profitability ambitions differ between the three segments

                                         Long-term organic growth target
            3-5% p.a.                 6-8% p.a.                            3-5% p.a.           5% p.a.
                                            Long-term EBITDA target
           around 15%                around 10%                          more than 10%   sustainable increase
                                                                                              in EBITDA

TAKKT AG                March 2021                Analysts' Conference                                          10
Transform the business model:
   Continue with implementation of TAKKT 4.0

    Two business models for two different customer types

 Focus on a specific business model allows brands to better fulfill
 the requirements of their respective customer type.

                                            Reallocation of functions and responsibility

                                   Establish segment functions (Logistics, IT infrastructure and data &
                                   analytics) in WFC and OCC and Group finance function in 2021.

                                                                                    Strengthen the operational excellence

                                                                         Steering with a new operating model which defines core
                                                                         behaviors and processes across the Group.

TAKKT AG              March 2021                             Analysts' Conference                                                 11
Act sustainably:
   TAKKT has set new targets for 2025

                                                           • TAKKT achieved most of its sustainability
                                                             goals for 2020

                                                           • Interim sustainability report gives an update
                                                             on the Group’s progress and sets new targets
                                                             for 2025

TAKKT AG       March 2021               Analysts' Conference                                                 12
Financial year 2020

TAKKT AG   March 2021    Analysts' Conference   13
Development of key financials in 2020

                1,067.4                      92.6                       37.2
                 Sales in EUR million   EBITDA in EUR million     Net profit in EUR million

                   129.8                     64.7                       1.10
              Free TAKKT cash flow                                 Dividend proposal
                                        Equity ratio in percent
                     in EUR million                                 per share in EUR

TAKKT AG       March 2021                  Analysts' Conference                               14
TAKKT Group sales in 2020 slightly exceeded updated forecast from October

 Sales (in EUR million)                                               EBITDA (in EUR million) and margin (in %)
                                                                            150.2
            1,213.7
                                       1,067.4
                                                                                                              92.6
                                                                                     12.4%
                                                                                                                     8.7%

              2019                      2020                                     2019                             2020

 • Sales decrease by 12.0%; slightly better than expected in          • Cost management led to substantial savings in personnel and
   October                                                              marketing and other costs
 • Positive acquisition effect (+0.4%) and negative currency          • One-time expenses and gains resulted in a negative effect on
   effect (-0.6%) mostly cancel each other out                          earnings of around EUR 8.6 (EUR 8.5) million
 • Organic sales decline of 11.8%                                     • EBITDA was EUR 92.6 (150.2) million, EBITDA margin at 8.7%
 • Very different impacts from the pandemic on the various end          (12.4%)
   markets of the Group’s business units

TAKKT AG                  March 2021                      Analysts' Conference                                                         15
Omnichannel Commerce stabilized over the course of the second half of the year

 Sales (in EUR million)                                                EBITDA (in EUR million) and margin (in %)
                                                                                  141.7
             971.5
                                       837.3                                                                  102.5
                                                                                          14.6%
                                                                                                                      12.2%

              2019                     2020                                         2019                           2020

 • Sales decrease by 13.8%; negative currency effects of 0.6%          • Sales decline with negative impact on earnings
 • Organic sales decline of 13.2% due to the pandemic                  • One-time expenses and gains had a negative net impact
 • ratioform with a stable organic development;                          of EUR 3.3 (7.3) million
   KAISER+KRAFT, NBF, Hubert and Central with double-digit             • EBITDA was EUR 102.5 (141.7) million, EBITDA margin at
   decline                                                               12.2% (14.6%)

TAKKT AG                  March 2021                       Analysts' Conference                                                   16
Business units in Web-focused Commerce impacted very differently by the pandemic

 Sales (in EUR million)                                                EBITDA (in EUR million) and margin (in %)
             247.3                                                            28.5
                                       234.3

                                                                                      11.5%

                                                                                                                   9.5
                                                                                                                         4.1%

              2019                     2020                                       2019                              2020

 • Sales decrease by 5.3% with positive effects from the              • Drop in sales at D2G weighed on earnings
   acquisition of XXLhoreca (+2.3%) and negative effects from         • Positive net impact on earnings of EUR 2.5 million in prior year
   currency fluctuations (-1.3%)                                      • EBITDA was EUR 9.5 (28.5) million, EBITDA margin at 4.1%
 • Organic sales decline of 6.3%                                        (11.5%)
 • Newport with low double-digit organic growth, D2G with
   double-digit organic decline

TAKKT AG                  March 2021                       Analysts' Conference                                                            17
Lower sales volume also had an impact on gross profit margin

 Gross profit margin development (in %)
           41.3%        -0.9
                                            -0.5
                                                       -0.7                         39.7%
                                                                             +0.5

           2019       Inventory            Supplier   Freight               Other   2020
                     obsolesence          discounts   margin

TAKKT AG             March 2021                           Analysts' Conference              18
Cost management allowed substantial compensation of decline in gross profit

 EBITDA development (in EUR million)
       150.2

                                                                                                         92.6

   EBITDA 2019     Gross profit        Marketing   Personnel            Other              One-time   EBITDA 2020
                                        costs       costs*              costs*              effects
                                                   *adjusted for one-time effects

TAKKT AG                March 2021                                  Analysts' Conference                            19
TAKKT cash flow negatively impacted by lower business volume

 TAKKT cash flow (in EUR million) and margin (in %)                               in EUR million                            2019     2020
                                                                                  Profit                                     74.7    37.2
            120.4                                                                 + depreciation                            +41.4   +40.2
                                                                                  +/- deferred taxes expense/income          +3.3    -4.5
                                                  82.0                            +/- other non-cash expenses/income         +1.1   +13.5
                                                                                  +/- result from non-cur. asset disposal    -0.1    -4.4
                      9.9%                                                        TAKKT cash flow                           120.4    82.0
                                                             7.7%

                                                                                  in EUR million                            2019     2020
                                                                                  EBITDA                                    150.2    92.6
               2019                                   2020                        - financial result                         -8.2    -5.7
                                                                                  - current taxes                           -22.6   -14.0
                                                                                  +/- other non-cash expenses/income         +1.1   +13.5
                                                                                  +/- result from non-cur. asset disposal    -0.1    -4.4
                                                                                  TAKKT cash flow                           120.4    82.0

TAKKT AG                March 2021                                  Analysts' Conference                                                    20
Best free TAKKT cash flow in the company’s history to date

 Cash flow development for the period (in EUR million)
                                                                                                                                   +22.6           129.8
                                                                                       +8.4              120.5        -13.3
                                                                 +22.4

                                    +8.5          +2.5
      82.0          -3.3

 TAKKT cash flow    Trade           Trade      Inventories      Change in            Change in     Cash flow from    Capex in     Sale of real   Free TAKKT
                   payables      receivables                 assets/liabilities      provisions      operating      non-current     estate        cash flow
                                                                                                      activities      assets

TAKKT AG                   March 2021                                             Analysts' Conference                                                        21
Free cash flow with a more stable development than EBITDA

Development of EBITDA and free cash flow (in EUR million)

                                                                                                          •   High free cash flow in 2020
 160                                                                                                          due to release of cash from
                                                                                                              net working capital and low
                                                                                                              capex spending
 120
                                                                                                          •   Sale of real estate contributed
                                                                                                              an additional EUR 22.6 million
                                                                                                              to free TAKKT cash flow
  80

  40

    0
        2000   2002      2004      2006      2008   2010      2012        2014       2016   2018   2020
                                          EBITDA       Free cash flow

TAKKT AG              March 2021                              Analysts' Conference                                                          22
Significant reduction in net financial liabilities and very solid balance sheet

 Net financial liabilities (in EUR million)                                Equity ratio (in %)
          189.8                                                                                                 64.7%
                                                                                        58.5%

                                              75.4

           12/31/2019                     12/31/2020                                  12/31/2019             12/31/2020

 • Strong free cash flow used to repay liabilities                         • Profit for the period and decrease in total assets result in
 • TAKKT repaid all bank liabilities                                         an increased equity ratio
 • Initial recognition of lease contract from sale-and-lease
   back in the US adds EUR 13.9 million to liabilities

TAKKT AG                   March 2021                          Analysts' Conference                                                         23
TAKKT proposes dividend payment of EUR 1.10 per share

                                           Dividend policy                                                     Dividend proposal
                                                                                                  Dividend payment of EUR 0.55 for 2020 plus
   •     Payout ratio within a corridor of 35 to 45 percent of the profit
                                                                                                  previous year’s suspended base dividend of
   •     TAKKT aims for a consistent and reliable dividend stream                                 another EUR 0.55.

   •     Willingness to return funds to shareholders via a special dividend when                  This proposal is subject to the condition that the
         equity ratio is high and funds cannot be reinvested.                                     negative effects of the pandemic do not worsen
                                                                                                  significantly before the Shareholders’ Meeting.
Dividend per share in Euro
                                                                                                                                            1.10*
                      0.85                                                                                         0.85

                                                                           0.50            0.55       0.55

       0.32                            0.32       0.32       0.32

                                                                                                                                0.00

       2010           2011             2012       2013       2014          2015            2016       2017         2018        2019         2020
 * Proposal to the Shareholders‘ Meeting

TAKKT AG                      March 2021                            Analysts' Conference                                                               24
Outlook for 2021

TAKKT AG   March 2021   Analysts' Conference   25
Outlook: TAKKT expects strong growth and significant earnings increase in 2021

           Economic environment                      Strategic focus                  Outlook for key financials

 •    Economic development still         •   Implementation of strategic
      dependant on course of the             initiatives to drive organic growth in    Organic sales growth of
      pandemic.                              the business units.                      between 7 and 12 percent
 •    Extension of lockdowns in Europe   •   Development of segment structures
      will negatively impact business        in OCC and WFC. IT infrastructure,
      activity in Q1.                        logistics and data & analytics will be      EBITDA between
                                             centrally coordinated and managed.       EUR 100 and 120 million

TAKKT AG              March 2021                      Analysts' Conference                                         26
Appendix:
             TAKKT share and equity story

TAKKT AG   March 2021    Analysts' Conference   27
TAKKT share performance, shareholder structure and analyst recommendations

 Total Shareholder Return: TAKKT and indices                              Shareholder structure
150

                                                                                                             Franz Haniel &
125                                                                          49.8%              50.2%        Cie.
                                                                                                             Free float

100

 75                                                                       Analyst recommendations

 50
                                                                                                              Buy

 25

                                                                                         8
                                  TAKKT   DAX   MDAX         SDAX
                                                                          Average price target of EUR 13.8

TAKKT AG             March 2021                    Analysts' Conference                                                   28
TAKKT equity story at a glance

                           TAKKT’s business units are B2B direct-marketing                   Gross profit margin > 40% (target)

                  specialists for business equipment in Europe and North America              38.5%       40.5%       41.4%         42.6%      39.7%

                   Business units are market-leaders in attractive market niches               1999        2003       2008          2015           2020

                                   with high operational margins                             EBITDA margin 12-15% (target)

                                                                                                                      14.3%         14.8%
                                                                                              11.2%       11.2%
                                                                                                                                               8.7%

           Growth opportunities through organic initiatives (Digitalization and TAKKT 4.0)
                               as well as upside from acquisitions                             1999        2003       2008          2015           2020

                                                                                             TAKKT cash flow margin > 8% (target)

                                                                                                                      10.4%         10.7%
                                                                                              7.4%         7.3%                                7.7%
                                     Sustainable increase in EBITDA
                                                                                               1999        2003       2008          2015           2020

                                                                                             Reliable dividend payouts (in EUR)
                                                                                                                               Dividend       EPS
                            Business model generates high free cash flows
                                                                                                                      1.47
                                and allows attractive dividend payouts                            1.24
                                                                                                            1.39                1.34
                                                                                                                                            1.14          1.10
                                                                                                                                0.85
                                                                                                  0.50      0.55      0.55                                0.57
                                                                                                                                            0.00

       Stable, long-term oriented shareholder structure with Franz Haniel & Cie. GmbH         2015       2016      2017      2018      2019        2020

                                   as majority shareholder

TAKKT AG                March 2021                         Analysts' Conference                                                                              29
TAKKT investor relations

                                 IR Contact                                                                      Upcoming Events
   Michael Loch / Benjamin Bühler                                                                 March
   Phone:    +49 711 3465-8222 / -8223                                                            30./31. Jefferies European Mid-Cap Forum (virtual event)
   Fax:      +49 711 3465-8100
   e-mail:   investor@takkt.de                                                                    April
                                                                                                  14./15. Virtual roadshow
   www.takkt.com                                                                                  29.     Earnings call Q1/2021
   TAKKT AG is headquartered in Stuttgart, Germany.

                         Basic data TAKKT share                                                    Historic share price development (Xetra)
   ISIN / WKN / Ticker    DE0007446007 / 744600 / TTK                                                                                                          16
                                                                                                                                                   TAKKT AG
                                                                                                                                                               14
   No. shares             65,610,331
                                                                                                                                                               12
   Type                   No-par-value bearer shares
                                                                                                                                                               10
   Share capital          EUR 65,610,331
                                                                                                                                                               8
   Listing                September 15, 1999
                                                                                                                                                               6
   Index                  SDAX, prime standard
                                                                                                                                                               4
   Designated sponsors    Pareto Securities, Oddo Seydler, Hauck & Aufhäuser              Mar          May       Jul      Sep      Nov       Jan         Mar

TAKKT AG                   March 2021                                      Analysts' Conference                                                                    30
Appendix:
             Key performance figures and
             indicators

TAKKT AG   March 2021   Analysts' Conference   31
Overview of key performance figures and indicators

           Financial key figures                  Product range figures             Digital agenda indicators
  •    Organic sales development            •   Share of private labels         •   Launched and completed measures
  •    Number of orders and average order   •   Share of direct imports         •   Newly created positions
       value                                                                    •   Additional personnel expenses
  •    Gross profit margin                                                      •   Other expenses
  •    EBITDA                                                                   •   Capital expenditure and start-up
  •    TAKKT cash flow                                                              investments
  •    Free TAKKT cash flow                                                     •   Organic e-commerce growth
  •    Capital expenditure ratio                                                •   Share of e-commerce in order intake

           Value-based figures                      Internal covenants              Sustainability indicators
  •    TAKKT value added                    •   Equity ratio                    •   A total of 16 indicators across the six
  •    Return on Capital Employed (ROCE)    •   Debt repayment period               focus areas sourcing, marketing,
                                            •   Interest cover                      logistics, resources & climate,
                                            •   Gearing (debt-equity ratio)         employees and society

TAKKT AG               March 2021                        Analysts' Conference                                                 32
Financial key figures

                                                  2016         2017    2018    2019    2020

 Organic sales development in percent               5.2          0.4     3.4    -1.4   -12.0

 Number of orders in thousand                    2,409         2,465   2,676   2,642   2,535

 Average order value in EUR                        469          458     449     460     425

 Gross profit margin in percent                   42.6          42.5    41.5    41.3    39.7

 EBITDA in EUR million                           171.3         150.3   150.1   150.2    92.6

 TAKKT cash flow in EUR million                  125.6         109.1   120.8   120.4    82.0

 Free TAKKT cash flow in EUR million             101.4          73.0    82.7   107.1   129.8

 Capital expenditure ratio in percent               1.5          2.1     1.8     1.8     1.2

TAKKT AG              March 2021        Analysts' Conference                               33
Product range figures

Share of private labels* (in %)                                                                      Share of direct imports* (in %)

                                                                                                                                                              22.0%            21.7%
                                                         24.1%             24.2%
                      20.7%             21.7%                                                                                               17.9%
     18.3%                                                                                                                 15.5%
                                                                                                         13.7%

     2016              2017             2018              2019              2020                          2016             2017              2018             2019              2020

* The figures have only been reported as shares of sales for 2019 and 2020. For prior years, they are shown as shares of order intake (private label) and purchase volume (direct imports)

TAKKT AG                        March 2021                                               Analysts' Conference                                                                                34
Digital agenda indicators

 Newly created positions filled                                                   Organic e-commerce growth (in percent)
                                                                                                         11.6%
                                                                                    10.6%
                                                                                               7.9%
                           98
                                             85     87
              78
                                                                                                                    2.0%

   26

                                                                                                                              -3.6%
   2016       2017         2018          2019       2020                             2016      2017      2018       2019       2020

Launched and completed measures                                                    Share of e-commerce in order intake (in percent)
                                  157             162
                                                                                                                              60.0%
                                                    123                                                  52.1%     55.0%
                114                                                                           46.8%
   100                                                                              43.9%
                                        92

                      44
         27
                                                           Launched
                                                           Completed
    2017           2018           2019            2020                               2016      2017      2018       2019       2020

TAKKT AG                     March 2021                                Analysts' Conference                                           35
TAKKT invested around € 51 million until 2020 for the implementation of the digital
   agenda and additional € 11 million for start-up investments

 In EUR million                                            2016        2017   2018   2019   2020
 Additional personnel expenses (year-on-year)                 0.6       3.9    2.9    0.7   -0.6
 Other expenses                                               1.9       3.8    4.0    2.9    2.1
 Capital expenditure                                          1.4       8.7    8.4    6.0    4.7
 Digital agenda cost (investment view)                        3.9      16.5   15.3    9.6    6.2

 Personnel expenses (cumulative)                              0.6       4.4    7.3    8.0    7.4
 Other expenses                                               1.9       3.8    4.0    2.9    2.1
 Digital agenda cost (EBITDA impact)                          2.5       8.3   11.3   10.9    9.5

 TAKKT Start-up investments                                   1.0       4.5    2.3    3.0    0.3

TAKKT AG               March 2021               Analysts' Conference                           36
Value-based figures

TAKKT value added (in EUR million)                                                   Return on Capital Employed (in %)

                                                                                        16.5%
                    50.4*                                                                          14.6%       14.0%
     46.8*
                     7.3            37.6 *                                                                               11.1%
      8.5
                                     7.2
                                                     15.9*                                                                       5.6%
     38.3           43.1
                                    30.4              6.1
                                                      9.8     2020

     2016           2017            2018            2019      -18.7 *                   2016        2017        2018     2019    2020

 * Adjusted for amortization of intangible assets resulting    -4.5
 from acquisitions and the related tax impact.                -23.2

 •    Due to the significantly lower earnings during the pandemic, the value-based figures also decreased significantly

TAKKT AG                    March 2021                                  Analysts' Conference                                            37
Internal covenants within or exceeding the target range

 Equity ratio (in %)                                                            Debt repayment period (in years)
                                                                                                                                 Internal target value:
                                         64.7%
             61.2%     60.8%     58.5%                                                                                           < 5 years
  55.2%
                                                 Internal target range:
                                                 30 to 60 percent                  1.6                             1.7
                                                                                            1.4        1.4                1.4

  2016        2017     2018      2019    2020                                     2016      2017      2018         2019   2020

 Interest cover                                                                 Gearing
                       23.8                                                                                                      Internal target value:
                                                                                                                                 < 1.5
   18.3
              16.3               16.7

                                         11,0
                                                                                   0.3                             0.3
                                                                                            0.2        0.2
                                                 Internal target value:                                                   0.1
                                                 >4

  2016        2017     2018      2019    2020                                     2016      2017      2018         2019   2020

TAKKT AG                 March 2021                                 Analysts' Conference                                                                  38
Sustainability indicators

 Focus area*     Key figure                                                                                 2017    2018    2019     2020
                 Share of sourcing volume from certified suppliers                                          46.8%   44.2%   51.6%    49.1%
 Sourcing        Share of direct imports sourcing volume from certified suppliers                           39.8%   39.3%   60.2%    54.2%
                 Share of sales from sustainable product ranges                                              9.3%    9.5%    9.5%    10.8%
                 Carbon-neutral web shops for major companies                                                  7      12      17       15
 Marketing       Paper consumption print advertising materials per order                                    5.4kg   4.2kg   3.0kg    2.8kg
                 Share of carbon-neutral advertising materials                                              12.1%   19.9%   60.5%   100.0%
                 Share of carbon-neutral parcel delivery                                                    91.4%   93.5%   92.2%    93.5%
 Logistics
                 Share of carbon-neutral general cargo delivery                                             44.7%   48.9%   54.8%    87.1%
                 Major companies with carbon footprint                                                        13      13      16       16

 Resources       Major companies with a certified environmental mgmt. system                                   6       6       9       10
 and Climate     Major companies with a certified energy management system                                     4       4       4        6
                 Energy consumption at GER / US locations per order in megajoule                             70.6    66.7    71.3     51.0
                 Share of retained „digital talents“                                                        90.9%   89.9%   65.9%    61.7%
 Employees
                 Share of women in top executive positions                                                  10.5%   12.3%   15.1%    14.0%
                 Percentage of employees who have the opportunity to take a paid
                                                                                                            65.7%   70.2%   68.8%    86.1%
 Society         leave for local volunteer involvement
                 Percentage of employees who took part in local volunteer projects                          15.1%   18.0%   14.7%     9.5%

 * The Newport companies are only included in the focus area employees for the sustainability indicators.

TAKKT AG                       March 2021                                              Analysts' Conference                                  39
Appendix:
             Pro forma figures
             new segment structure

TAKKT AG   March 2021   Analysts' Conference   40
Pro forma sales development for the new segment structure

  in %                                                                      Q1/20                     Q2/20         Q3/20    Q4/20    2020
  TAKKT Group in EUR                                                        -7.2%                    -20.0%         -14.0%   -6.9%    -12.0%
  organic                                                                   -10.1%                    -21.2%        -12.2%   -3.6%    -11.8%
  currency                                                                  +1.5%                     +0.7%         -1.8%    -3.3%    -0.6%
  acquisition/divestment                                                    +1.4%                     +0.5%           -        -      +0.4%

  Omnichannel Commerce in EUR*                                              -9.3%                    -27.3%         -15.6%   -3.2%    -13.8%
  organic                                                                   -10.3%                    -27.9%        -14.6%   -1.6%    -13.6%
  currency                                                                  +1.0%                     +0.6%         -1.0%    -1.6%    -0.2%
  acquisition/divestment                                                       -                         -            -        -        -

  Web-focused Commerce in EUR                                               +5.5%                     -6.8%         -8.6%    -10.5%   -5.3%
  organic                                                                    -3.8%                    -9.2%         -6.5%    -5.6%    -6.3%
  currency                                                                  +1.9%                     +0.2%         -2.1%    +4.9%    -1.3%
  acquisition/divestment                                                    +7.4%                     +2.2%           -        -      +2.3%

  Foodservice Equipment & Supplies in EUR*                                  -13.4%                   -11.5%         -15.0%   -15.8%   -13.9%
  organic                                                                   -15.9%                    -13.1%        -11.1%   -8.3%    -12.2%

  currency                                                                   2.5%                      1.6%         -3.9%    -7.5%    -1.7%

  acquisition/divestment                                                       -                         -            -        -        -

* New segment structure implemented in 2021. The table shows the pro forma figures for 2020 in the new structure.

TAKKT AG                       March 2021                                             Analysts' Conference                                     41
You can also read