Analytical study on COVID-19 to predict future infected cases ratio in India using Machine Leaning - Open Access proceedings Journal of ...
←
→
Page content transcription
If your browser does not render page correctly, please read the page content below
IOP Conference Series: Materials Science and Engineering

PAPER • OPEN ACCESS

Analytical study on COVID-19 to predict future infected cases ratio in
India using Machine Leaning
To cite this article: Hiral R. Patel et al 2021 IOP Conf. Ser.: Mater. Sci. Eng. 1022 012022

View the article online for updates and enhancements.

                                This content was downloaded from IP address 46.4.80.155 on 26/01/2021 at 20:39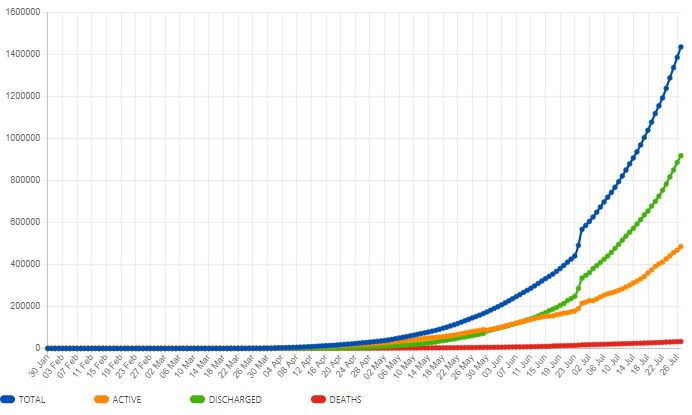
ICCRDA 2020                                                                                                              IOP Publishing
IOP Conf. Series: Materials Science and Engineering              1022 (2021) 012022           doi:10.1088/1757-899X/1022/1/012022

Analytical study on COVID-19 to predict future infected cases
ratio in India using Machine Leaning

                     Hiral R. Patel1, Hiral A. Patel2, Ajay M. Patel3, Satyen M. Parikh4
                     1
                       Assisatnt Professor, DCS, Ganpat University
                     2
                       Associate Professor, AMPICS, Ganpat University
                     3
                      Associate Professor, AMPICS, Ganpat University
                     4
                      Dean / Prof Head, FCA, Ganpat University

                     Email: hrp02@ganpatuniversity.ac.in,
                     hiral.patel@ganpatuniversity.ac.in,patel.ajay82@gmail.com,satyen.parikh@ganpatuni

                     versity.ac.in

                     Abstract. COVID-19 is real a worldwide terrific problem. This paper focuses on the different
                     aspects of data analytics and visualization by using various datasets supported by authorized
                     sources. It also discusses the practical aspects using open source tools and python library support.
                     Here chapter focuses on comparative analysis also. It also visualize analytical aspects by
                     different aspects such as country wise, date wise and so on. In this paper, the COVID infected
                     cases and its reaction on people will be discussed. This case study will predict the COVID-19
                     infected cases and death ratio with symptoms in future. This paper focus on data visualization,
                     data analytics and comparative study based on practical aspects. Machine Learning plays a vital
                     role to predict the cases by providing learning instances.

Keywords: Animated Graphs, COVID-19, Data Analytics, Data Visualization, Plotting

       1. Introduction
Coronavirus is an overpowering ailment achieved by the Coronavirus, naturally known as extraordinary
exceptional respiratory condition Covid 2 (SARS-CoV-2). The disease was first acknowledged in
Wuhan, China in December 2019 and has spread wherever all through the world starting now and into
the foreseeable future. As of composing this, on 28th April 2020, 00:55 IST, there are 3 million affirmed
cases all through the world and has brought about 208,000 passing’s as indicated by Google. India and
the world are wrestling with the COVID-19 emergency. Diseases and setbacks are rising each day,
alongside recuperations. There are various information focuses that can assist us with understanding this
emergency, across India and the world. This COVID-19 Analytical study unites pertinent information
and gives you, the client, control in deciphering them through our instinctive and intelligent
representation devices. [1][2][5]
              Content from this work may be used under the terms of the Creative Commons Attribution 3.0 licence. Any further distribution
              of this work must maintain attribution to the author(s) and the title of the work, journal citation and DOI.
Published under licence by IOP Publishing Ltd                          1
ICCRDA 2020 IOP Publishing
IOP Conf. Series: Materials Science and Engineering 1022 (2021) 012022 doi:10.1088/1757-899X/1022/1/012022
With the quantity of COVID-19 cases crossing 18 million imprint, the social insurance framework
over the globe has endured a significant blow against the administration of COVID-19. In India,
COVID-19 has demonstrated testing at first for distinguishing the COVID patients and diagnosing the
malady. Nonetheless, the utilization of Artificial Intelligence (AI) in the course of recent years, has
delivered the Healthline laborers and the administration for arrangements, to slow down this detour.
[2][3][6]
Man-made reasoning uses the innovation of incredible calculations which at that point forms the
information, in this way recognizing designs. Along these lines, for any Artificial Intelligence to be
fruitful, huge information is vital. [7][8][9]
In context with the Machine Learning, this paper focus on experimental study to find out the covid-
19 infected Death and recovered case as per the hidden patterns followed in virus. [10]
2. Literature Survey
COVID-19 is an unusual illness that has advanced into a epidemic. The WHO reported this epic
illness on December 31, 2019, in Wuhan, China. Not long after the episode in China heaps of nations
were in the grip of COVID-19. As indicated by WHO universally 25 602 665 affirmed cases have been
enlisted, 852 758 deaths have been recorded till date. The area savvy measurements are appeared in Fig.
3 for India. The Indian infected states with number of confirmed case of COVID 19 with the ratio of
recovery and deaths. [11] [12] [13]
There is a requirement for creative answers for create, oversee and dissect huge information on the
developing system of contaminated subjects, tolerant subtleties, their locale developments, and
incorporate with clinical preliminaries and, pharmaceutical, genomic and general wellbeing information
[6]. Numerous wellsprings of information including, instant messages, online correspondences, web
based life and web articles can be useful in examining the development of disease with network conduct.
Wrapping this information with Machine Learning (ML) and Artificial Intelligence (AI), analysts can
gauge where and when, the ailment is probably going to spread, and advise those areas to coordinate the
necessary courses of action. Travel history of tainted subjects can be followed naturally, to consider
epidemiological connections with the spread of the infection. Some people group transmission based
impacts have been concentrated in other works1. Framework for the capacity and examination of such
gigantic information for additional handling should be created in a productive and financially savvy
way. [22][31][32]
At present, the entire world is seeing the COVID-19 pandemic. Till date More than 100 nations
basically influenced by COVID-19. Which considers broadening each experiencing day. Since the
inception of these infections, one thing was watched, that is, with the movement in time, these maladies
venture into pandemics or normally proposed as the eject of the defilement/disease. A scourge forms
into a pandemic when the circumstance increments out of power at the nearby source where the emit
was first seen to spread. The eccentricity of the ailment and the shortcoming that triumphs concerning
the confusion has prompted a gigantic measure of bits of snitch regarding its whereabouts. Individuals
are dubious about the preclinical signs and the approaches to manage oversee it. One more imperative
factor to consider is that heaps of individuals who have preclinical appearances don't appear at the
clinical offices on time by virtue of remissness or dread of testing positive for the disorder. On the off
chance that someone has the signs they need to make up for lost time with it as quick as time licenses.
This can help with sparing a ton of lives. On the off chance that an early eject in any country is suitably
controlled, by then the circumstance can be protected from forming into a pandemic. At whatever point
these pandemic happen, world economies are basically hit. Billions of dollars should be put resources
into controlling an emit comparatively as in the movement of a checking specialist for the new sickness
[23][24][26][32]
Experts are putting massive effort for solving the COVID-19 separated from the above talked work
[27–32]. Scientists are attempting to research productive and precise models so as to anticipate the
2ICCRDA 2020 IOP Publishing
IOP Conf. Series: Materials Science and Engineering 1022 (2021) 012022 doi:10.1088/1757-899X/1022/1/012022
demise check. Analysts are additionally attempting to give a rundown of rules that can be trailed by the
individuals to diminish the spread pace of the COVID-19.
3. Data Analytics for COVID 19
COVID-19 is pandemic for entire world. Data Analytics in COVID-19 plays vital role to identify the
way COVID-19 reacts and transform. This study dealing with analytical aspects of COVID-19. There
are various government approved online data sources are available to carry out the analytical works. In
this paper, authorized online data source is utilized to perform the study. The data set contains personal
information of COVID-19 infected peoples and summarized dataset for number of cases in each
countries with state level data. The dataset also gives the information of death ratio and recover ration
in detail. This study focus on COVID-19 effect on INDIA. The dataset has latest information till 10
August 2020.
The following figure shows the COVID-19 infected, recovered and death ratio day wise.
Fig. 1. COVID-19 cases in World
As we all know the COVID 19 cases rising every moment and by awareness and applying safety
mechanisms the death ratio also in control. The below figure shows the same cases specifically in
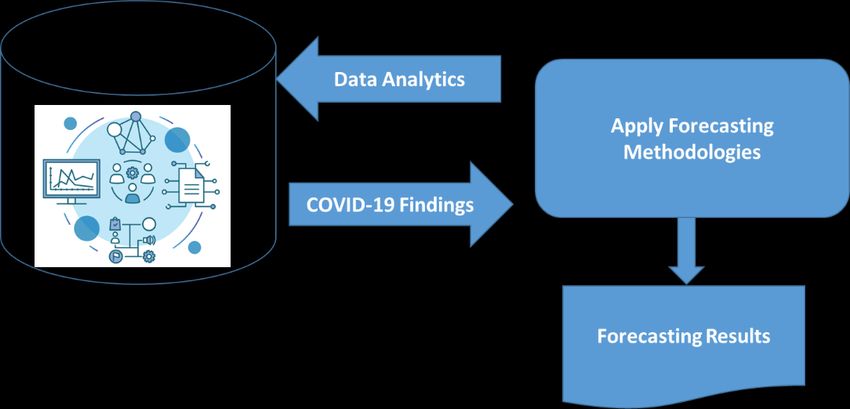
INDIA.
3ICCRDA 2020 IOP Publishing
IOP Conf. Series: Materials Science and Engineering 1022 (2021) 012022 doi:10.1088/1757-899X/1022/1/012022
Fig. 2 COVID-19 cases in India
In above figure we can easily get the idea about speediness of COVID-19 but also represent the good
recovery ratio as well and control the death ratio. For more summarized view refer below week wise
data representation.
4ICCRDA 2020 IOP Publishing
IOP Conf. Series: Materials Science and Engineering 1022 (2021) 012022 doi:10.1088/1757-899X/1022/1/012022
Fig. 3 COVID 19 cases in INDIA week wise view
So by performing data visualization any one can get the idea about the COVID-19 cases in INDIA.
These all graph generated through python.
3.1. A subsection
Some text.
3.1.1. A subsubsection. The paragraph text follows on from the subsubsection heading but should not
be in italic.
4. Forecasting Methodology
5ICCRDA 2020 IOP Publishing
IOP Conf. Series: Materials Science and Engineering 1022 (2021) 012022 doi:10.1088/1757-899X/1022/1/012022
AI and profound learning techniques are frequently answered to be the key answer for all prescient
displaying issues.
A significant ongoing examination assessed and looked at the presentation of numerous old style and
current AI and profound learning strategies on an enormous and various arrangement of more than 1,000
univariate time arrangement-anticipating issues.
The aftereffects of this examination propose that basic old style techniques, for example, straight
strategies and exponential smoothing, beat mind boggling and modern techniques, for example, choice
trees, Multilayer Perceptrons (MLP), and Long Short-Term Memory (LSTM) organize models.
These discoveries feature the prerequisite to both assess old style techniques and utilize their outcomes
as a gauge while assessing any AI and profound learning strategies for time arrangement determining
all together show that their additional multifaceted nature is adding ability to the figure.
The proposed model is used to forecast the COVID-19 cases as per the historical symptoms.
Fig. 4 Proposed Model
There are many predictive models are available. In this study Linear modelling is applied for forecasting
the Death rate as well as infected rate.
5. Model Implementation and Result Discussion
The proposed model utilise the regression modelling technique to forecast the COVID cases in terms of
death rate and infected rate. When you pick and fit a last AI model in scikit-learn, you can utilize it to
make expectations on new information cases. There is some disarray among tenderfoots about how
precisely to do this. I frequently observe questions, for example, The Scikit learn provides the modelling
support in python. In this instructional exercise, you will find precisely how you can make
characterization and relapse expectations with a concluded AI model in the scikit-learn Python library.
In the wake of finishing this instructional exercise, you will know: The most effective method to
conclude a model so as to prepare it for making forecasts. Instructions to make class and likelihood
expectations in scikit-learn. The most effective method to make relapse expectations in scikit-learn.
In measurable displaying, relapse investigation is a genuine method for assessing the associates
among a dependent feature (commonly called the output variable) and at least one independent features
(commonly called input variables). The most broadly renowned form of relapse investigation is straight
relapse, in which an expert inventions the line (or a more mind-boggling direct mix) that most closely
6ICCRDA 2020 IOP Publishing
IOP Conf. Series: Materials Science and Engineering 1022 (2021) 012022 doi:10.1088/1757-899X/1022/1/012022
fits the evidence as specified by a specific methodical measure. For example, the method for standard
least squares progressions the extraordinary line (or hyperplane) that bounds the total of squared
separations between the genuine information and that line (or hyperplane). For clear numerical
explanations (see straight relapse), this licences the expert to measure the restrictive desire (or populace
normal estimation) of the reliant variable when the autonomous factors take on a given arrangement of
qualities. More uncommon types of relapse utilize marginally various systems to appraise elective area
boundaries (e.g., quartile relapse or Necessary Condition Analysis) or gauge the restrictive desire over
a more extensive assortment of non-straight models (e.g., nonparametric relapse). Relapse is a managed
learning issue where, given info models, the model learns a planning to reasonable yield amounts, for
example, "0.1" and "0.2", etc. We can foresee amounts with the settled relapse model by calling the
anticipate () work on the concluded model. Similarly as with characterization, the foresee () work takes
a rundown or exhibit of at least one information examples.
The below figure shows the result statistics by applying the Regression model to forecast infected
cases through python.
In LR model R2 score defines the model acceptability.
Here for death cases we got R2_Score 0.9926152196868084 which indicates the model is accepted
and gives 87% accuracy. The scatter graph also defined below.
Fig. 5 Death Rate Prediction Scatter Plot
The model also forecast the confirm rate and generate the R2 score as R2_Score
0.9990115253388306. The below figure shows the scatter plot for forecaster model.
7ICCRDA 2020 IOP Publishing
IOP Conf. Series: Materials Science and Engineering 1022 (2021) 012022 doi:10.1088/1757-899X/1022/1/012022
Fig. 6 Confirmed Case Scatter Plot.
As per both forecasting, model gives direction that the death rate is decreased in compare with the
confirmed cases. The recovery rate increase due to the safety mechanisms, Medical help and other
factors. You can see in fig 5 where death rate is slightly moving to decrease side and gradually
maintained.
6. Conclusion
The patterns finding through the COVID-19 data instances and ML applicability, the confirmed cases
and recovery increases and death rate is decreasing. There are various hidden factor for it. If we combine
data of hospital report and patient report history, we can achieve more modelling and predictive aspects.
References
[1] Shi P, Dong Y, Yan H, Li X, Zhao C, Liu W, He M, Tang S, Xi S. The impact of temperature
and absolute humidity on the coronavirus disease 2019 (COVID-19) outbreak-evidence from
China. MedRxiv. 2020.
[2] Fong SJ, Li G, Dey N, Crespo RG, Herrera-Viedma E. Composite monte carlo decision making
under high uncertainty of novel coronavirus epidemic using hybridized deep learning and fuzzy
rule induction. Appl Soft Comput. 2020;106282. [PMC free article] [PubMed]
[3] Batista M. Estimation of the final size of the second phase of the coronavirus COVID-19
epidemic by the logistic model.
8ICCRDA 2020 IOP Publishing
IOP Conf. Series: Materials Science and Engineering 1022 (2021) 012022 doi:10.1088/1757-899X/1022/1/012022
[4] Hu Z, Ge Q, Li S, Jin L, Xiong M. Evaluating the effect of public health intervention on the
global-wide spread trajectory of Covid-19. medRxiv. 2020.
[5] Jia L, Li K, Jiang Y, Guo X. Prediction and analysis of coronavirus disease 2019. arXiv
preprint https://arXiv:2003.05447. 2020.
[6] Kumar J, Hembram KPSS. Epidemiological study of novel coronavirus (COVID-19). 2020
arXiv preprint https://arXiv:2003.11376.
[7] DeCaprio D, Gartner J, Burgess T, Kothari S, Sayed S. Building a COVID-19 vulnerability
index. arXiv preprint https://arXiv:2003.07347. 2020.
[8] Santosh K, Das D, Pal U. Truncated inception net: COVID-19 outbreak screening using chest
X-rays. PREPRINT (Version 1) available at Research Square 3, 2020.
[9] Santosh KC. AI-driven tools for coronavirus outbreak: need of active learning and cross-
population train/test models on multitudinal/multimodal data. J Med Syst. 2020;44(5):1–5. doi:
10.1007/s10916-020-01562-1. [PMC free article] [PubMed] [CrossRef] [Google Scholar]
[10] Dey N, Rajinikant V, Fong SJ, Kaiser MS, Mahmud M. Social-group-optimization assisted
kapur’s entropy and morphological segmentation for automated detection of COVID-19
infection from computed tomography images. 2020.
[11] Wagh CS, Mahalle PN, Wagh SJ. Epidemic peak for COVID-19 in India, 2020. Preprints
2020, 2020050176 (10.20944/preprints202005.0176.v1).
[12] Rajinikanth V, Dey N, Raj ANJ, Hassanien AE, Santosh KC, Raja N. Harmony-search and
otsu based system for coronavirus disease (COVID-19) detection using lung CT scan
images. 2020 arXiv preprint arXiv:2004.03431.
[13] Bhapkar HR, Mahalle P, Dhotre PS. Virus graph and COVID-19 pandemic: a graph theory
approach. Preprints 2020, 2020040507 (10.20944/preprints202004.0507.v1).
[14] Bullock J, Pham KH, Lam CS, Luengo-Oroz M. Mapping the landscape of artificial
intelligence applications against COVID-19. arXiv preprint arXiv:2003.11336. 2020.
[15] Mahalle PN, Sable NP, Mahalle NP, Shinde GR Data analytics: COVID-19 prediction using
multimodal data. Preprints 2020, 2020040257 (10.20944/preprints202004.0257.v1).
[16] Ardabili SF, Mosavi A, Ghamisi P, Ferdinand F, Varkonyi-Koczy AR, Reuter U, Rabczuk T,
Atkinson PM. Covid-19 outbreak prediction with machine learning. Available at SSRN
3580188. 2020.
[17] COVID-19 in India: guidance from the IndiaSIM Model- March 24,
2020. https://cddep.org/covid-19/.
[18] Dey N, Fong S, Song W, Cho K Forecasting energy consumption from smart home sensor
network by deep learning. In: International conference on smart trends for information
technology and computer communications 2017 (pp. 255–265). Springer, Singapore.
[19] Hu S, Liu M, Fong S, Song W, Dey N, Wong R. Forecasting China future MNP by deep
learning. In: Behavior engineering and applications 2018 (pp. 169–210). Springer, Cham.
[20] Singh N, Mohanty SR. Short term price forecasting using adaptive generalized neuron
model. Int J Ambient Comput Intell (IJACI) 2018;9(3):44–56. doi:
10.4018/IJACI.2018070104. [CrossRef] [Google Scholar]
[21] Ms.Hiral Patel and Dr.Satyen Parikh (2012),“Automated News based ULIP Fund Switching
Model”, presented and published with International Conference GCEMP 2012, Awarded as
Best Technical Paper.
[22] Ms.Hiral Patel and Dr.Satyen Parikh (2012), “A Comparative Study on Financial Stock
Market Prediction Models”, Published By: The International Journal of Engineering And
Science (IJES) ||Volume|| 1 ||Issue|| 2 ||Pages|| 188-191 ||2012|| ISSN: 2319 – 1813 ISBN: 2319
– 1805 , Indexed in ANED (American National Engineering Database) Impact Factor 7.2
[23] Ms.Hiral Patel and Dr.Satyen Parikh (2014), “A Proposed prediction model for forecasting the
financial market value according different factors” , International Journal of Computer
Technology & Application (IJCTA) ISSN 2229-6093 Volume 5 Issue 1 Jan-Feb 2014. Impact
Factor – 2.015 IC Value 5.17
9ICCRDA 2020 IOP Publishing
IOP Conf. Series: Materials Science and Engineering 1022 (2021) 012022 doi:10.1088/1757-899X/1022/1/012022
[24] Ms.Hiral Patel and Dr.Satyen Parikh (2014), “A Technical and Fundamental Parameters
analysis for Financial Market Prediction Using Semantic Analysis”
[25] Ms.Hiral Patel and Dr.Satyen Parikh (2015), “Dynamic IS based Asset Allocation on Crude
Trend Analysis – exploring a Hedging Concept”, Presented and Publishing in GCEMP-15,
GFJMR. ISSN 2229 -4651
[26] Ms.Hiral Patel and Dr.Satyen Parikh (2016), “Comparative analysis of different statistical and
neural network based forecasting tools for prediction of stock data” Presented At ICTCS – 2016,
Publication (ACM Conference) ,http://dl.acm.org/citation.cfm?id=2905055.2905186
[27] Ms.Hiral Patel and Dr.Satyen Parikh (2016), “Comparative Analytical Study for News Text
Classification Techniques Applied for Stock Market Price Extrapolation”SmartCom 2016
Proceedings by Springer CCIS
[28] Ms.Hiral Patel and Dr.Satyen Parikh (2016), “Prediction Model for Stock Market using
News based different Classification, Regression and Statistical Techniques (PMSMN)”
ICTBIG 2016 IEEE Publication, 18 & 19 Oct 2016 Indore.
[29] Ms.Hiral Patel and Dr.Satyen Parikh (2017), “Experimental Study on Stock Market to
Analyse the Impact of the Latest Demonetization in India” CiiT International Journal and
Publication.
[30] Ms.Hiral Patel and Dr.Satyen Parikh (2017),“Prediction Model based on NLP and NN for
Financial Data Outcome Revelation”3rd International Young Scientist Congress (IYSC-
2017), Awarded as “Young Scientist Award”, Published in Research Journal of Computer
and Information Technology Sciences.E-ISSN:2320 – 6527
[31] Tuli, S., Tuli, S., Tuli, R., & Gill, S. S. (2020). Predicting the growth and trend of COVID-19
pandemic using machine learning and cloud computing. Internet of Things, 11, 100222.
https://doi.org/10.1016/j.iot.2020.100222
[32] Shinde, G. R., Kalamkar, A. B., Mahalle, P. N., Dey, N., Chaki, J., & Hassanien, A. E. (2020).
Forecasting Models for Coronavirus Disease (COVID-19): A Survey of the State-of-the-Art.
SN Computer Science, 1(4), 197. https://doi.org/10.1007/s42979-020-00209-9
10You can also read