Analyzing and Ranking Prevalent News over Social Media
←
→
Page content transcription
If your browser does not render page correctly, please read the page content below

IOP Conference Series: Materials Science and Engineering

PAPER • OPEN ACCESS

Analyzing and Ranking Prevalent News over Social Media
To cite this article: S. Anuja et al 2021 IOP Conf. Ser.: Mater. Sci. Eng. 1130 012072

View the article online for updates and enhancements.

                                This content was downloaded from IP address 46.4.80.155 on 13/08/2021 at 00:38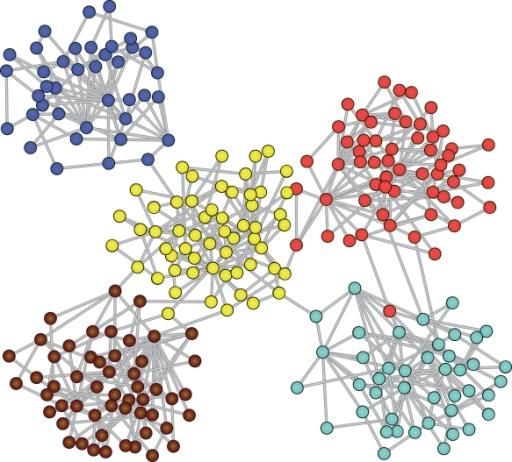
ICARSES2020                                                                                                              IOP Publishing
IOP Conf. Series: Materials Science and Engineering               1130 (2021) 012072          doi:10.1088/1757-899X/1130/1/012072

       Analyzing and Ranking Prevalent News over Social Media

                                   S. Anuja1*, G. Senthil Kumar1, Siddharth Kulshrestha1, Parth Budhia 1
                               1
                                   Department of Software Engineering, SRM Institute of Science and Technology,
                               Kattankulathur, Chennai 603203, India.
                               Email: anujas@srmist.edu.in

                                   Abstract: Since the growth of social media, news outrage over mass through social media
                                   has become evident and its control over all information sources has increased
                                   significantly. Social media services such as twitter collects enormous amounts of
                                   information and allows media companies to publish news related information as tweets.
                                   Every other big news company has its twitter account to public news in form of tweets.
                                   Beside news social media platforms has enormous amount of news attached to them as
                                   well. To make correct and better information reach to users we have to filter noise and
                                   segregate the content based on similarity and content’s respective value. Even after
                                   filtering noise, information payload exists in data so to prioritize information must be
                                   ranked in order of considered factors. In our proposed work, news are filtered and ranked
                                   based on three factors. First, media focus (MF) which tells the temporal prevalence of a
                                   particular topic in news media. Second, user attention (UA) which tells how mass is
                                   responding to the topic. Last, is the user interaction which tells how users are forming
                                   view over the topic. Our proposed work introduces an unsupervised machine learning
                                   framework which identifies news topics prevalent in both social media and the news
                                   media, and then ranks them ordering them using their degrees of MF, UA, and UI.

                               Keywords: social media, temporal prevalence, ranking, machine learning, Media focus,
                               user attention

       1.       Introduction
       With the advent of social media websites, and increasing amount of user interaction with such websites enabled
       transaction of huge volume of information among public. Users can actively discuss, choose and form their
       opinion on such social media website. With advancement of machine learning algorithms and bulk data
       processing techniques we can get twitter data analyze it and draw out conclusions related to information we
       get on social media. Approximately, all news media houses operate on twitter to distribute news to public.
       Users also act as a information source. Intersection of information generated by users and information
       generated by twitter can provide important aspects about data points. Social media platforms like twitter
       provide RESTFUL API’s using which we can connect to twitter and get the dataset of social media on real-
       time. Existing studies on sentimental analysis suggest a competitively less alternative to our system.

       Various studies on Latent Semantic analysis by T.Hofman suggests that applying probabilistic model on
       sentimental analysis increases its efficiency significantly. This led us to think about an approach which will

              Content from this work may be used under the terms of the Creative Commons Attribution 3.0 licence. Any further distribution
              of this work must maintain attribution to the author(s) and the title of the work, journal citation and DOI.
Published under licence by IOP Publishing Ltd                          1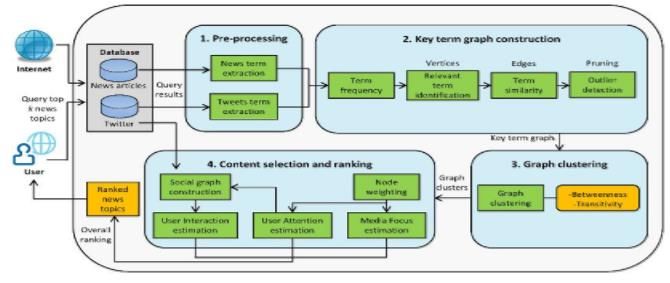
ICARSES2020                                                                                                     IOP Publishing
IOP Conf. Series: Materials Science and Engineering        1130 (2021) 012072          doi:10.1088/1757-899X/1130/1/012072

      incorporate probabilistic model by means of graph theory and calculate a score for every news in the cluster
      to relate it with clustering algorithm. Using our system one can easily analyze news over social media and
      draw out conclusions between different news. It is always good to represent datapoints over a graph. The main
      focus of study is to order and segregate news data and relate it to a mathematical model which will be conveyed
      by the graph.

      Media Focus Estimation can be estimated as follows. To appraise the MF of a TC, the news articles that are
      identified with TC are first chosen. This exhibits an issue like the determination of tweets while computing
      UA. The weighted hubs of TC are utilized to precisely select the articles that are truly identified with its inborn
      subject. The main contrast now is that as opposed to contrasting hub blends and tweet content, they are
      contrasted with the best k catchphrases chose from each article. Hashtags are of extraordinary enthusiasm to
      us due to their capability to hold the topical focal point of a tweet. In social media systems, each user is creating
      data points by either posting data or reacting to already posted data. These systems contain unintelligent
      sources of datasets which can be made intelligent by analyzing them through various viewpoints. Unintelligent
      data can make sense to some users and they can get misinterpreted information over a datapoint.

      These information are so dangerous that they can act as a rumor or false information. Social media systems do
      not provide any mechanism to filter out noise or to order a information containing news in a certain way. Many
      approaches have been found to analyze and order data over these systems by getting dataset of these systems
      and then putting computational resources to analyze this data. Our approach is different from existing ones as
      it uses computational power on real-time basis and analyze data intelligently by using algorithms. Graphs
      conveys an important evidence of relations between information’s or news. Two different pieces of information
      can be similar and can be related to each other based on dates. If a news comes out and after sometime another
      news related to that news comes out later they should not be treated as independent of each other which will
      be in case of conventional systems. To control access of data on social media we have to implement some level
      of security to our system so that our system cannot be compromised and user information can never be misused.
      We also need a mechanism to segregate news and arrange several news in a order of their popularity. Popularity
      cannot be calculated only on number of users discussing the topic it should be calculated on an intelligent
      basis.

      2.       Related works
      Probabilistic Latent Semantic Analysis [1] is a novel statistical technique for the analysis of two mode and co-
      occurrence data, which has applications in information retrieval and filtering, natural language processing,
      machine learning from text, and in related areas. Compared to standard Latent Semantic Analysis which stems
      from linear algebra and performs a Singular Value Decomposition of co-occurrence tables, the proposed
      method is based on a mixture decomposition derived from a latent class model. This result in a more principled
      approach which has a solid foundation in statistics. Keywords are extracted and clustered [2] based on different
      similarity measures using the induced k-bisecting clustering algorithm.

      The steady increase of information [3] on WWW, digital library, portal, database and local intranet, gave rise
      to the development of several methods to help user in Information Retrieval, information organization and
      browsing. Clustering algorithms are of crucial importance when there are no labels associated to textual
      information or documents. The aim of clustering algorithms, in the text mining domain, is to group documents
      concerning with the same topic into the same cluster, producing a flat or hierarchical structure of clusters.

      Twitter is a user-generated content system [4] that allows its users to share short text messages, called tweets,
      for a variety of purposes, including daily conversations, URLs sharing and information news. Considering its
      world-wide distributed network of users of any age and social condition, it represents a low-level news flashes
      portal that, in its impressive short response time, has the principal advantage.

                                                               2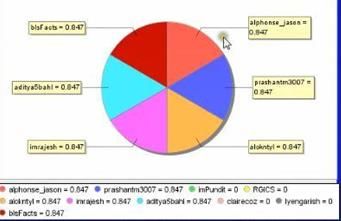
ICARSES2020                                                                                                   IOP Publishing
IOP Conf. Series: Materials Science and Engineering       1130 (2021) 012072         doi:10.1088/1757-899X/1130/1/012072

      Twitter as a new form of social media can potentially contain much useful information, but content analysis
      on Twitter has not been well studied. In particular, it is not clear whether as an information source such as
      Twitter [5] can be simply regarded as faster news feed that covers mostly the same information as traditional
      news media. In This paper we empirically compare the content of Twitter with a traditional news medium,
      New York Times, using unsupervised topic modeling. We use a Twitter-LDA model to discover topics from
      a representative sample of the entire Twitter.

      We analyze the information credibility of news [6] propagated through Twitter, a popular micro blogging
      service. Previous research has shown that most of the messages posted on Twitter are truthful, but the service
      is also used to spread misinformation and false rumors, often unintentionally. On this paper we focus on
      automatic methods for assessing the credibility of a given set of tweets. Specifically, we analyze micro blog
      postings related to “trending” topics, and classify them as credible or not credible, based on features extracted
      from them. We use features from users’ posting and re-posting (“re-tweeting”) behavior, from the text of the
      posts, and from citations to external sources. The problem of identifying rumors [7] is of practical importance
      especially in online social networks, since information can diffuse more rapidly and widely than the offline
      counterpart. In this paper, we identify characteristics of rumors by examining the following three aspects of
      diffusion: temporal, structural, and linguistic.

        3. Proposed system
      The proposed system identifies topics that are prevalent in both news and social media. It ranks topics
      according to – MF, UA and UI.It estimates user’s interest in a topic by estimating amount of time they read
      stories related to that topic. Collaborative filtering (CF) is the process of filtering or evaluating items through
      the opinions of other people.CF technology brings together the opinions of large interconnected communities
      on the web, supporting filtering of substantial quantities of data. A straightforward approach for identifying
      topics from different social and news media sources is the application of topic modeling; many methods have
      been proposed in this area, such as latent Dirichlet allocation (LDA) and probabilistic latent semantic analysis
      (PLSA). Topic modeling is, in essence, the discovery of “topics” in text corpora by clustering together
      frequently co-occurring words. This approach, however, misses out in the temporal component of prevalent
      topic detection, that is, it does not take into account how topics change with time. Furthermore, topic modeling
      and other topic detection techniques do not rank topics according to their popularity by taking into account
      their prevalence in both news media and social media. We propose an unsupervised system which effectively
      identifies news topics that are prevalent in both social media and the news media, and then ranks them by
      relevance using their degrees of MF, UA, and UI. Our project undergoes an empirical framework, comprising
      and integrating several techniques, such as keyword extraction, measures of similarity, graph clustering, and
      social network analysis. Figure 1 shows the architecture diagram of the proposed system.
      .

                                                              3
ICARSES2020 IOP Publishing
IOP Conf. Series: Materials Science and Engineering 1130 (2021) 012072 doi:10.1088/1757-899X/1130/1/012072
Figure 1. Architecture Diagram
3.1 Algorithm methodology
3.1.1Retrieval (Attribute Based Encryption)
In this stage the system will query social media server to get all queries on the basis of a keyword. Queries are
not requested in a onetime operation as we can’t let server memory to become full. Queries are requested in a
format of retrieving them one by one and a socket is established between twitter and our server. Queries come
in form of a stream and we do analysis on the stream. Algorithm used to authenticate a users account is OAuth2
without secret client id and access token user cannot make any request to the server this prevents server to
respond to unauthorized requests.
3.1.2 Oauth2
This convention enables outsider applications to concede restricted access to a HTTP benefit, either for an
asset proprietor or by enabling the outsider application to acquire access alone sake. OAuth 2 is an
authorization framework that enables applications to obtain limited access to user accounts on an HTTP
service. It works by assigning client confirmation to the administration that has the client account, and
approving outsider applications to get to the client account. OAuth 2 gives approval streams to web and work
area applications, and cell phones. Figure 2 shows the abstract protocol flow for better understanding.
Figure 2: Abstract Protocol Flow
● The application demands approval to get to benefit assets from the client
● In the event that the client approved the demand, the application gets an approval concede
4ICARSES2020 IOP Publishing
IOP Conf. Series: Materials Science and Engineering 1130 (2021) 012072 doi:10.1088/1757-899X/1130/1/012072
● The application asks for an entrance token from the approval server (API) by introducing validation
of its own personality, and the approval concede
● In the event that the application personality is verified and the approval allows is legitimate, the
approval server (API) issues an entrance token to the application. Approval is finished.
● The application asks for the asset from the asset server (API) and presents the entrance token for
verification
● On the off chance that the entrance token is substantial, the asset server (API) serves the asset to the
application.
3.2 System description
3.2.1 Client Id and Client Secret
Once your application is enlisted, the administration will issue "customer accreditations" as a customer
identifier and a customer mystery. The Client ID is a freely uncovered string that is utilized by the
administration API to recognize the application, and is likewise used to manufacture approval URLs that are
exhibited to clients. The Client Secret is utilized to verify the character of the application to the administration
API when the application solicitations to get to a client's record, and should be kept private between the
application and the API.
3.2.2 Authorization Grant
In the Abstract Protocol Flow over, the initial four stages cover acquiring an approval allow and get to token.
The approvals concede type relies upon the technique utilized by the application to ask for approval, and the
give composes upheld by the API. OAuth 2 characterizes four concede writes, every one of which is valuable
in various cases:
Approval Code: utilized with server-side Applications
Understood: utilized with Mobile Apps or Web (applications that keep running on the client's gadget)
Asset Owner Password Credentials: utilized with put stock in Applications, for example, those claimed by the
administration itself.
Customer Credentials: utilized with Applications API access.
3.2.3 Preprocessing
As data is retrieved from twitter server it stays in memory.As stated earlier we are using stream of data to be
processed concurrently so we need to store data in a temporary table before that data is preprocessed as it can
contain some smiley’s and other data which will not be consistent with encoding of what database expects it
to be.
3.2.4 Encoding Stripping
So we need to first strip and change encoding to ‘utf-8’.And remove all words which are not going to be used
for analysis like example. Then encoder checks for whole dataset to remove and convert encoding. Then whole
dataset is stored in a temporary table using a database connection. Stream of data is paused until all data points
required to analyze this data is extracted and results are saved in another permanent table.
3.2.5 Extraction of News Term
The arrangement of terms from the news information source comprises of watchwords removed from all the
questioned articles. Because of its straightforward execution and effectiveness, we execute a variation of the
mainstream Text Rank calculation to separate the best k watchwords from every news article. They chose
catchphrases are then legitimated utilizing the Word Net lemmatizer keeping in mind the end goal to consider
distinctive curved types of a word as a solitary thing. After lemmatization, all extraordinary terms are added
5ICARSES2020 IOP Publishing
IOP Conf. Series: Materials Science and Engineering 1130 (2021) 012072 doi:10.1088/1757-899X/1130/1/012072
to set N. It merits calling attention to that, since N is a set, it doesn't contain copy terms.
3.3 Wordnet lemmatizer (NLTK algorithm)
3.3.1 Extraction of Tweets Semantics
For the tweets information source, the set of terms are not the tweets' watchwords, but rather all exceptional
and significant terms. To start with, the dialect of each questioned tweet is recognized, neglecting any tweet
that isn't in English. From the rest of the tweets, all terms that show up in a stop word list or that are under
three characters long are eliminated. The grammatical form (POS) of each term in the tweets is at that point
distinguished utilizing a POS tagger. This POS tagger is particularly valuable since it can recognize Twitter-
particular POSs, for example, hashtags, notices, and emoji images. Hashtags are of awesome enthusiasm to us
in light of their potential to hold the topical focal point of a tweet. Be that as it may, hashtags typically contain
a few words consolidated, which must be fragmented keeping in mind the end goal to be valuable. To take
care of this issue, we make utilization of the Viterbi division calculation. The fragmented terms are then labeled
as "hashtag." To dispense with terms that are not applicable, just terms labeled as hashtag, thing, descriptive
word or verb are chosen. The terms are then lemmatized and added to set T, which speaks to all novel terms
that show up in tweets from dates d1 to d2.
3.4 VITERBI algorithm
The Viterbi calculation is a dynamic programming calculation for finding the no doubt succession of shrouded
states—called the Viterbi way—that outcomes in an arrangement of watched occasions, particularly with
regards to Markov data sources and concealed Markov models.
"Viterbi algorithm" have turned out to be standard terms for the utilization of dynamic programming
calculations to boost issues including probabilities
3.4.1 Identification Of Terms
Much research has been done in the field of theme distinguishing proof—alluded to all the more
formally as subject demonstrating. Two conventional strategies for recognizing points are LDA and PLSA.
LDA is a generative probabilistic model that can be connected to various errands, including point ID. PLSA,
likewise, is a measurable strategy, which can likewise be connected to theme demonstrating. In these
methodologies, be that as it may, temporal data is lost, which is fundamental in recognizing common subjects
and is an essential normal for social media information. Besides, LDA and PLSA just find topics from content
corpora; they don't rank in view of prevalence or predominance.
3.4.2 Twitter-LDA
Latent Dirichlet Allocation (LDA) has been generally utilized as a part of printed examination. The first LDA
is utilized to discover concealed "points" in the archives, where a theme is a subject like "expressions" or
"training" that is talked about in the reports. The first setting in LDA, where each word has a theme mark, may
not function admirably with Twitter as tweets are short and a solitary tweet will probably discuss one point.
Thus, Twitter-LDA (T-LDA) has been proposed to address this issue. T-LDA likewise addresses the boisterous
idea of tweets, where it catches foundation words in tweets. Analyses have demonstrated that T-LDA could
catch more significant points than LDA in Microblogs. T-LDA has been broadly utilized as a part of numerous
applications including angle mining, client displaying, bursty point identification, and key phrase extraction.
3.4.3 Term Extraction
Concerning the field of catchphrase or educational term extraction, numerous unsupervised and regulated
techniques have been proposed. Unsupervised techniques for watchword extraction depend exclusively on
certain data found in singular writings or in content corpus. Managed techniques, then again, make
utilization of preparing datasets that have just been ordered.Among the unsupervised techniques, there are
6ICARSES2020 IOP Publishing
IOP Conf. Series: Materials Science and Engineering 1130 (2021) 012072 doi:10.1088/1757-899X/1130/1/012072
those that utilize factual measures of term usefulness or importance, for example, term specificity.
3.4.4 Stop Word Removal
Stop words are the words we need to sift through before preparing the classifier. These are generally high
recurrence words that aren't giving any extra data to our marking. Indeed, they really confound our classifier.
In English, they could be the, is, at, which.
3.5 Stemming technique
“Stemming is the process for reducing inflected words to their word stem (base form).”The classifier
doesn't comprehend that the verbs contributing and contributed are the same, and regards them as various
words with various frequencies. By stemming them, it bunches the frequencies of various intonations to only
one term. Since some of stop words in content ought to be stemmed by a stemmer and can't be separated by
given stop words any longer. For instance, "was" transforms into "wa" by doorman stemmer and when you
stemmed first before evacuating stop words "wa" stays in your vector in the wake of sifting stop words which
has "was" as a stop word. On the other hand, you can run a similar stemmer on your set stop words and after
that procedure with stop words on stemmed content. It runs stemming on given stop words rundown to serve
there aces, yet essentially it isn't a smart thought to put stemming on stop words on the grounds that stop words
are not generally only a rundown of tokens from a characteristic dialect like English however some of the time
they are area particular words or some others given by practicians and can't be judged by such tool boxes. In
this manner, expelling stop words in unique frame must be done before running stemmer.
3.6 TF-IDF algorithm
TFIDF (Term frequency inverse document frequency) helps to determine word importance relative to the
whole document. Assume you need to compress an archive or a section utilizing couple of watchwords. One
procedure is to pick the most as often as possible happening terms (words with high term recurrence or tf).Be
that as it may, the most incessant word is a less valuable metric since a few words like 'this', 'a' happen every
now and again over all archives.
Subsequently, we additionally need a measure of how remarkable a word is i.e. how occasionally the word
happens over all reports (opposite archive recurrence or idf).Henceforth, the result of (tf x idf) (tfidf) of a word
gives a result of how visit this word is in the report duplicated by how one of a kind the word is w.r.t. the whole
corpus of reports. Words in the record with a high tfidf score happen much of the time in the archive and give
the most data about that particular report. In the wake of sifting through the stop words, we can stem the rest
of the words utilizing the regular hub library, which isn't just a stemming library, it's an entire toolset for
common dialect content preparing.
It figures the (inquiry, report) likeness. It has two sections.
TF Score (Term Frequency)
Thinks about reports as sack of words, rationalist to request of words. An archive with 10 events of the term
is more pertinent than a record with term recurrence 1. Be that as it may, it isn't 10 times more applicable,
significance isn't corresponding to recurrence
2. IDF Score (Inverse Document Frequency)
We likewise need to utilize the recurrence of the term in the gathering for weighting and positioning.
Uncommon terms are more instructive than visit terms. We need low positive weights for visit terms and high
weights for uncommon terms.
Consolidating these two we estimate a tf score and an idf score. We ascertain these scores in the log-scale as
follows.
The log term freq. of a term t in d is characterized as
1+log(1+tft,d)
The log opposite archive recurrence which measures the usefulness of a term is characterized as:
7ICARSES2020 IOP Publishing
IOP Conf. Series: Materials Science and Engineering 1130 (2021) 012072 doi:10.1088/1757-899X/1130/1/012072
idft=log10Ndft
Where N is the total number of documents in the collection combining the two, the tf-idf score is
given by, wt,d=(1+log(1+tft,d)).log10Ndft.
Finally the tf.idf score increments with number of events inside a record.The tf.idf score increments
with uncommonness of terms in the gathering.
3.7 Co-occurrence similarity
The co-occurrence relationship of incessant word sets from a solitary archive may give factual data to help in
the ID of the archive's catchphrases. They recommended that if the prob-capacity dispersion of co-event
between a term x what not different terms in an archive is one-sided to a specific subset of visit terms, at that
point term x is probably going to be a watchword. Indeed despite the fact that our goal isn't to utilize co-event
for key- word extraction, this speculation accentuates the significance of co-event connections. We can find
connections between news using CO-OCCURRENCE DOUBLE CHECKING algorithm.
3.8 Major graph construction
In this part, a graph G is built, whose grouped hubs speak to the most common news themes in both news
furthermore, web-based social networking. The vertices in G are extraordinary terms chose from N and T,
and the edges are spoken to by a relationship between these terms. In the accompanying segments, we
characterize a strategy for choosing the terms and build up a relationship between them. After the terms and
connections are recognized, the chart is pruned by sifting through irrelevant vertices and edges.
Formally, given an informational collection, the objective of bunching is to partition the informational
collection into bunches with the end goal that the components appointed to a specific bunch are comparative
or associated in a few predefined senses. Nonetheless, not all graphs have a structure with normal bunches.
In any case, a bunching calculation yields a bunching for any info diagram. On the off chance that the structure
of the chart is totally uniform, with the edges equally circulated over the arrangement of vertices, the grouping
processed by any calculation will be somewhat discretionary. Quality measures – and if attainable,
perceptions – will decide regardless of whether there are huge bunches show in the diagram what's more,
regardless of whether a given grouping uncovers them or not.
3.9 Graph clustering
We have used HCS clustering algorithms to find disjoint of graphs to segregate news topics. The HCS(Highly
associated sub graphs) (otherwise called the HCS calculation , and different names, for example, Highly
Connected Clusters/Components/Kernels) is a calculation in light of diagram availability for group
investigation, by first speaking to the similitude information in a compatibility chart, and a short time later
discovering all the exceptionally associated sub graphs as bunches. When chart G has been developed and its
generally huge terms (vertices) and term-combine co-event esteems (edges) have been chosen, the following
objective is to distinguish and partitioned all around characterized TCs (sub graphs) in the chart. Before
clarifying the chart grouping calculation, the ideas of betweenness what's more, transitivity should first be
comprehended.
We apply the ideas of betweenness and transitivity in our chart bunching calculation, which disambiguates
potential subjects. The edge-evacuating process is ceased while expelling additional edges yields no
advantage to the bunching nature of the diagram. This happens: 1) when the transitivity of G after evacuating
an edge is lower than it was previously or 2) when the most extreme edge betweenness is not as much as the
normal—the latter demonstrating that the most extreme betweenness is considered typical when contrasted
with the normal. Once the procedure has been halted, the last-expelled edge is added back to G.It can be seen
8ICARSES2020 IOP Publishing
IOP Conf. Series: Materials Science and Engineering 1130 (2021) 012072 doi:10.1088/1757-899X/1130/1/012072
that the edge that associated the terms knox and evidence (notwithstanding different edges) has been
evacuated. Figure 3 shows the cluster depiction. Despite the fact that the precision of the calculation isn't
100% (i.e., a couple of points may stay vague), its execution is attractive for our necessities.
Figure:3 graph-clustering cluster depiction
3.10 Selection and ranking of news
The TCs from the diagram are chosen and positioned utilizing the three significance factors (MF, UA, and
UI).
Since the predominant news-TCs that fall inside dates d1 also, d2 have been distinguished, applicable
substance from the two media sources that is identified with these points must be chosen lastly positioned.
Related things from the news media will speak to the MF of the theme. Correspondingly, related things from
web-based social networking (Twitter) will speak to the UA—more specifically, the quantity of extraordinary
Twitter clients identified with the chose tweets. Choosing the suitable things (i.e., tweets and news articles)
identified with the key terms of a point isn't a simple undertaking, the same number of different things random
to the coveted theme additionally contain comparative key terms.
3.10.1 Node-Weighting
The initial step before choosing appropriate content is to weight the hubs of every point in like manner. These
weights can be utilized to evaluate which terms are more critical to the theme and give understanding into
which of them must be available in a thing for it to be considered subject pertinent. The heaviness of every
hub 1 in TC is figured utilizing, which uses the quantity of edges associated with a given hub what's more,
and their comparing weights.
3.10.2 Estimation Of User Attention
To ascertain the UA measure of a TC, the tweets identified with that theme are first chosen and at that point
the quantity of novel clients who made those tweets is tallied. To guarantee that the tweets are really identified
with TC, the heaviness of every hub in TC is used.
3.10.3 Estimation Of User Interaction
The subsequent stage is to measure the level of cooperation between the clients dependable for the online
networking content creation identified with a particular point. The database is questioned for "follow"
connections for each of these clients and an informal community chart is developed from these connections.
In Twitter, there are two kinds of connection: 1) "follow" and 2) followed. In the main sort, client u1 can take
after client u2, in which case the bearing of the relationship streams from u1 to u2. In the second case, client
u1 can be trailed by client u2; the heading of the relationship now streams from u2 to u1.
9ICARSES2020 IOP Publishing
IOP Conf. Series: Materials Science and Engineering 1130 (2021) 012072 doi:10.1088/1757-899X/1130/1/012072
4. Results and analysis
The objective of our technique is to distinguish, combine and rank the most pervasive themes talked about in
both news media and online networking amid a particular timeframe. To accomplish its objective, the
framework must experience four fundamental stages namely preprocessing, key term graph construction, graph
clustering & content selection and rank. In preprocessing the key terms are separated and sifted from news and
social information relating to a specific timeframe. And in stage two namely, key term graph construction a
diagram is built from the already separated key term set, whose vertices speak to the key terms and edges speak
to the co-event closeness between them. The diagram, in the wake of handling and pruning, contains marginally
joint bunches of points well known in both news media and online networking. In graph clustering the diagram
is bunched with a specific end goal to get very much characterized and disjoint TCs. Finally, in Content
Selection and Ranking the TCs from the diagram are chosen and positioned utilizing the three pertinence
factors (MF, UA, and UI). At first, news and tweets information are crept from the Internet and put away in a
database. News articles are gotten from particular news sites through their RSS channels and tweets are crept
from the Twitter open course of events. A client at that point asks for a yield of the best k positioned news
points for a predefined time frame between date d1 (begin) and date d2 (end). Several advantages are there by
using above techniques over conventional system. It is easy to find a way to filter noise and only capture the
news. News can be filtered based on the topic. It has the potential to improve the quality and coverage of news
recommender system.
Figure:4 Sample tweets
Figure: 5 Top 10 prevalent news.
In experiment analysis, keywords are used from news media sources (for a specified period of time) to identify
the overlap with social media from that same period. We then build a graph whose nodes represent these
10ICARSES2020 IOP Publishing
IOP Conf. Series: Materials Science and Engineering 1130 (2021) 012072 doi:10.1088/1757-899X/1130/1/012072
keywords and whose edges depict their co-occurrences in social media.-The graph is then clustered to clearly
identify distinct topics. After obtaining well-separated topic clusters (TCs), the factors that signify their
importance are calculated: MF, UA, and UI. Finally, the topics are ranked by an overall measure that combines
these three factors. Final result will include top 10 prevalent news topics ranked according to perspectives
discussed earlier.
5. Conclusion
Our framework can help news suppliers by giving criticism of points that have been suspended by the broad
communications, yet are as yet being talked about by the all inclusive community. Our framework can likewise
be stretched out and adjusted to different themes other than news, for example, science, innovation, sports, and
different patterns. We have performed broad trials to test the performance of our project, including controlled
trials for its distinctive parts. Our project has been contrasted with media concentrate just positioning by using
comes about got from a manual voting strategy as the ground truth. In the voting strategy, 20 people were
requested to rank points from determined time periods in light of their apparent significance. The assessment
gives prove that our strategy is able to do adequately choosing common news points and positioning them in
light of the three beforehand specified measures of significance. The proposed work presents an unmistakable
refinement between positioning subjects by MF just and positioning them by including UA and UI.This
distinction gives a premise to the significance of this paper and obviously shows the weaknesses of depending
exclusively on the broad communications for theme positioning. As future work, we plan to perform tests and
extend our project on various zones and datasets. Besides, we intend to incorporate different types of UA, for
example, web index navigate rates, which can likewise be coordinated into our strategy to give significantly
more understanding into the genuine intrigue of clients. Extra analyses will likewise be performed in diverse
phases of the approach. For instance, a fuzzy-bunching methodology could be utilized with a specific end goal
to get overlapping TCs. In conclusion, we plan to build up a customized rendition of our project, where points
are displayed contrastingly to every individual client.
References
[1] D. M. Blei, A. Y. Ng, and M. I. Jordan, “Latent Dirichlet allocation,” J. Mach. Learn. Res., vol. 3,
pp. 993–1022, Jan. 2003.
[2] T. Hofmann, “Probabilistic latent semantic analysis,” in Proc. 15th Conf. Uncertainty Artif. Intell.,
1999, pp. 289–296.
[3] T. Hofmann, “Probabilistic latent semantic indexing,” in Proc. 22nd Annu. Int. ACM SIGIR Conf.
Res. Develop. Inf. Retrieval, Berkeley, CA, USA, 1999, pp. 50–57.
[4] C. Wartena and R. Brussee, “Topic detection by clustering keywords,” in Proc. 19th Int. Workshop
Database Expert Syst. Appl. (DEXA), Turin, Italy, 2008, pp. 54–58.
[5] F. Archetti, P. Campanelli, E. Fersini, and E. Messina, “A hierarchical document clustering
environment based on the induced bisecting k-means,” in Proc. 7th Int. Conf. Flexible Query
Answering Syst., Milan, Italy, 2006, pp. 257–269. [Online].
Available:http://dx.doi.org/10.1007/11766254_22.
[6] C. D. Manning and H. Schütze, Foundations of Statistical Natural Language Processing.
Cambridge, MA, USA: MIT Press, 1999.
[7] M. Cataldi, L. Di Caro, and C. Schifanella, “Emerging topic detection on Twitter based on
temporal and social terms evaluation,” in Proc. 10th Int. Workshop Multimedia Data Min.
(MDMKDD),Washington, DC, USA, 2010, Art. no. 4. [Online].
Available:http://doi.acm.org/10.1145/1814245.1814249.
[8] W. X. Zhao et al., “Comparing Twitter and traditional media using topic models,” in Advances in
Information Retrieval. Heidelberg, Germany: Springer Berlin Heidelberg, 2011, pp. 338–349.
[9] Q. Diao, J. Jiang, F. Zhu, and E.-P. Lim, “Finding bursty topics from microblogs,” in Proc. 50th
Annu. Meeting Assoc. Comput. Linguist. Long Papers, vol. 1. 2012, pp. 536–544
11You can also read