Why do you wear a face mask? Taiwanese public epidemic awareness of COVID-19 from social media behavior
←
→
Page content transcription
If your browser does not render page correctly, please read the page content below
Why do you wear a face mask? Taiwanese public epidemic awareness
of COVID-19 from social media behavior
Chih-Yu Chin ( king@cycu.edu.tw )
Chung Yuan Christian University https://orcid.org/0000-0002-4437-0201
Chang-Pan Liu
Mackay Medical College
Cheng-Lung Wang
Big Data Co., Ltd
Research article
Keywords: COVID-19, face mask, Google search volume index, public epidemic awareness, social media, Taiwan
DOI: https://doi.org/10.21203/rs.3.rs-21186/v1
License: This work is licensed under a Creative Commons Attribution 4.0 International License. Read Full License
Page 1/13Abstract
Background
Facing the COVID-19 epidemic, Taiwan has demonstrated resilience at the initial stage of epidemic prevention and effectively slowed down its
spread. This study aims to capture public epidemic awareness toward the COVID-19 through collecting social media- and Internet-based data
and elaborate on how the public epidemic awareness rose and played a role in the epidemic prevention in Taiwan during the initial course of
COVID-19 spread.
Methods
Using the Google search query volume of COVID-19 and face mask as indicators of public epidemic awareness, we collected the volume of
news reports and the mentions on social media about COVID-19 and face masks between December 31, 2019, and February 29, 2020, through
big data analysis and sorted the daily total con rmed cases of COVID-19 worldwide and in Taiwan as well as critical mask-related measures
implemented by the Taiwanese government to plot the trends in this information and conduct correlation analysis. Additionally, the content
analysis was adopted to analyze the transmission of different types of fear information of COVID-19 between December 31, 2019, and March
29, 2020, and their effects on the public.
Results
The Google search query volume of COVID-19 and face mask was signi cantly correlated with the number of con rmed cases in Taiwan, the
number of news reports on COVID-19 (correlation coe cient: .74–.90). Since the rst con rmed cases of COVID-19, public epidemic awareness
has increased rapidly, prompting the government to formulate relevant emergency measures. Additionally, the ndings from content analysis
suggested that the fear of the loss of control best explains why panic behavior occurs in public.
Conclusions
Confronting the highly infectious COVID-19, public epidemic awareness is vital. While fear is an inevitable product when an emerging infectious
disease occurs, the government can convert resistance into assistance by understanding why fear arises and which fear factors cause
excessive panic in public. Moreover, online social media promptly re ect public epidemic awareness, which can be used as a reference for
epidemic prevention; this urges the government to deal with the crisis in the form of public opinion.
Background
The coronavirus disease 2019 (COVID-19) epidemic broke out in December 2019 in Wuhan, Hubei, China, and then spread worldwide. So far, the
spread of COVID-19 can be generally split into two phases. In the initial course of the COVID-19 epidemic, China, and other Asian countries such
as Korea, Japan, and Iran were regarded as highly hazardous area due to the large number of con rmed cases of COVID-19. However, the
development of the COVID-19 epidemic seems to enter a new phase in March. In addition to Asian countries, the high speed of transmission and
a vast number of con rmed cases of the COVID-19 started to occur in European countries, the United States.1 Additionally, On March 3, 2020,
WHO director-general, Tedros Adhanom, said that “In the last 24 hours there were almost nine times more cases reported outside China than
inside China.”2 Given the global spread, the COVID-19 has been declared as a worldwide pandemic on March 11, 2020. As of March 31,
approximately 750,890 people worldwide were infected, and more than 170 countries have been affected.3 COVID-19 has become the world’s
leading threat; therefore, implementing effective strategies to prevent the spread of COVID-19 has become a topic of discussion and research by
governments and academia worldwide.
Owing to its geographical location and historical background, Taiwan is closely associated with China. Most arrivals in Taiwan come from
China, reaching 2.71 million per year.4 Taiwan was expected to be the second-highest risk for COVID-19 outside China.5 As of March 31, there
were 322 con rmed cases of COVID-19 in Taiwan. Of the con rmed cases, 276 are imported, and 46 are indigenous.6 Regarding the total
con rmed cases of COVID-19, Taiwan ranked 77th worldwide1, suggesting that the Taiwanese government achieved early control of imported or
indigenous cases.7 As COVID-19 is more contagious than severe acute respiratory syndrome (SARS) and is infectious even through
asymptomatic carriers8, earlier public epidemic awareness may be another key to comprehensive prevention apart from government measures.
Since public epidemic prevention may provide simple, low-cost, and effective ways of reducing the transmission and impact of the COVID-19
epidemic,9 it is necessary to understand how the public perceives the threat of COVID-19 and the reasons which cause COVID-19 to be
threatening. A previous study proved that fear could arouse vigilance against threats to an individual. This leads the individual to employ
measures to protect themself from harm.10 Many public health information campaigns often use fear to improve health management in
public.11 However, excessive anxiety in society in the face of emerging infectious diseases or major disasters may lead to more social and
Page 2/13economic problems. For example, during the SARS epidemic, US citizens stigmatized certain races or regions, erecting a barrier between
people.12
Moreover, fear also decreases the willingness for human-to-human interactions, thereby affecting economic activity.13 Shortages in medical
supplies or other supplies may even cause panic buying.14 In this case, the idiom, “the same knife cuts bread and ngers,” is truly applicable.
Effective control over fear of the COVID-19 epidemic to improve the public’s infection control awareness while avoiding excessive panic, which
may result in external effects on the society and economy, is an important matter that the government must consider during epidemic control.15
Given that, how the government monitors public epidemic awareness of emerging infectious diseases is particularly important. Previously,
cross-sectional telephone surveys were used to measure public awareness of diseases.16 While it provided valuable information about public
perceptions at the time, it is hard to survey continuously throughout epidemic spread due to cost-effectiveness. With the development of the
Internet and information communication technology, a web-based methodology has been used to capture public awareness promptly. Browsing,
commenting, and various online behaviors represent free thoughts as the user’s online activities can be tracked and recorded. Different online
actions are evaluated to explore public awareness of diseases, thereby providing new perspectives to monitor public health.17 Researchers have
used the methodology to observe correlations between public anxiety and u-related information-seeking behavior18 or between the number of
con rmed in uenza cases and disease information-seeking behavior to examine whether in uenza outbreaks can be detected early through
disease information-seeking behavior.19 To detect the social response to emerging infectious diseases, these online behaviors not only capture
public opinion in a timely manner but also reveal changes in public attention and attitudes to disease-related issues. The collection and
interpretation of such information are helpful to governments managing public crises.
This naturalistic study aims to capture public epidemic awareness toward the COVID-19 through collecting social media- and Internet-based
data and elaborate on how the public epidemic awareness rose and played a role in the epidemic prevention in Taiwan during COVID-19 spread.
Given that related treatment drugs and vaccines for COVID-19 are still under clinical trials,20 face masks have become necessary personal
protective equipment for managing infectious diseases.21,22 Moreover, increasing face mask use indicates that the public is aware of the threat
and re ect other positive hygiene practices.23,24 Thus, we reviewed changes in the con rmed cases of COVID-19 worldwide and Taiwan, the
number of news reports on COVID-19, the volume of the mentions of COVID-19 and face masks on social media, and the Google search volume
index of COVID-19 and face masks during the rst stage of COVID-19 epidemic (between December 31, 2019, and February 29, 2020).
Additionally, this study attempted to analyze the transmission of different types of fear information of COVID-19 from December 31, 2019, to
March 29, 2020, and their effects on the public by conducting a content analysis. By doing so, the purpose of the study is to obtain valuable
experience based on Taiwan’s response to COVID-19 to aid the government or public in overcoming the COVID-19, or infectious diseases that
may emerge in the future.
Methods
Study one: Data collection
While the development of the COVID-19 epidemic has entered a new phase in March, the rst study aims to address the issue of how the earlier
public epidemic rise and change in the rst stage of the COVID-19 epidemic spread. Thus, we continuously collected data of the following seven
indicators between December 31, 2019, and February 29, 2020: total global con rmed cases, total con rmed cases in Taiwan, number of news
reports on COVID-19, volume of the mentions of COVID-19 on social media, volume of the mentions of face masks on social media, Google
search query volume of COVID-19, and Google search query volume of face masks.
The total global con rmed cases data were mainly collected through the real-time global cases website of System Science and Engineering
Center, Johns Hopkins University25. Because the site was not completed until January 20, the number of con rmed cases between December 31
and January 19 was based on the source from Wikipedia26. The total con rmed cases in Taiwan was based on the daily press conference
convened by TCDC and simultaneous press releases27.
Data on the number of news reports on COVID-19, the volume of the mentions of COVID-19 on social media, and the volume of the mentions of
face mask on social media were collected through KEYPO Big Data Analytics Engine28, Taiwan’s well-known online public opinion system. The
former represents the number of news reports on COVID-19, whereas the latter two represent the number of mentions of COVID-19 and face
mask in posts and comments on social media. A higher number of mentions on social media indicate a higher degree of discussion.
The Google search query volume of COVID-19 and Google search query volume of face masks were acquired through the Google Trends search
service, with the search area set to Taiwan and the search time set within the research period. Google Trends provides a normalized value
according to the set time range, with a scale of 0–100. A daily search volume of 100 is the highest value for the keyword within that time range.
Page 3/13To compare the above indicators in a trend chart with the same scale, other indicators were normalized using the same method, with the scale
ranging from 0 to 100.
Study one: Statistical analysis
Apart from plotting the trend chart to depict the synchrony among the seven indicators by trend chart, the Pearson product-moment correlation
was used to measures how two continuous variables co-vary over time and indicate the linear relationship as a number between -1 (negatively
correlated) to 0 (not correlated) to 1 (perfectly correlated).
Study two: Data collection
To further investigate what types of fear were imbedded in COVID-19-related popular events in Taiwan and how these types of fear have an
impact on public epidemic awareness across the whole periods of epidemic spread from December 31, 2019, to March 29, 2020 (the date of
latest data collected in the study), a content analysis was adopted in the study.
To select representative popular events among the past 90 days, we screened COVID-19-related popular daily events by using KEYPO Big Data
Analytics Engine.28 The time range for popular event samples was from 31 December 2019 to 29 March 2020, and the total sample size was
359 events.
The function of categorization is to classify the content of the study subjects into groups, in order to endow symbolic meaning. Regarding the
categorization of fear, Although there are various differences in an individual’s ability to determine whether an event is a threat, many
researchers who study risk perception and fear believe that people tend to fear similar things due to similar factors based on human
instinct.10,29,30,31 After reviewing these studies and examining collected events, the study constructed “fear type” categories, including mistrust,
severity, loss of control, uncertainty, susceptibility, and without fear. For details, please refer to additional le 1.
Study two: Statistical analysis
In order to examine the associations between different types of fear events and public fear behavioral markers, Google search volume of face
masks was gathered, and one-way ANOVA was used. This was done to analyze whether there were differences in the Google search volume of
face masks on a day when different types of fear events occurred. Scheffé’s method was used for post hoc multiple comparisons. Since
Levene’s test for equality of variances was found to be violated for the present analysis, F(5,353) = 12.14, p < .05, the study used the bootstrap
method, a resampling method, to derive parameter estimates of standard errors and con dence intervals, and correct biases.32
Additionally, to extend our analysis to the correlation between mask search volume at different periods and the number of various types of fear
events, we used a threshold value of 25 for Google mask search volume, which was used to divide the period of this study into three stages.
These periods are namely: the rst stage (2019/12/31–2020/1/26, 27 days), the second stage (2020/1/27–2/22, 27 days), and the third stage
(2020/2/23–3/29, 36 days). There are signi cant differences in the Google face mask search volume among the three stages by One-way
ANOVA (Additional le 2). The rst stage is the low search volume group (M = 4.33, SD = 6.87), the second stage is the high search volume
group (M = 45.19, SD = 21.47), and the third stage is the medium search volume group (M = 25.55, SD = 5.20). After differentiating these three
stages, the Chi-square test and multinomial logistic regression were used to examine differences in the number of different types of fear events
among the different stages.
Results
Imported overseas cases in the early stage: the rise of public epidemic awareness
Table 1 shows the correlations among total global and Taiwanese con rmed cases, the volume of the mentions on social media, number of
news reports, and Google search query volume from the o cial press release on COVID-19 issued by the government (December 31) to the
implementation of a new mask rationing system (February 6). The correlation coe cients among the seven variables were between .55 and .97.
In the early stage of the epidemic spread, the correlation coe cients between the total Taiwanese con rmed cases and number of news reports
(r = .92), volume of the mentions of COVID-19 on social media (r = .92), the volume of the mentions of face masks on social media (r = .92),
Google search query volume of COVID-19 (r = .76), and Google search query volume of face masks (r = .90) were signi cant and high,
suggesting that the news media and the public attached great importance to the imported cases of COVID-19 in Taiwan.
Page 4/13Table 1. Pearson correlation coefficients among the seven variables
N = 38 2 3 4 5 6 7
1. Global total confirmed .94 .79 .80 .81 .55 .74
cases of COVID-19
2. Total confirmed cases - .92 .92 .92 .76 .90
of COVID-19 in
Taiwan
3. Volume of the - .91 .97 .91 .88
mentions of COVID-
19 on social media
4. Volume of the - .93 .81 .95
mentions of face
masks on social
media
5. Number of news - .84 .89
reports on COVID-19
6. Google search query - .83
volume of COVID-19
7. Google search query -
volume of face masks
Note: All values are significant at the .05 level.
Data collected between December 31 and February 6 were used.
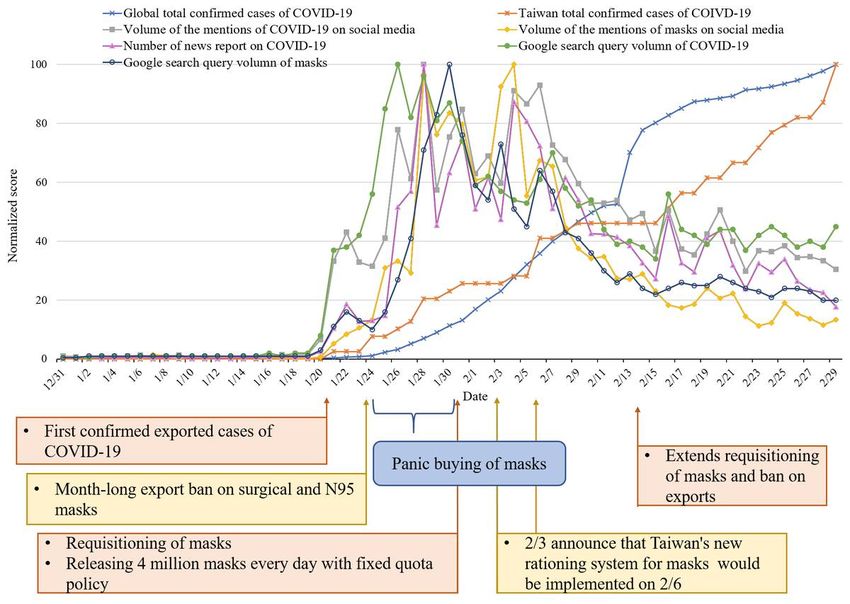
Figure 1 shows that when Taiwan announced its rst con rmed case on January 21, it aroused the rst wave of news media reports and
attention to COVID-19 on social media and prompted the public to search for COVID-19 and mask-related information on social media. After two
more cases were added on January 24, the news media and the volume on social media climaxed again. The attention of the news media
toward COVID-19 continued to increase, as did the volume of discussion on COVID-19 on social media. Thus, social media rapidly promoted
discussion of the topics in news reports, and there was a high correlation between the number of news reports and the volume of the mentions
of COVID-19 on social media (r = .97). Since the spread of COVID-19 to Taiwan, its Google search query volume peaked in less than ve days
(January 25), and the number of news reports and the volume of mentions on social media also peaked on January 28 when the rst con rmed
local case in Taiwan was identi ed as a household infection.
The new form of public epidemic awareness
Although the correlation between the Google search query volume of COVID-19 and face masks (r = 0.83) was quite high, the trend chart showed
that the rising period and time of reaching a peak were not the same.
Figure 1 shows that the volume of the mentions of face masks on social media and Google search query volume of face masks increased on
January 24 after the government implemented the export ban on face masks and reached peaks on January 28 and January 31, respectively. In
this period, the government released 6 million epidemic prevention face masks for sale in convenience stores daily on January 28–30, with a
purchase limit of three face masks per person at a price of NT $8 per face mask. The second local case of household transmission occurred on
January 31, and the WHO declared the outbreak to be a public health emergency of international concern on the same day. Furthermore, in the
week of January 24–31, among the top 25 keywords of rising searches on Google Trends, seven were related to face masks, especially “medical
face masks,” “where to buy,” and “names of each face mask shop.” This implies that public epidemic awareness began to increase in just a few
days, from the perception of the importance of COVID-19 (Google search for COVID-19) to the perception of its threat and the adoption of
protective measures (Google search for face masks).
Page 5/13It shows that new local cases, the government’s emergency release of face masks, and lax purchase restrictions on face masks have aroused a
public sense of insecurity and anxiety created by the increased chance of potential infection and the public quickly buying face masks. The
phenomenon of panic buying of face masks was reported by news media during that period.33
The implement of name-based rationing system for face masks
Public complaints also prompted the government to increase the allocation of resources for mask-related epidemic prevention materials. The
government took emergency measures on January 31, including the daily collection of 4 million face masks from manufacturers, of which 2.6
million were for the public and sold through convenience stores, drugstores, and related chain stores, with a purchase limit of three face masks
per person per day at a uni ed price of NT $6 per face mask on February 1.34 Subsequently, the government launched a name-based rationing
system for face masks on February 6. Based on the principles of prioritizing healthcare workers and ensuring equal purchase opportunities for
all, the government adopted the method of uni ed collection, allocation, and price, and stipulated a purchase limit. Each person is allowed to
buy two masks per National Health Insurance card (for identi cation) at a price of NT$5 per face mask in a week.35 The response measure is to
ensure that the Taiwanese are protected from other people’s hoarding of goods and to avoid the more signi cant social burden caused by those
who intend to drive up prices. After the policy was put in place, the government and the public worked together to create open data applications
such as Face Mask Maps to enable the public to quickly nd sales locations and inventory, thereby improving the e ciency of buying face
masks, reducing the negative impact of long queues and inability to buy face masks, and making proper use of information technology to
achieve epidemic prevention.36
After the implementation of the new mask rationing system, the government also successively put forward some face mask countermeasures
such as increasing collection, extending the export ban, adding production lines, and increasing the purchasing limit of face masks to three face
masks per person per week (TCDC, 2020 March 2),37,38 which were expected to enable everyone to have face masks and protect themselves.
Such positive actions have reduced public anxiety about not being able to buy face masks; accordingly, the volume of the mentions and search
query of face masks have dropped signi cantly and become less affected by new cases of infection. More recently, an “name-based rationing
system for face masks new version 2.0” was implemented in which the online ordering mechanism was added on March 12.39 The purpose of
this new mechanism is to ensure even distribution better and make it more convenient to obtain face masks for people such as o ce workers
and students who lack time to go to pharmacies and public health centers. From the perspective of crisis management, these face mask
countermeasures not only achieve a cogent allocation of medical resources and reduce the possibility of infection but also take into account the
panic of the public so that the people have su cient control over the purchase of face masks, thus preventing the epidemic of fear.
The period of highest Google search query volume of face masks and the loss of control
According to the results of the ANOVA (Table 2), the types of fear had a signi cant effect on Google search query volume of “face masks”
[F(3,358) = 5.67, p < .05]. Moreover, the results from post hoc comparisons using the Scheffé test with bootstrap method (Table 3) indicated that
only the mean score for the loss of control group (M = 42.65, SD = 26.12) was signi cantly different from the other groups (M = 26.73, SD =
14.61, for mistrust; M = 24.65, SD = 18.38, for severity; M = 22.08, SD = 21.20, for uncertainty; M = 26.12, SD = 12.10, for susceptibility; M =
25.77, SD = 8.67, for without fear).
Table 2. The result of one-way analysis of variance
Sum of squares df Mean square F p
Between groups 6163.83 5 1232.77 5.67Table 3. Post hoc Scheffé test with the bootstrap method
Descriptive statistics Multiple comparison a
N Mean SD 2b 3b 4b 5b 6b
1. Mistrust 48 26.73 14.61 2.08 (3.31) -15.92* (3.92) 4.65 (3.18) 0.62 (2.49) 0.96 (2.65)
2. Severity 34 24.65 18.38 - -18.00* (4.16) 2.57 (3.46) -1.47 (2.84) -1.12 (2.98)
3. Loss of control 20 42.65 26.12 - 20.57* (4.06) 16.54* (3.54) 16.88* (3.66)
4. Uncertainty 39 22.08 21.20 - -4.04 (2.69) -3.69 (2.84)
5. Susceptibility 131 26.12 12.10 - 0.34 (2.04)
6. Without fear 87 25.77 8.67 -
Note . Values in parentheses are bootstrap standard error.
a Post hoc Scheffé test with the bootstrap method was used.
b The reference group for the multiple comparisons of mean
* The mean difference in bold is significant at the .05 level.
Changes in the number of different fear events at different periods
A Pearson chi-square test was performed to examine the change in the proportion of events in different types of fear across various time
periods. The proportion differs by the time periods [χ2 (10) = 41.16, p < .05]. A cross-table (Table 4) showed the counts and expected counts of
events in different categories.
Table 4. Crossable for Sample characteristics with Chi-square analysis
Time periods χ2 (df)
First stage Second stage Third stage
( N = 47) ( N = 105) ( N = 207)
Types of fear Untrustworthy n 6 17 25 41.16* (10)
( N = 48) Expected n 6.3 14.0 27.7
Dread n 8a 11 15
( N = 34) Expected n 4.5 9.9 19.6
Loss of control n 2 10a 8
( N = 20) Expected n 2.6 5.8 11.5
Uncertainty n 15a 10 14b
( N = 39) Expected n 5.1 11.4 22.5
Vulnerability n 11b 34 86
( N = 131) Expected n 17.2 38.3 75.5
Other n 5b 23 59
( N = 87) Expected n 11.4 25.4 50.2
Note. a The counts are 1.5 times greater than expected counts were in bold.
b The counts are 1.5 times less than expected counts were in Italic.
* The Pearson chi-square value is significant at the .05 level
Page 7/13To further ascertain which types of events in terms of fear have relatively large ratios compared to different periods, multinomial logistical
regression was used (Table 5). We used the second stage as a reference group since it had the highest Google search query volume of face
masks. The odds ratio for uncertainty (6.90) in the First stage is signi cant, indicating that the probability of uncertainty event happening in the
First stage is 6.90 times higher than that in the Second stage, relative to the without fear group. On the other hand, the probability of the loss of
control event happening in the Second stage is 3.23 (1/0.31) times signi cantly higher than that in the Third stage, relative to the without fear
group.
Table 5. Results of the multinomial logistic model
Time B SD Wald df Odds 95% Confidence Interval
periods a ratio for odds ration
Lower Upper
Bound Bound
First Intercept -1.53 0.49 9.56 1 .00
stage Mistrust 0.48 0.68 0.50 1 .48 1.62 .42
Severity 1.21 0.68 3.17 1 .07 3.35 .89
Loss of -0.08 0.92 0.01 1 .93 .92 .15
control
Uncertainty 1.93* 0.64 9.10 1 .00 6.90 1.97
Vulnerability 0.40 0.60 0.43 1 .51 1.49 .46
Without fear - - - - - - -
b
Third Intercept 0.94 0.25 14.69 1 .00
stage Mistrust -0.56 0.40 1.94 1 .16 .57 .26
Severity -0.63 0.47 1.83 1 .18 .53 .21
Loss of -1.17* 0.53 4.76 1 .03 .31 .11
control
Uncertainty -0.61 0.48 1.58 1 .21 .55 .21
Vulnerability -0.01 0.32 0.00 1 .96 .99 .53
Without fear - - - - - - -
b
a,b The reference categories are Second stage for time periods and Other for types of risk characteristic.
* The parameter estimate is significant at the .05 level.
Discussion
The current situation of the COVID-19 pandemic is quite severe. In addition to Asia, the pandemic in Europe, the Americas are becoming
increasingly severe. This has a dramatic impact on the health of citizens worldwide and makes it more di cult for governments to prevent the
epidemic. When epidemic prevention and the economy stand at opposite ends of the scale, nding a balance is the biggest challenge for
governments. The study provided an insight into how to measure national public epidemic awareness through social media- and Internet-based
data and how the public plays a role in infection prevention and control.
Rapidly increasing public epidemic awareness effectively prevents its spread
When it comes to infection prevention and control, the basic reproduction number (R0) is a marker of epidemic transmission intensity under a
speci c spatiotemporal background. This number represents the number of people around every infected person that could possibly get
infected as well. During the early stages of the epidemic, scientists estimate that if R0 is less than 1.5, contact tracing of patients can be used in
Page 8/13theory to identify potential targets for control. However, during the actual outbreak of the COVID-19 epidemic, controlling the same was di cult
because of the substantial increase in the number of patients and asymptomatic transmission.40 In past cases, R0 was found to be more than 2
in Wuhan during the early stages of the epidemic and in Europe and the Americas from March onwards.41,42 This shows that it is essential to
lower R0 in the early stage of the epidemic spread.
As of March 31, the data showed that the total con rmed cases of COVID-19 in per million in people in Taiwan is considerably lower than most
of the countries1 even though Taiwan had resisted the COVID-19 epidemic for more than 70 days and have high population density (673
people/km2). So far, the R0 of Taiwan was still lower than one, and the epidemic was within the controllable range.41 This might be attributed to
the government’s super-early deployment7 as well as fear-induced infection control awareness in public.
In terms of disease information-seeking behavior, previous ndings suggested that seeking behaviors for epidemic diseases could be an
indicator of the in uenza outbreaks. However, the relationship varied by counties.19 We argued that the variation might be explained by the
various public epidemic awareness. In Taiwan, the public’s COVID-19 online information-seeking behavior appeared quite early, with a large
amount of query volume. When the media began to report on the epidemic on a large scale, the discussion of COVID-19 continued to increase
on social media, and the public started seeking information about COVID-19 through Google to reduce their sense of insecurity caused by
uncertainty about the unknown. Such rapid growth of public epidemic awareness is immensely signi cant for public health. Realizing the
importance of COVID-19 and understanding COVID-19 is the crucial rst step in combating COVID-19.
The story behind the face masks information-seeking behavior during epidemics
While the search for diseases can be viewed as a form of public epidemic awareness, we argued that the behavior motivation between
information-seeking for COVID-19 and face masks are different. Driving the search of the former was the feeling of ignorance about the
emerging disease by the public, who sought knowledge to reduce the uncertainty and potential threat to themselves. By contrast, face masks are
crucial personal protection equipment.22 and driving their search is the public perception of the threat of COVID-19 and a desire to understand
how to protect themselves correctly. Despite the ongoing debates on the effectiveness of face masks in epidemic transmission,43 previous
research found that people wearing a face mask tended to have positive hygiene practices such as maintaining social distancing, washing
hands as well as avoiding crowds frequently, and regularly avoiding close contact with an infected person.23 Thus, the face masks information-
seeking behavior might be viewed as an indicator of public epidemic awareness.
The role of fear in stimulating public epidemic awareness
In the history of infectious diseases, fear is almost always the rst intuitive emotion and response of humans.15 Among the ve types of fear in
this study, the most common fear factor embedded in popular events across the whole period was found to be susceptibility. The content of
these events includes new cases throughout the world and the events in which people who didn’t obey the rules of home quarantine. From
changes in the proportion of various types of fear in popular COVID-19 topics with time, different fear elements play different roles at different
time periods. This also properly shows the public response towards COVID-19.
Before COVID-19 entered Taiwan up until the rst case occurred in the same (First stage: 31 December 2019 to 25 January 2020), the types of
fear embedded in popular events that were discussed by the public were mainly the uncertainty and severity caused by COVID-19. The number
of these types of events was higher than the expected value by 1.5 times. The event content included discussion on the possibility of human-to-
human transmission of COVID-19 and where suspected patients were located. Additionally, as studies during this period provided that COVID-19
is caused by the severe acute respiratory syndrome coronavirus two, the public in Taiwan was concerned with the possibility of severe harm or
even death caused by SARS in the past. These uncertain events and consideration of the immense threat of COVID-19 to individual health have
sown the seeds of fear in the population for days to come.
As the epidemic gradually spread, the number of popular events related to loss of control started to increase in the second stage (26 January to
21 February). These types of events accounted for a higher proportion compared to other stages. While ndings have suggested that individuals
are more likely to wear a face mask due to the perceived susceptibility and perceived severity,22 we argued that the loss of control best explains
why the panic behavior occurs in public in Taiwan33, as the event involves an individual’s body. This causes individuals to lose control over self-
protection and feel uneasy when they are unable to buy masks, toilet paper, and other protective and essential supplies. An emerging infectious
disease has a considerable impact on the public, as it involves social and livelihood issues.
Several limitations of the study ought to be mentioned here. First, the Google search query volume of “face masks” did not directly re ect the
actual behavior of wearing face masks. To some extent, the Google search query volume represents the public perception of the COVID-19 threat
and an attempt to take self-protection measures. Second, while our results suggested Google search query volume of face masks could be an
Page 9/13indicator of the public epidemic awareness, the indicator might not be applicable for every country due to cultural differences in attitudes toward
using face masks during the epidemic.44
Conclusions
Facing the threat of COVID-19, the government’s crisis risk management and public epidemic awareness are at the core of this campaign. In
addition to the government’s early maneuvers and precautions, the study highlights that the importance of early public vigilance against COVID-
19 and the timely detection of public epidemic awareness is the key to effective epidemic prevention, and the news media also play a role in
disseminating information between the government and the public. The volume of mentions and search query behaviors on social media
represents many implications in the anti-epidemic stage. These online behaviors can be regarded as indicators for the government to observe
public epidemic awareness and for the public to monitor the government’s response to crisis risk management. While fear is an inevitable
product when an emerging infectious disease occurs, by understanding why fear arises in public and which fear factors cause excessive panic
in public, the government and society can convert resistance into assistance. Additionally, these online behaviors can be regarded as indicators
for the government to observe public epidemic awareness and for the public to monitor the government’s response to crisis risk management. In
a society where the Internet and science and technology are booming, the application of big data in the ght against epidemics will be more
diverse in the future.
List Of Abbreviation
COVID-19: coronavirus disease 2019
Declaration
Ethics approval and consent to participate
Not applicable
Consent for publication
Not applicable
Availability of data and materials
The datasets used or analyzed during the current study are available from the corresponding author on reasonable request.
Competing interests
The authors declare that they have no competing interests
Funding
This study was supported by the Ministry of Science and Technology, Taiwan, under grant number MOST 108-2410-H-033-043.
Authors’ contributions
CCY conceived and designed the study through observing social media behaviors, and drafted the work. LCP provided professional advice on
the domain of emerging infectious diseases. WCL implemented data acquisition and analysis. All the authors contributed to interpreting results
and revising the manuscript. All authors read and approved the nal manuscript.
Acknowledgments
Not applicable
References
1. Roser M, Ritchie H, Ortiz-Ospina E. Coronavirus disease (COVID-19) – Statistics and research. 2020. https://ourworldindata.org/coronavirus
[Online Resource] Accessed March 31 2020.
2. WHO [World Health Organization]. WHO director-general’s opening remarks at the media brie ng on COVID-19. 2020.
https://www.who.int/dg/speeches/detail/who-director-general-s-opening-remarks-at-the-media-brie ng-on-covid-19---2-march-2020.
Accessed Mar 20 2020.
Page 10/133. WHO [World Health Organization]. Coronavirus disease 2019 (COVID-19) situation report – 71. Mar 31, 2020.
https://www.who.int/docs/default-source/coronaviruse/situation-reports/20200331-sitrep-71-covid-19.pdf?sfvrsn=4360e92b_4. Accessed
April 1 2020.
4. Wang S, Lin K. Foreign visitors to Taiwan up 7% in 2019. Focus Taiwan. 2020. (https://focustaiwan.tw/society/202001060014. Accessed
by Feb 20, 2020.
5. Gardner L. Update January 31: modeling the spreading risk of 2019-nCoV. Johns Hopkins University Center for Systems Science and
Engineering, January 31, 2020. https://systems.jhu.edu/research/public-health/ncov-model-2. Accessed Feb 20 2020.
6. TCDC [Taiwan Centers for Disease Control]. Cumulative total of 322 COVID-19 cases con rmed in Taiwan; 39 patients released from
isolation [Press release]. 2020. https://www.cdc.gov.tw/En/Bulletin/Detail/7XTz1qzNqDYE1yL6TT9D3w?typeid=158. Accessed April 1,
2020.
7. Wang CJ, Ng CY, Brook Response to COVID-19 in Taiwan: big data analytics, new technology, and proactive testing. JAMA. 2020;
doi:10.1001/jama.2020.3151.
8. Gates B. Responding to Covid-19 – a once in-a-century pandemic? N Engl J Med. 2020; doi:10.1056/NEJMp2003762
9. Teasdale E, Santer M, Geraghty AWA, Little P, Yardley L. Public perceptions of non-pharmaceutical interventions for reducing transmission
of respiratory infection: Systematic review and synthesis of qualitative studies. BMC Public Health. 2014;1:589
10. Allen M. A meta-analysis of fear appeals. Implication for effective public health campaigns. Health Educ Behav, 2000;27: 591-615.
11. Jones CL, Jensen JD, Scherr CL, Brown NR, Chisty K, Weaver J The health belief model as an explanatory framework in communication
research: Exploring parallel, serial, and moderated mediation. Health Commun. 2015;30:566-76.
12. Person B, Sy F, Holton K, Govert B, Liang A, NCID/SARS Emergency Outreach Team. Fear and stigma: The epidemic within the SARS
outbreak. Emerg Infect Dis. 2004;10:358–63.
13. World Bank (2014). The economic impact of the 2014 Ebola epidemic: Short and medium term estimates for Guinea, Liberia, and Sierra
Leone (English). http://documents.worldbank.org/curated/en/524521468141287875/The-economic-impact-of-the-2014-Ebola-epidemic-
short-and-medium-term-estimates-for-West-Africa. Accessed by Mar 3 2020.
14. Wei KM, Wen-wu D, Lin W. Research on emergency information management based on social network analysis – a case analysis of panic
buying of salt[Paper presentation]. International Conference on Management Science & Engineering (18th), Rome, Italy. 2011
https://dspace.mit.edu/bitstream/handle/1721.1/91406/893487304-MIT.pdf?sequence=2&isAllowed=y. Accessed by Mar 8 2020.
15. Damme, W. V. & Lerberghe, W. V. (2000). Epidemics and fear. TM & IH, 5 (8), 511-514. doi: 10.1046/j.1365-3156.2000.00599.x
16. Rubin GJ, Amlôt R, Page L, Wessely S. Public perceptions, anxiety, and behavior change in relation to the swine flu outbreak: cross sectional
telephone survey. BMJ. 2009;399:144-56.
17. Aiello AE, Renson A, Zivich PN. Social media- and internet-based disease surveillance for public health. Annu Rev Public Health. 2020;41:1-
23.
18. Tausczik Y, Faasse K, Pennebaker JW, Petrie KJ. Public anxiety and information seeking following the H1N1 outbreak: blogs, newspaper
articles, and Wikipedia visits. Health Commun. 2012;27:179-85.
19. Alicino C, Bragazzi NL, Faccio V, et al. Assessing Ebola-related web search behavior: insights and implications from an analytical study of
Google Trends-based query volumes. Infect Dis Poverty. 2015;4:1-13.
20. Rio CD, Malani PN. COVID-19—New insights on a rapidly changing epidemic. JAMA. 2020; doi:10.1001/jama.2020.3072.
21. Feng S, Shen C, Xia N, et al. Rational use of face masks in the COVID-19 pandemic. LANCET RESP MED. 2020; doi:10.1016/S2213-
2600(20)30134-X
22. Sim SW, Moey, KSP, Tan NC. The use of facemasks to prevent respiratory infection: A literature review in the context of the Health Belief
Model. Singapore Med J. 2014;55:160-7.
23. Wada K, Oka-Ezoe K, Smith DR. Wearing face masks in public during the in uenza season may re ect other positive hygiene practices in
Japan. BMC Public Health. 2012;12:1065.
24. Rogers RW. Cognitive and physiological processes in fear appeals and attitude change: a revised theory of protection motivation. In
Cacioppo JT, Petty RE, editors. Social Psychophysiology. New York: Guilford Press; 1983. p. 153-76.
25. Dong E, Du H, Gardner L. An interactive web-based dashboard to track COVID-19 in real time. Lancet Infect Dis. 2020; doi:10.1016/S1473-
3099(20)30120-1.
26. Timeline of the 2019–20 coronavirus outbreak in December 2019–January 2020. 2020
https://en.wikipedia.org/wiki/Timeline_of_the_2019%E2%80%9320_coronavirus_outbreak_in_December_2019_%E2%80%93_January_2020.
Accessed February 20, 2020.
27. TCDC [Taiwan Centers for Disease Control]. Press Releases. https://www.cdc.gov.tw/En/Bulletin/List/7tUXjTBf6paRvrhEl-mrPg. Accessed
Mar 1 2020.
Page 11/1328. Keypo – The Big Data Analytics Engine. https://keypo.tw/. Accessed Mar 1 2020.
29. Carleton RN. Fear of the unknown: One fear to rule them all? J. Anxiety Disord, 2016;41:5-21.
30. Ropeik D. The consequences of fear. EMBO Reports. 2004; doi:10.1038/sj.embor.7400228
31. Slovic P. The Perception of Risk. London, UK: Earthscan; 2000.
32. Howel DC. Statistical methods for psychology. 8th ed. Belmont, CA: Wadsworth Cengage Learning; 2013.
33. Chang MH, Pan TY, Ku C, Joseph Y. WUHAN VIRUS/Healthy people do not need to wear face masks: CDC. Focus Taiwan. 2020.
https://focustaiwan.tw/society/202001310013. Accessed Mar 10 2020.
34. TCDC [Taiwan Centers for Disease Control]. As cases of 2019 novel coronavirus (2019-nCoV) continue to grow in China and other countries
and the Lunar New Year Holiday approaches its end, Central Epidemic Command Center (CECC) urges travelers to conduct self-health
management for 14 days after returning to Taiwan and report suspected symptoms by calling 1922 [Press release]. 2020.
https://www.cdc.gov.tw/En/Bulletin/Detail/-dU_LiC4WQm82jB-lb9KqQ?typeid=158. Accessed February 10, 2020.
35. TCDC [Taiwan Centers for Disease Control]. Name-based rationing system for purchases of masks to be launched on February 6; public to
buy masks with their (NHI) cards [Press release]. 2020. https://www.cdc.gov.tw/En/Bulletin/Detail/ZlJrIunqRjM49LIBn8p6eA?typeid=158.
Accessed February 10, 2020.
36. Lee HY. Tech experts helped make Taiwan's mask rationing system a success. Focus Taiwan. 2020.
http://focustaiwan.tw/society/202002280019. Accessed Mar 8 2020.
37. Ku C, Yeh SP, Chiang YC. Wuhan virus: Taiwan government extends requisitioning of masks, ban on exports. Focus Taiwan. 2020.
(http://focustaiwan.tw/society/202002130012.) Accessed Mar 8 2020.
38. Lin S. Virus Outbreak: Taiwan to become world No. 2 in mask production. Taipei News. 2020.
http://www.taipeitimes.com/News/front/archives/2020/02/15/2003731015. Accessed by Mar 8 2020.
39. TCDC [Taiwan Centers for Disease Control]. Online ordering mechanism to be added to the name-based rationing system for face masks on
March 12 [Press release]. 2020. https://www.cdc.gov.tw/En/Bulletin/Detail/1CC5Xgb9UdxXEs6-RcS1uQ?typeid=158. Accessed Mar 20
2020.
40. Hellewell, J., Abbott, S., Gimma, A., et al. (2020). Feasibility of controlling COVID-19 outbreaks by isolation of cases and contacts. Lancet
Glob Health. 2020; doi:10.1016/S2214-109X(20)30074-7
41. Lee I-C. Virus outbreak: Social distancing key to limiting COVID-19 spread. Taipei News. 2020.
https://www.taipeitimes.com/News/front/archives/2020/03/24/2003733259. Accessed Mar 3, 2020.
42. Li Q, Guan X, Wu P, et al. Early Transmission Dynamics in Wuhan, China, of Novel Coronavirus-Infected Pneumonia. N. Engl. J. Med.
2020;382:1199-1207.
43. Cowling BJ, Zhou Y, Ip DKM, Leung GM. Face masks to prevent transmission of in uenza virus: a systematic review. Infect. 2010;138:449-
56.
44. Zeng S. Face masks and coronavirus: how culture affects your decision to wear one. South China Morning Post. 2020.
https://sg.news.yahoo.com/face-masks-coronavirus-culture-affects-075543148.html. Accessed Mar 31 2020.
Figures
Page 12/13Figure 1
The trend chart between December 31, 2019, and February 29, 2020 for seven indicators . Trends of the total con rmed cases worldwide and in
Taiwan, the numbers of news reports on COVID-19, the volume of the mentions of COVID-19 and face masks on social media, and the Google
search query volume of COVID-19 and face masks between December 31, 2019, and February 29, 2020.
Supplementary Files
This is a list of supplementary les associated with this preprint. Click to download.
Additional le1Categorizationoftypesoffear.docx
Additional le2OnewayANOVA.docx
Page 13/13You can also read