Analyzing Trend of Tropical Cyclone Activity Along Odisha Coast, India
←
→
Page content transcription
If your browser does not render page correctly, please read the page content below
Analyzing Trend of Tropical Cyclone Activity Along
Odisha Coast, India
Manoranjan Mishra
Khallikote University
Namita Pattnaik
Gangadhar Meher University
Manoj Kumar Dash
Khallikote University
Dambaru Ballab Kattel
University of the Chinese Academy of Sciences
Shailendra Kumar Mishra ( shailendra17@gmail.com )
University of Allahabad https://orcid.org/0000-0002-1840-0374
Research
Keywords: Tropical cyclone, severe cyclonic storms, economic damage and Odisha coast
DOI: https://doi.org/10.21203/rs.3.rs-30112/v1
License: This work is licensed under a Creative Commons Attribution 4.0 International License.
Read Full License
Page 1/16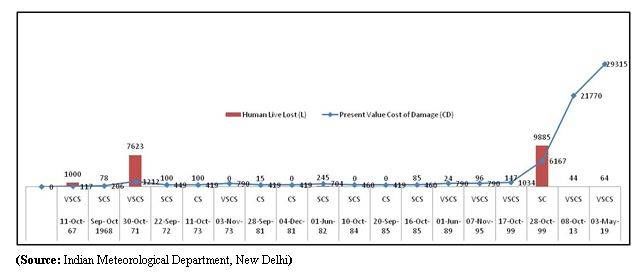
Abstract
A general perception among scienti c community and policy makers of developing countries exists that
intensity and frequency of tropical cyclones are increasing over time due to climate change and global
warming. In the present study, we have tried to investigate the trend and variability of tropical cyclone
landfall along the Odisha coast, India. The data pertaining to landfall of the tropical cyclones were
collected from Indian Metrological Department and were further ltered using Gaussian lter. The results
were plotted in graphical form. Correlation and linear regressions analyses were carried out. The results
highlight that the frequency and intensity of tropical cyclone exhibit a decreasing trend. It can be thus be
inferred that growing economic loss and loss of lives are due to growing exposure of unplanned
population settlements and business investments to extreme events. Therefore socio-economic
landscapes need to be adjusted to the landfall of cyclone than blaming natural forces for the loss of lives
and properties. Findings of the present study may help policy makers devising future policies in coastal
zones.

Introduction
The tropical cyclones are one of the most damaging and powerful forces induced by the earth system
during the last century.1–4 The vulnerability due to tropical cyclone is rising around the world owing to
increase in human habitats and critical infrastructure along the coastlines. It is di cult to establish
parametric relationship between global warming and variability of tropical cyclone all over the world.5–12
Kossini, 2018, nds that translation speed of tropical cyclones has decreased by ten percent during
year1949 to 2016 around the world which is well correlated with the changes in atmospheric conditions
induced by anthropogenic warming.13 But, there is an observed trend that tropical cyclones over Bay of
Bengal have intensi ed in their sustained wind speed and cyclone size.14 The severe cyclone Fani which
made a landfall at Odisha coast on May 3, 2019 causing rampant economic damage is unique in nature
due to its timing, strength and trajectory. Comparatively warmer Bay of Bengal provides conducive
environmental condition for intensi cation of such cyclonic storms.15 Further, scienti c evidence also
exists about drastic increase in power dissipation index (PDI) during last two decades.16–18 There is a
scienti c perception that tropical cyclone in the 21st century are becoming more destructive in nature. It is
generally attributed to the increase in frequency and intensity of cyclone induced by rising ocean
temperature and other climatic perturbations. Rising temperature of the earth systems i.e. roughly 0.8
degree Celsius warmer than the last century is supposedly directly linked with the timing, frequency and
intensity of tropical cyclones.

The increased destructive potential of tropical cyclone along Odisha coast is a serious concern because
the population density and economic investments are increasing at a rapid rate in these areas. The
cyclonic activity over Bay of Bengal (BoB) has frequency ve times more than Arabian Sea.19 According
to Singh et al. (2000), both frequency and intensity of tropical cyclonic activities have increased in the

                                                  Page 2/16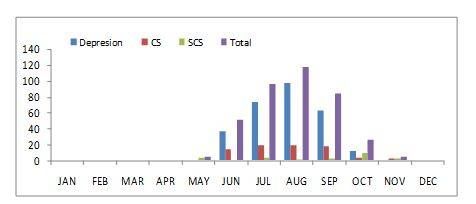
BoB during last 122 years (1877–1998).20 Thus, the States bordering Bay of Bengal are more vulnerable
to tropical cyclones compared to Arabian Sea.
On the contrary, some studies over the North Indian Ocean show that there exists no long term trend of
increasing frequency and intensity of tropical cyclone yet some crucial points of contention remains
about the veracity of decadal variations.21–23 Again, no signi cant relations are found between tropical
cyclonic activity in North Indian Ocean and El Niño–Southern Oscillation (ENSO).22,24 However, two
important questions remain unanswered about frequency of tropical cyclone land falling at the Odisha
coast. First, structure and signi cance of annual, decadal and other preferred variability of land falling of
cyclones are poorly understood in the study area. Second, economic damage and destruction increased
in past quarter century along Odisha coast has a negative correlation with any actual increase in
frequency or intensity of cyclones.
Therefore, an investigation regarding variability of the landfall frequency of tropical cyclones will provide
insight about trends in past and important understanding on the continental impact of these cyclonic
activities. The present study evaluates inter annual and decadal variability of tropical cyclone activity
along Odisha coast, and further examines the modulation of total seasonal cyclonic activity with trend
analysis in North Indian Ocean during the last century.
Materials And Methods
Study area
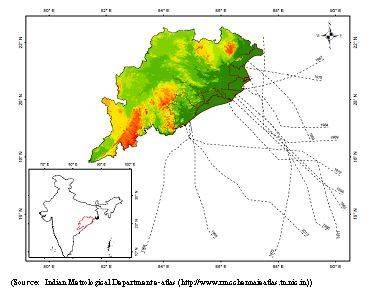
The coastal zone of Odisha is extended over 480 km from the district Balasore in north to Ganjam in the
south having a co-ordinate of 17° 48'N, 81°24´E to 22°34´N, 87°29´E (Fig. 1). This part constitutes 16% of
geographical area of the state and is inhabited by 33% of the total population.25 The coastal landscape
of Odisha is 5033.64 sq km and is divided into ve homogenous geomorphical units using geospatial
technology. The response of shore line to severe cyclonic storms is cyclic in nature including phase of
erosion, phase accretion and phase of stabilization.26, 27 Apart from storms, sea level rise will induce
damage and economic loss in costal Odisha in coming days.28 It also has one of the world heritage sites
namely Sun temple in Konarak, attracting large number of tourists and pilgrimages over the year.
Nevertheless, this region also had experienced 128 cyclonic storms between years 1804 to 2000, and also
remained one of the most vulnerable regions for climate induced natural disasters in Indian subcontinent.
Consequently, it had undergone considerable damage of life and property in recent past.29, 30 Again, it has
been estimated that Odisha coast had witnessed 37% of total cyclonic storms landfall in the eastern
coastline of India during last 109 years. In another calculation, climatologically it is expected to witness
maximum cyclonic storm between year 1981 to 2030.31
(Source: Indian Metrological Department e-atlas (http://www.rmcchennaieatlas.tn.nic.in))
Data type
Page 3/16The data pertaining to landfall of tropical cyclone is used for analyses in the present study. Data obtained
from cyclonic e-atlas of Indian Meteorological Department includes frequency of tropical cyclones land
fall, position observed hitting the mainland of coastal Odisha and central maximum wind speed. Further,
the central maximum wind speed is classi ed into three classes - (a) depression (D, with maximum
central wind speed less than 34kn or 17 m/s), (b) cyclonic storm (CS, 34- 64kn, 17–32.6 m/s) and (c)
severe cyclonic storms (SCS, more than 64kn, 32 m/s). The data spans from 1891 to 2012 are
interpolated for adjacent area of the study having co-ordinate of 17° 48'N, 81°24´E to 22°34´N, 87°29´E.
The time series of frequency of landfall of tropical cyclones (depression, cyclonic storms and severe
cyclonic storms) are ltered with Gaussian lter and the outputs were plotted in graphs for visual
interpretation and preliminary analysis.32 In this study, frequency of depression, cyclonic storms and
severe cyclonic storm were pooled for each decade to understand inter-decadal variation.
Analyses
To understand the relationship among depression, cyclonic storm and severe cyclonic storms (i.e. tropical
cyclones) correlation has been carried out. Further, separate linear regression models were conducted
considering depression, cyclonic storm and severe cyclonic storm as dependent variables, to evaluate the
effect of time (decadal variation) and other tropical cyclones apart from the one considered as dependent
variable in the model.
Results
A total of 1301 tropical cyclonic storms were generated over Bay of Bengal during the past 121 years
(1891–2011). Among those 33% (389) had their landfall on Odisha coast. Out of these tropical cyclonic
storms, 73% were tropical depression, 20% were cyclonic storms and 7% were severe cyclonic storms.
Noticeable annual uctuation is observed in the number of landfall of tropical cyclones along Odisha
coast with the maximum of 8 in years 1990, 1927 and 1934, and a minimum of 0 in years 1901, 1987,
1993, 1996, 1998, 2000 and 2002. There had been more number of landfall of tropical cyclones during
the early 1900s and after 1930, while seldom around 1980 and 2011 (Figure − 2). Over the decades,
frequency of tropical depression has increased and the frequency of cyclonic storm has decreased
however no clear trend has been observed for sever cyclonic storms. However, prominently marked
decreases are found in last four decades (Figure-3).
The months of June (52), July (97), August (119) and September (85) are high probability months
accounts for 91% of the reported cyclones landfall at Odisha coast between the year 1891–2011 (Figure-
4). The cyclonic storm season starts in the month of May/June, increases with July, peaks in August and
decreases to low frequency in the month of November/December. This pattern corresponds with the time
of the year when convective heating is at its highest in the province, therefore high storm frequencies are
anticipated. Although 50% of sever cyclonic storms occurred in the month of October but depression and
cyclonic storms have equivalent pattern to total land falling of tropical cyclonic storms in Odisha. It is
Page 4/16evident from Figure-4 that a number of severe cyclonic storms occur during peak summer months but the
threat of storms is not substantially reduced until November.
Table- I shows a negative correlation between decadal frequency of tropical depression and cyclonic
storm. No signi cant correlation has been observed between decadal frequency of depression and
decadal frequency of sever cyclonic storm. Similarly, relationship between decadal frequency of cyclonic
storm and sever cyclonic storm is also found to be non signi cant.
Table-I
Correlation coe cient showing relationship among various types of tropical storms
Frequency of Frequency of cyclonic Frequency of sever
depression storm cyclonic storm
Frequency of - -0.87** 0.33
depression
Frequency of cyclonic - 0.18
storm
Frequency of sever -
cyclonic storm
Results of the multiple regression analysis illustrate that decadal frequency of cyclonic storm and time
are the two signi cant predictors of the frequency of depression. Frequency of depression is positively
associated with the time however frequency of cyclonic storm is negatively associated. Time remains a
signi cant predictor of all kinds of tropical storms yet decadal frequency of depression is also found to
be signi cant predictor of cyclonic and sever cyclonic storms.
Table-II
Results of multiple regression considering time and the kinds of tropical cyclones, apart from the one
considered as dependent variable, as predictors.
Page 5/16Dependent Signi cant β SE p-value R2
variable predictor (s)
Decadal Decadal -1.49 0.56 0.01 0.79
frequency of frequency of
depression cyclonic 0.65 0.86 0.02
storm
Time
Decadal Decadal -0.32 0.11 0.02 0.96
frequency of frequency of
cyclonic depression -0.72 0.37 0.01
storm
Time
Decadal Decadal -1.41 0.11 0.01 0.84
frequency of frequency of
sever depression -1.38 0.37 0.01
cyclonic
storm Time
(Source
Indian Meteorological Department, New Delhi)
It is abundantly clear from Figure − 5 that except in year 1999, loss of human lives has substantially
reduced during lost few decades. On the contrary, loss of properties has exponentially increased during
this period which generally attributed to fury of natural forces.
Discussion
Finding of the present study reveals that landfall frequencies of tropical cyclones along Odisha coast
have exhibited a decreasing trend in long term analysis at different rates. A study by Sahoo and
Bhaskaran (2018) reported that the Odisha have been hit with 46 cyclones in the last four decades.18
Again, they have highlighted that combined frequencies of pre and post-monsoon cyclone frequencies in
Odisha are the highest as compared to other States of east coast of India. Another notable observation of
our study is that the tracks of pre-monsoon cyclone are shorter in length as compared to post-monsoon
cyclone. It can thus be inferred that longer duration inside the sea produces cyclones with higher intensity
during post monsoon compared to pre-monsoon season. But, super cyclone Fani produced in month of
April and May 2019 is an exception. It developed around equator and moved upward for 7 days before
landfall, gaining moisture and momentum from shallow sea, and thus generated stronger winds.
The trend analysis highlights that intensity and frequency of cyclones are decreasing during last
100 years but natural forces were squarely blamed after each and every severe tropical cyclone landfall
along the maritime States. On contrary, it has been stated by Peduzzi (2012) that frequency and intensity
of landfall of tropical cyclones is stable across the globe during last 40 years. Yet the global population
Page 6/16has increased 86% between the years 1970 to 2010 and so is the exposure to the risk of tropical cyclones
has increased globally.1, 33
Further, Sahoo and Bhaskaran (2018) observed that energy metrics such as in power dissipation index
(PDI) and accumulated cyclone energy (ACE) directly linked with the maximum sustained wind speed of a
cyclonic system during last 30 years along Odisha coast is increasing the exposure of risk to the coastal
communities.18 On the contrary, some of the studies have shown increasing trend of intensi cation of
cyclones in the month of November and May in Northern Indian Ocean (Singh et al., 2000).34
Unfortunately, Paradeep port located in east coast of India was affected by sever cyclonic storms for four
times during post monsoon season.35 There is a positive correlation between the total number of tropical
cyclones generated in Bay of Bengal and the proportion of landfall of tropical cyclones along Odisha
coast, with a correlation coe cient of .092. This coe cient rises to 0.47 (signi cant at 0.01 level), if
some years are omitted from the analysis. The analysis above highlight that intensity and frequency of
cyclone are decreasing in last centuries but economic damage is increasing. This increased vulnerability
for loss of properties due to tropical cyclones may be on account of greater wealth accumulation along
the coastline owing to rapid economic growth, speedy infrastructural development and consequent
enhanced exposure to greater percentage of population inhabiting along the coast in last 50 years. The
need of hour is to provide accurate comprehensive information of track of cyclones, maximum sustained
wind speed and central pressure drop to map the vulnerability of a given location.
Conclusion
There is a common perception in the media, coastal resources managers and policy makers that
frequency and intensity of tropical cyclones along Odisha coast have caused more damage over the
years. Indirectly, natural forces were squarely blamed after each and every severe tropical cyclone landfall
along the maritime state. However, if natural forces alone were to be blamed, then severe tropical cyclone
Phailin, 2013 and Fani, 2019 would have had an equal impact. It would have invariably affected the most
vulnerable sections of the society, who commonly owe their condition to human policies and practices.
Furthermore, the overall composition, timing, strength, trajectory and consequence of landfall of tropical
cyclones along Odisha coastline are poorly understood before.36 Contrary to common perception, this
study highlights that frequency and intensity of tropical activity has a decreasing trend in last century. We
are now in Age of Human being called Anthropocene and considering severe cyclonic storms like Fani,
Phailin and Super Cyclone 1999 are act of nature, is a contradiction. The intensi cation of cyclonic
storms and economic damages are human induced but not the act of nature’s fury. Thus the rampage
caused by severe cyclonic storms is more due to societal factors than the metrological factors. The
cyclone like Fani has exposed development failures in major cities such as Bhubaneshwar, Cuttack and
Puri and call for developing a vigilant disaster management system, land-use planning, sustainable
development of coastal districts, and insurance measures. It can be inferred that more integrated and
holistic disaster risk reduction is the need of hour for managing all sphere of vulnerability in coming days.
The governments of coastal States have to move from zero casualties to zero economic damage. The
Page 7/16nding of this study can help coastal mangers, policy makers and decision makers and researchers for
future investigation of ground realities of survival in cyclone belt.
Declarations
Acknowledgements: Authors acknowledge Khallikote University for providing logistic support.
Author’s contribution: All the authors have contributed substantially in data analyses and writing of the
manuscript. All the authors have read and approved the nal draft.
Funding:
No funding was received for this work.
Availability of data and materials:
Not applicable
Competing interests:
The authors declare that there are no competing interests.
References
1. Peduzzi, P., B. Chatenoux, H. Dao, A. D. Bono, C. Herold, J. Kossin, F. Mouton, and O. Nordbeck. 2012.
Global trends in tropical cyclone risk. Nat Clim Change 2: 289–294.
2. Gupta, S., I. Jain, P. Johari, and M. Lal. Impact of Climate Change on Tropical Cyclones Frequency
and Intensity on Indian Coasts. In Springer Series in Geomechanics and Geoengineering. 2018.
(pp. 359–365). Springer International Publishing. https://doi.org/10.1007/978-3-319-77276-9_32.
3. Pruitt, J. N., A. G. Little, S. J. Majumdar, T. W. Schoener, and D. N. Fisher. 2019. Call-to-Action: A Global
Consortium for Tropical Cyclone Ecology. Trends Ecol Evol 34 (7): 588–590.
https://doi.org/10.1016/j.tree.2019.04.009.
4. 10.1007/s12040-019-1227-1
Rao, D. V. B., D. Srinivas, and G. C. Satyanarayana. 2019. Trends in the genesis and landfall locations
of tropical cyclones over the Bay of Bengal in the current global warming era. Journal of Earth
System Science 2019; 128(7). https://doi.org/10.1007/s12040-019-1227-1.
5. De, U. S., and K. S. Joshi. 1999. Interannual and interdecadal variability of tropical cyclones over the
Indian seas. Deccan Geog 37: 5–21.
6. IPCC (Intergovernmental Panel on Climate Change)
Page 8/16IPCC (Intergovernmental Panel on Climate Change). 2001. Climate Change 2001: The Scienti c
Basis, Contribution of Working Group I to the Third Assessment Report of the IPCC. Houghton, J. T.,
et al., Cambridge University Press, 944 pp. Accessed from Cambridge University Press, The Edinburgh
Building, Shaftesbury Road, Cambridge CB2 2RU England. Accessed on 23rd March 2017.
7. Shepherd, J. M., and T. Knutson. 2007. The current debate on the linkage between global warming
and hurricanes. Geogr Compass 1: 1–24.
8. Johnny, C. L. C., L. Kin-Sik, X. Ming, and Y. Qiuzhen. 2011. Variations of frequency of landfalling
typhoons in East China. Int J Climatol 32: 1450–1949.
9. IPCC (Intergovernmental Panel on Climate Change)
Managing the risks of extreme events and disasters to advance climate change adaptation
Accessed on 12th March 2016
IPCC (Intergovernmental Panel on Climate Change). 2012. Managing the risks of extreme events and
disasters to advance climate change adaptation. http://ipcc-wg2.gov/SREX/, p 582. Accessed on
12th March 2016.
10. Moon, I., S. Kim, and J. C. L. Chan. 2019. Climate change and tropical cyclone trend. Nature 570: E3–
E5. https://doi.org/10.1038/s41586-019-1222-3.
11. Kang, N., D. Kim, and J. B. Elsner. 2019. The contribution of super typhoons to tropical cyclone
activity in response to ENSO. Sci Rep 9: 5046. https://doi.org/10.1038/s41598-019-41561-y.
12. Comparison of Reanalysis Data Sets to Comprehend the Evolution of Tropical Cyclones Over North
Indian Ocean
https://doi.org/10.1029/2019ea000978
Malakar, P., A. P. Kesarkar, J. N. Bhate, V. Singh, and A. Deshamukhya. Comparison of Reanalysis
Data Sets to Comprehend the Evolution of Tropical Cyclones Over North Indian Ocean. Earth Space
Sci 2020: 7(2). https://doi.org/10.1029/2019ea000978.
13. Kossini, J. P. A global slowdown of tropical-cyclone translation speed. Nature 2018; 558: 104–107;
Author Correction Nature 2018; 564: E11–E16.
14. Singh, K., J. Panda, and M. Mohapatra. Robustness of best track data and associated cyclone
activity over the North Indian Ocean region during and prior to satellite era. Earth Syst Sci 2020:
129(1). https://doi.org/10.1007/s12040-020-1344-x.
15. Bhardwaj, P., and O. Singh. 2019. Climatological characteristics of Bay of Bengal tropical cyclones:
1972–2017. Theor Appl Climatol 139 (1–2): 615–629. https://doi.org/10.1007/s00704-019-02989-4.
16. Emanuel, K. 2005. Increasing destructiveness of tropical cyclones over the past 30 years. Nature 436:
686–688.
17. Murty, P. L. N., P. K. Bhaskaran, and R. Gayathri, et al. 2016. Numerical study of coastal
hydrodynamics using a coupled model for Hudhud cyclone in the Bay of Bengal. Estuar Coast Shelf
Sci 183: 13e27. https://doi.org/10.1016/j.ecss.2016.10.013.
18. Sahoo, B., and P. K. Bhaskaran. 2018. Multi-hazard risk assessment of coastal vulnerability from
tropical cyclones e A GIS based approach for the Odisha coast. J Environ Manag 206: 1166–1178.
Page 9/1619. Sahoo, B., and P. K. Bhaskaran. 2015. Synthesis of tropical cyclone tracks in a risk evaluation
perspective for the east coast of India. Aquat Procedia 4: 389e396.
https://doi.org/10.1016/j.aqpro.2015.02.052.
20. Singh, O. P., T. M. Ali Khan, and M. S. Rahman. 2000. Changes in the frequency of tropical cyclones
over the North Indian Ocean. Meteorol Atmos Phys 75: 11–20.
21. Joseph, P. V., and P. K. Xavier. Monsoon rainfall and frequencies of monsoon depressions and
tropical cyclones of recent 100 years and an outlook for the rst decades of the 21st century. Proc.
TROPMET-99, Chennai, India, Indian Meteorological Society, 1999: 364–371. Accessed from Indian
Meteorological Society, Chennai Chapter, Regional Meteorological Centre, 50 College Road, Chennai
600006, India.
22. Singh, O. P., and T. M. A. Khan. 1999. Changes in the frequencies of cyclonic storms and depressions
over the Bay of Bengal and the Arabian Sea. SMRC Rep 1999; 2: 121 pp. Accessed from South Asian
Association for Regional Co-operation, Meteorological Research Centre, Agargaon, Dhaka 1207,
Bangladesh.
23. Srivastava, A. K., K. C. S. Ray, and De. 2000. US Trends in the frequency of cyclonic disturbances and
their intensi cation over Indian seas. Mausam 51: 113–118.
24. Bhardwaj, P., D. R. Pattanaik, and O. Singh. 2019. Tropical cyclone activity over Bay of Bengal in
relation to El Niño-Southern Oscillation. International Journal of Climatology 39 (14): 5452–5469.
25. Census. 2011. Census data online. Available at: http://www.censusindia.net/cendat/ Accessed on
5th March 2016.
26. Mishra, M. 2016. Geomorphic Regionalization of Coastal Zone Using Geospatial Technology. Int J
Environ Geo-Inf 3 (2): 11–23.
27. Mishra, M., P. Chand, N. Pattnaik, D. B. Kattel, G. K. Panda, M. Mohanti, U. D. Baruah, S. K. Chandniha,
S. Achary, and T. Mohanty. Response of long- to short-term changes of the Puri coastline of Odisha
(India) to natural and anthropogenic factors: a remote sensing and statistical assessment. Environ
Earth Sci 2019; 78(11). https://doi.org/10.1007/s12665-019-8336-7.
28. Mishra, M., N. Pattnaik, B. Padhi, and P. Mishra. 2016. Mental Model Mapping of Sea Level Changes:
125 142 Analyzing the Public and Expert Perception of Bhitarkanika Marine Biosphere Reserve,
Global Warming. In Sea Level Rise & Community Adaptation Strategies, Siksha ‘O’ Anusandhan
University, India, 125–145. Canada: Kwantlen Polytechnic University.
29. Dube, S. K., P. C. Sinha, A. D. Rao, and T. Murty. Storm Surge Prediction and Mitigation with Particular
Reference to Orissa. In: Proceedings of the Workshop on Forecasting and Mitigation of
Meteorological Disasters: Tropical Cyclones, Floods, and Droughts. Bhubaneswar: TROPMET 2002,
pp. 62–87.
30. Mohanty, P. K., U. S. Panda, and P. Mishra. 2008. Monitoring and management of environmental
changes along the Orissa coast. J Coast Res 24 (2B): 13–27.
31. Mooley, D. A., and C. M. Mohile. 1983. A study of cyclonic storms incident on the different sections of
the coast around the Bay of Bengal. Mausam 34: 139–152.
Page 10/1632. Hanna, E., and J. Cappelen. 2003. Recent cooling in coastal southern Greenland and relation with the
North Atlantic Oscillation. Geophys Res Lett 39: 1–3.
33. Peduzzi, P., H. Dao, and C. Herold, et al. 2009. Assessing global exposure and vulnerability towards
natural hazards: the disaster risk index. Nat. Hazard. Earth Syst Sci 9: 1149–1159.
34. Singh, O. P., T. M. Alikhan, and M. S. Rahman. 2000. Changes in the frequency of tropical cyclones
over the north Indian Ocean. Meteor Atmos Phys 75: 11–20.
35. Sridharan, S., and A. Muthuchami. 2002. Some salient features of the Bay of Bengal super cyclonic
storm of October. Mausam 53: 237–241.
36. Kantamaneni, K., N. N. V. S. Rani, L. Rice, K. Sur, M. Thayaparan, U. Kulatunga, R. Rege, K. Yenneti,
and L. C. Campos. 2019. A systematic review of coastal vulnerability assessment studies along
Andhra Pradesh, India: Critical evaluation of data gathering, risk levels and migration strategies.
Water 11: 393. doi:10.3390/w11020393.
Figures
Figure 1
Location of study area and tracks of observed tropical storms along Odisha coast (1915 – 2018)
Page 11/16Figure 1
Location of study area and tracks of observed tropical storms along Odisha coast (1915 – 2018)
Figure 2
Annual landfall of tropical cyclones along Odisha coast (1891-2011)
Figure 2
Annual landfall of tropical cyclones along Odisha coast (1891-2011)
Page 12/16Figure 3
Decadal distribution of dipression, Cyclonic storms and sever cyclonic storms
Page 13/16Figure 3
Decadal distribution of dipression, Cyclonic storms and sever cyclonic storms
Figure 4
Month wise distribution of Tropical cyclones along Odisha coast (1891- 2011)
Page 14/16Figure 4
Month wise distribution of Tropical cyclones along Odisha coast (1891- 2011)
Figure 5
Loss of human lives (in numbers) and percent value cost of the properties (in crores) during last few
decades.
Page 15/16Figure 5
Loss of human lives (in numbers) and percent value cost of the properties (in crores) during last few
decades.
Page 16/16You can also read