Appendix A: Key Performance Indicators - Quarter 3 2020/21
←
→
Page content transcription
If your browser does not render page correctly, please read the page content below
Appendix A: Key Performance Indicators – Quarter 3 2020/21
         19

                        For consideration at Overview & Scrutiny Management Committee
                                          Wednesday 24th February 2021

nformation that contains a small amount of sensitive data which is essential to communicate with an individual but doesn’t require to be sent via secure methods.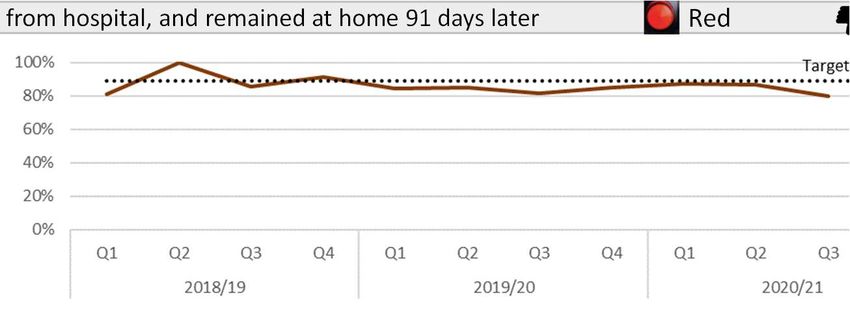
Headlines – KPIs Q3 2020/21
                                       Green                                               Amber                                  Red                    N/A                    Total
           •   AS1         •   CIC8         •   PG8            •   PG14         • PG11            • RA16           • RA3                                 • PG12
           •   AS4         •   RA2          •   PG10           •   PG24         • PG17                             • RA5d
           •   AS9         •   PG1          •   PG15           •   PG25
                                                                                                                                                                      34 KPIs performed be
           •   AS10        •   PG5          •   PG22           •   PG26
                                                                                                                                                                          in Q3 than in Q2.
           •   CIC12       •   PG13         •   CIC13          •   RA5b
           •   CS5         •   RA13         •   RA10           •   PG20
           •   RA7         •   RA15         •   RA14b          •   RA8
nge        •   AS11        • PG16           • RA6                               • PG3                                                                                 7 KPIs have had no cha
           •   RA1                                                                                                                                                     in performance betwe
           •   CS6                                                                                                                                                            Q2 and Q3.
           •   CS7
         20

           • CS3           • PG6            • RA14a                             •   CIC1          • RA12           •   RA4            •   RA5a           • RA5c
                           • PG9                                                •   PG2                            •   CIC5           •   PG19
                           • PG21                                               •   CIC11                          •   AS7            •   CIC16                       20 KPIs performed wo
                                                                                •   CS2                            •   AS3            •   CS1                             in Q3 than in Q2.
                                                                                                                   •   CS4

T                                                                               • PG4                                                                    • CIC9             3 KPI no DoT
                                                                                                                                                         • CIC10
                                  39 Green KPIs                                      10 Amber KPIs                          11 Red KPIs                  4 KPIs N/A            64 KPIs

nformation that contains a small amount of sensitive data which is essential to communicate with an individual but doesn’t require to be sent via secure methods.          Appendix A - KPIs Q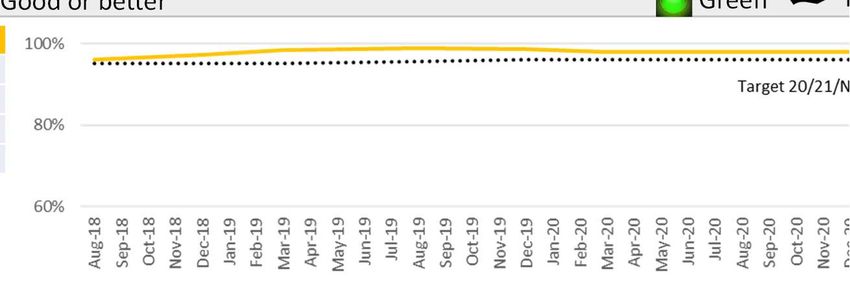
erformance Indicators Q3 2020/21 – Summary                                                                                         Note: KPIs directly impacted by Covid-19 will display the following ico

trong Communities
escription                                                                                                                                               Frequency       RAG             Direction of Tr
 cial work assessments allocated to commence within 7 days of the requests (counted at point of allocation)                                              Quarterly      Green                Better
 ople aged 65+ who received reablement from the START team following discharge from hospital and remained at home 91
                                                                                                                                                         Quarterly        Red                 Worse
 ys later
 feguarding timeliness – concerns completed within 2 working days                                                                                        Quarterly      Green                 Better
oportion of people receiving long term care who were subject to a review in the last 12 months                                                           Quarterly       Red                  Worse
 rmanent admissions to residential and nursing care homes per 100k population                                                                            Quarterly      Green                 Better
 ormation and Advice at the front door – Percentage of contact referrals closed with ‘NFA – Advice & Information Only’                                   Quarterly      Green                 Better
oportion of people who use services who receive direct payments – snapshot at end of quarter                                                             Quarterly      Green                 No change
oposed alternative measure to Delayed Transfers of Care – in development                                                                                 Quarterly
 rcentage of children who became subject to a Child Protection Plan for a second or subsequent time within 24 months                                     Quarterly        Red                 Worse
 rcentage of child protection visits due in the period, which were completed to the highest standard of 10 working days since
                                                                                                                                                         Quarterly      Amber                 Worse
e previous visit
  recorded crime in Wokingham borough (excluding fraud)                                                                                                  Quarterly      Amber                 Worse
         21

 Lives
scription                                                                                                                                                Frequency       RAG             Direction of Tr
 centage of young people with statements or EHCPs participating in Employment, Education or Training                                                     Quarterly      Green                Worse
 centage of Education, Health & Care Plan assessments completed within 20 weeks of referral                                                              Quarterly       Red                 Worse
 centage of former care leavers (up to the age of 21) in Education, Employment or Training                                                               Quarterly      Green                Better
 centage of children who attend a Wokingham state-funded school (Primary, Secondary or Special) which is Good or better                                  Quarterly      Green                No change
 centage of early years settings in Wokingham borough with an Ofsted rating of Good or better                                                            Quarterly      Green                No change
mber of visits to Wokingham borough libraries                                                                                                            Quarterly       Red                 Worse
mpletion to time and budget of regeneration projects (Peach Place, Elms Field, Carnival Pool)                                                             Quarterly     Green                No change
cupancy rate of WBC-owned regeneration units                                                                                                              Quarterly     Green                Better
age of Wokingham borough leisure centres                                                                                                                  Quarterly      Red                 Better
 ticipation in leisure centre activities                                                                                                                  Quarterly      Red                 Worse
 centage of successful homeless preventions                                                                                                               Quarterly      Red                 Worse
 centage of successful homeless reliefs completed                                                                                                         Quarterly     Green                Better
mber of households owed a main housing duty                                                                                                               Quarterly      N/A                 Worse
 portion of applicants supported into settled accommodation                                                                                               Quarterly      Red                 Better

nformation that contains a small amount of sensitive data which is essential to communicate with an individual but doesn’t require to be sent via secure methods.                  Appendix A - KPIs Q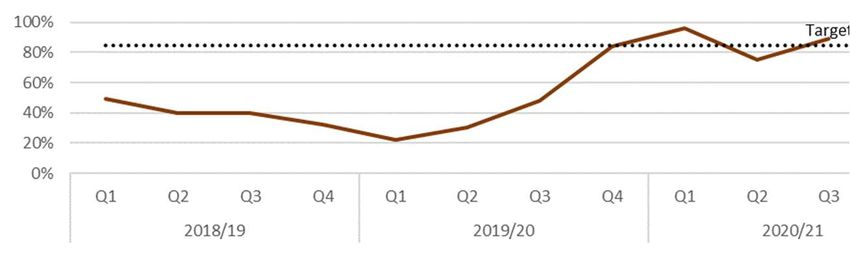
erformance Indicators Q3 2020/21 – Summary
mes, Right Places
 cription                                                                                                                                             Frequency        RAG       Direction of Tr
 rage percentage of Section 106 and Community Infrastructure Levy allocated to schemes                                                                Quarterly       Green           Better
w Homes Survey                                                                                                                                          Annual        Amber           Worse
al Plan Update                                                                                                                                        Quarterly       Amber           No chang
e year housing supply                                                                                                                                   Annual        Amber           N/A
using 1-4-5 Challenge                                                                                                                                 Quarterly       Green           Better
mber of affordable dwellings completed                                                                                                                Quarterly       Green           Worse
centage of planning applications determined in the statutory timescales                                                                               Quarterly       Green           Better
centage of successfully defended appeal decisions                                                                                                     Quarterly       Green           Worse
 portion of planning breaches resolved by negotiation                                                                                                 Quarterly       Green           Better
 portion of housing stock which meets the Decent Homes Standard                                                                                       Quarterly       Green           No chang

  Green Borough
 cription                                                                                                                                             Frequency        RAG       Direction of Tr
mber of fly-tipping incidents                                                                                                                         Quarterly       Green          Better
 entage of household waste reused, recycled and composted                                                                                              Quarterly       Red           Worse
          22

portion of municipal waste sent to landfill                                                                                                            Quarterly      Green          Better
 entage of waste recycled from the kerbside                                                                                                            Quarterly      Green          Worse
bon footprint of Wokingham borough                                                                                                                      Annual        Green          Better
capita CO2 emissions of Wokingham borough                                                                                                               Annual        Green          Better
bon offsetting for Wokingham borough                                                                                                                    Annual        Green          Better
quality                                                                                                                                                 Annual        Green          Better
he Borough Moving
escription                                                                                                                                                Frequency    RAG       Direction of Tr
 erage delay on locally managed A-roads                                                                                                                     Annual    Amber          Better
 erage daily traffic flow – number of vehicles                                                                                                              Annual     N/A           Better
 oportion of highway infrastructure schemes on track for project delivery                                                                                 Quarterly   Green          Better
ublicly available electric charging devices per 100,000 population                                                                                        Quarterly   Green          Better
 oportion of adults who do any walking or cycling, for any purpose, at least once a week                                                                    Annual    Green          Better
 abling sustainable travel: Length of greenways and cycleways delivered                                                                                   Quarterly   Green          No change
ational  Highways
 nformation         & Transport
            that contains          PublicofSatisfaction
                          a small amount    sensitive dataSurvey                                                                                            Annual
                                                           which is essential to communicate with an individual but doesn’t require to be sent via secure methods.    Amber          Better
                                                                                                                                                                              Appendix A - KPIs Q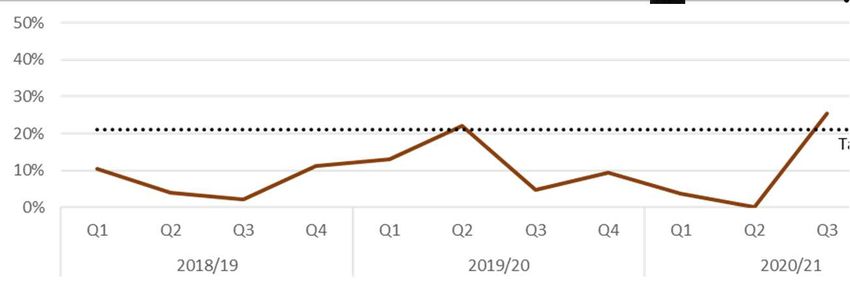
erformance Indicators Q3 2020/21 – Summary
 the way we work/ Be the best we can
 escription                                                                                                                                            Frequency     RAG      Direction of Trav
 umber of resident subscribers to Wokingham Borough Connect – in development                                                                           Quarterly     N/A          N/A
each and engagement of WBC Communications – public reaction to WBC media – in development                                                              Quarterly     N/A          N/A
xpected voluntary staff turnover                                                                                                                       Quarterly    Amber         Worse
 ckness absence – average days lost per employee                                                                                                       Quarterly    Green         Better
ercentage of calls answered                                                                                                                            Quarterly    Green         Better
 umber of Stage 1 complaints received                                                                                                                  Quarterly     Red          Worse
taff engagement survey – Proportion of staff who slightly/ strongly agree “I enjoy working here and would recommend WBC to
                                                                                                                                                        Quarterly               In development
 iends and family”
hannel shift: Moving towards more digital transactions – in development                                                                                Quarterly                In development
evenue budget monitoring forecast position                                                                                                             Quarterly    Green          Better
apital budget monitoring forecast position                                                                                                             Quarterly    Green          Better
eturn on investment portfolio – Property Investment Fund                                                                                               Quarterly    Green          Better
         23

roportion of Corporate Risks assessed as “Very high risk”                                                                                              Quarterly    Amber          Worse
ousing rent arrears (HRA) collection                                                                                                                   Quarterly    Green          Better
ebt management: Number of days for customers to pay                                                                                                    Quarterly    Green          Worse
ebt management: Arrears collection to reduce outstanding debt                                                                                          Quarterly    Green          Better
ouncil Tax collection                                                                                                                                  Quarterly    Green          Better
usiness Rates collection                                                                                                                               Quarterly    Amber          Better

nformation that contains a small amount of sensitive data which is essential to communicate with an individual but doesn’t require to be sent via secure methods.           Appendix A - KPIs Q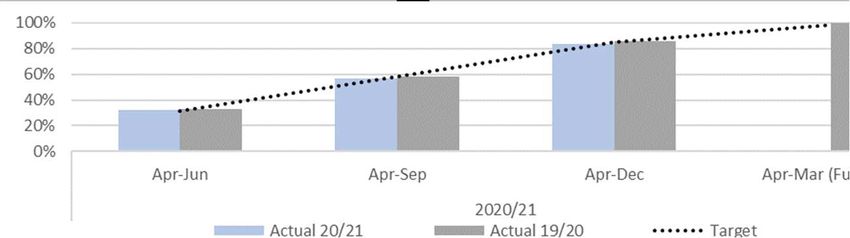
erformance Indicators Q3 2020/21 – Detail                                                                                                                           Appendix A - KPIs Q
Strong Communities - Key Performance Indicator Profiles                                                                                                              Quarter 3 2
al work assessments allocated to commence within 7 days of the requests (counted at point of allocation)                                                              Green
d           Actual            Target              RAG                 Direction of Travel
21           90%                                 Green                    Better
21           85%          75% or more            Green                    Worse
21           88%                                 Green                    Better
 of staff leave on allocations following the relaxation of lockdown restrictions in the
as been redressed in Q3. This quarter has seen the highest number of assessments
9/20 and an improvement in performance, which remains well above target.

e aged 65+ who received reablement from the START team following discharge from hospital, and remained at home 91 days later                                         Red
d            Actual        Target         RAG               Direction of Travel
 21           87%                        Amber                  Better
 21           87%       89% or more      Amber                  No change
         24

 21           80%                          Red                  Worse
ous quarters this year, due to pandemic pressures, patients are being discharged with
vel of illness than would be the case under normal circumstances. Those discharged,
 d unfit by MDT to begin reablement immediately are recorded as returned to
This, coupled with the unfortunate death of four service users on the
 lement pathway, has negatively impacted the figures this quarter.
guarding timeliness – concerns completed within 2 working days                                                                                                       Green
d           Actual            Target              RAG                 Direction of Travel
21           96%                                 Green                    Better
21           75%          85% or more             Red                     Worse
21           89%                                 Green                    Better
a bottle-neck into the safeguarding front-door last quarter, a stabilisation plan was put
hich has successfully increased performance in Q3. After an increase in Q2, concerns
ned to a level similar to preceding quarters and timeliness is improving. Two vacant
 been recruited to which will bring the Adult Safeguarding Hub to full capacity.
nformation that contains a small amount of sensitive data which is essential to communicate with an individual but doesn’t require to be sent via secure methods.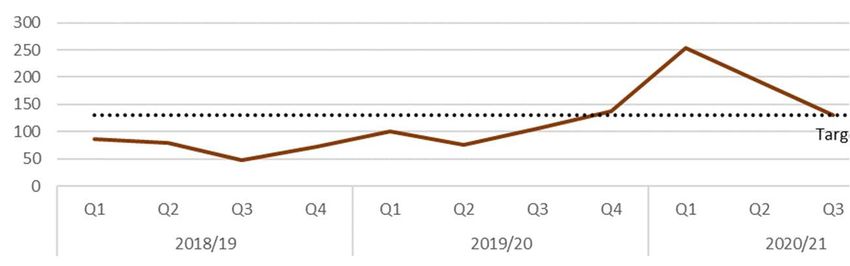
erformance Indicators Q3 2020/21 – Detail                                                                                                                            Appendix A - KPIs Q
Strong Communities - Key Performance Indicator Profiles                                                                                                               Quarter 3 2
 ortion of people receiving long term care who were subject to a review in the last 12 months                                                                         Red
 d           Actual            Target              RAG                 Direction of Travel
 21           67%                                  Red                     Worse
 21           72%          85% or more             Red                     Better
 21           71%                                  Red                     Worse
ce has remained consistent this quarter in spite of the stress placed on the team by
 nce of Covid-19 and the need for additional welfare checks. The on-going focus on
eviews in order to achieve efficiency savings is delivering results. The continued
 n efficiency savings this financial year may impact the service's ability to achieve the
 efore the current health and financial crisis.
manent admissions to residential and nursing care homes per 100k population                                                                                            Green
 d          Actual          Target           RAG                 Direction of Travel
          25

 21         252.77                           Red                     Worse
 21         191.38        130 or less        Red                     Better
 21         130.00                          Green                    Better
 he inclusion of self-funders and CHC funders, Q3 has seen a return to normal
 evels and achievement of the target rate for the first time since the pandemic struck.
 ated that the latest wave of Covid-19 will result in a rise in admissions in Q4.

ormation and Advice at the front door - % of contact referrals closed with ‘NFA – Advice & Information only’                                                          Green
 d           Actual            Target             RAG                  Direction of Travel
 21           14%                                Amber                     N/A
 21           14%          16% or more           Amber                     No change
 21           19%                                Green                     Better
 ty is a reflection of external bodies handling contacts on behalf of ASC. This has led
ase in the rate of 'NFAs' as the number of issues referred to the Service which should
een has increased. Operational teams are now trailing strength-based approaches at
oor.
 nformation that contains a small amount of sensitive data which is essential to communicate with an individual but doesn’t require to be sent via secure methods.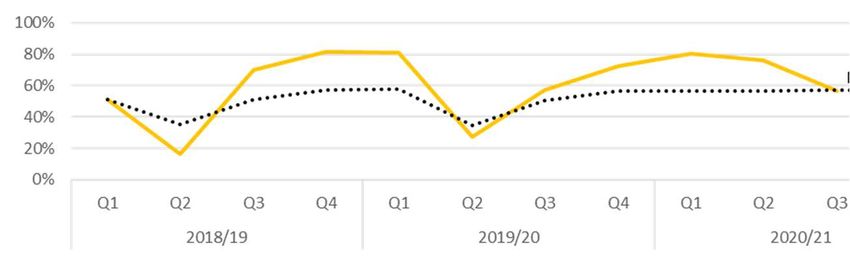
erformance Indicators Q3 2020/21 – Detail                                                                                                                           Appendix A - KPIs Q

Strong Communities - Key Performance Indicator Profiles                                                                                                               Quarter 3 2
portion of people who use services who receive direct payments – snapshot at end of quarter                                                                            Green          N
d           Actual            Target             RAG                  Direction of Travel
21           30%                                Amber                     N/A
21           32%          31% or more           Green                     Better
21           32%                                Green                     No change
 of direct payments has remained consistent across 2020/21.

entage of children who became subject to a Child Protection Plan for a second or subsequent time within 24 months                                                      Red
d           Actual            Target              RAG                 Direction of Travel
21            4%                                 Green                    Better
21            0%           21% or less           Green                    Better
21           25%                                  Red                     Worse
         26

 great emphasis on preventing the need for children to return to a Protection Plan - as
n in performance across previous quarters. Q3 2019/20 also saw a surge in numbers,
20/21 has seen the highest number of children on Protection Plans since 2017.

entage of child protection visits due in the period which were completed to the highest standard                                                                        Amber
d           Actual            Target             RAG                  Direction of Travel
21           81%                                Green                     Better
21           80%          80% or more           Green                     Worse
21           78%                                Amber                     Worse
 he striking increase in Service demand this quarter - and that there is no statutory
nt for visits to be completed within ten days - visit timeliness has remained largely
 Indeed, performance has been better than previous quarters when fewer visits were

nformation that contains a small amount of sensitive data which is essential to communicate with an individual but doesn’t require to be sent via secure methods.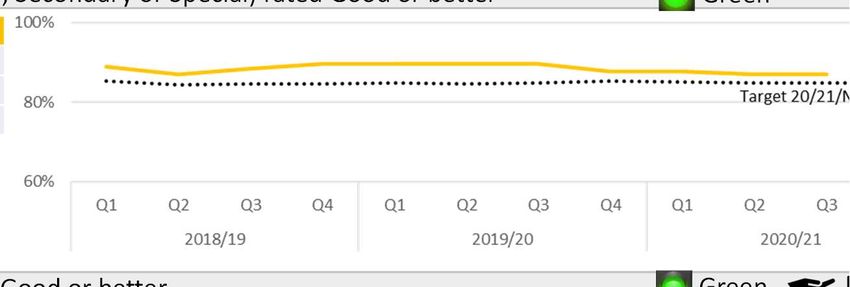
erformance Indicators Q3 2020/21 – Detail                                                                                                                           Appendix A - KPIs Q3
Strong Communities - Key Performance Indicator Profiles                                                                                                               Quarter 3 2
orded crime in Wokingham borough (excluding fraud)                                                                                                                     Amber
d           Actual            Target             RAG                  Direction of Travel
21          1,709                               Green                     Better
21          1,916         1,925 or less         Green                     Worse
21          1,928                               Amber                     Worse
 Q3 is in line with expected levels. Residential burglary has seen a sharp downturn in incidents
ected to lockdown and related increases in people working, and staying, at home. However for
riod, crimes including domestic abuse and violence against the person have seen an increase.

ng Lives - Key Performance Indicator Profiles                                                                                                                         Quarter 3 2
entage of young people with statements or EHCPs participating in Employment, Education or Training                                                                      Green
d             Actual     Target/National          RAG                 Direction of Travel
21             80%                               Green                    Better
         27

21             76%         57% or more           Green                    Worse
21             57%                               Green                    Worse
 ople completing education in the summer have their destination status changed to 'Not
 st of September each year, as do many young people who entered employment or training
 ons have a 52 week currency). It is then the responsibility of the NEET prevention service
hese young people and confirm their destinations. It is therefore not uncommon for the
of young people participating to be low in September but the figure improves as we start to
ege and school enrolment lists.
entage of EHCP Assessments completed within 20 weeks of referral                                                                                                        Red
d           Actual            Target             RAG                  Direction of Travel
21           88%                                Amber                     Better
21           72%          90% or more            Red                      Worse
21           59%                                 Red                      Worse
nues to have a direct impact on the 20 week timescales; however, for plans due in December
chieved. There has been a significant increase in the number of new assessment requests:
 lone saw 28, with a current total of live assessments at 74. As the Service strives to tailor
  each child, willingness to provide parents with additional time to consider plans and visit
 cts timeliness.
nformation that contains a small amount of sensitive data which is essential to communicate with an individual but doesn’t require to be sent via secure methods.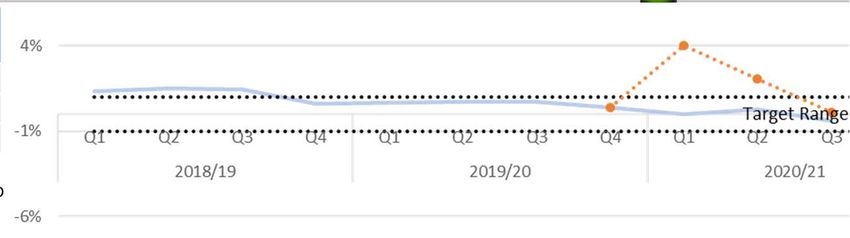
erformance Indicators Q3 2020/21 – Detail                                                                                                                           Appendix A - KPIs Q

ng Lives - Key Performance Indicator Profiles                                                                                                                        Quarter 3 2
entage of former care leavers (up to age 21) in Education, Employment or Training                                                                                      Green
d             Actual           Target             RAG                  Direction of Travel
21             54%                               Green                     Worse
21             62%         52% or more           Green                     Better
21             64%                               Green                     Better
 increasingly challenging economic situation resulting from the COVID-19 pandemic, CSC has
onsistently above target for Care Leaver employment, education and training figures across
eflecting the adaptability of the Service and the importance it places on the futures of the
  which it has responsibility, CSC has managed to increase the percentage of Care Leavers in
 -on-quarter this year.

entage of children who attend a Wokingham state-funded school (Primary, Secondary or Special) rated Good or better                                                     Green          N
d             Actual           Target             RAG                  Direction of Travel
21             88%                               Green                     No change
21             87%         85% or more           Green                     Worse
         28

21             87%                               Green                     No change
sted inspections have been suspended as part of the COVID-19 response so performance
changed for the year to date.

entage of early years settings in Wokingham borough rated, by Ofsted as, Good or better                                                                                Green         N
 d            Actual           Target                RAG                Direction of Travel
 9            98.6%        96.1% or more            Green                  Worse
20            98.0%        96.0% or more            Green                  Worse
 0            98.0%        96.0% or more            Green                  No change
 0            98.0%        96.0% or more            Green                  No change

ed inspections have been suspended as part of the COVID-19 response so performance
hanged for the year to date.

nformation that contains a small amount of sensitive data which is essential to communicate with an individual but doesn’t require to be sent via secure methods.
erformance Indicators Q3 2020/21 – Detail Appendix A - KPIs
ng Lives - Key Performance Indicator Profiles Quarter 3 2
s to Wokingham Borough libraries Red
d Actual Target RAG Direction of Travel
21 0 Red Worse
Visits within 10%
21 16,722 Red Better
of previous qtr
21 12,841 Red Worse
t of the year, libraries were required to close. Due to the additional resource
nts to operate Covid-safe environments and staff redeployments, libraries have only
to operate at a significantly reduced capacity in the last quarter. Under current
equirements libraries are only able to offer a Click & Collect service.
pletion to time and budget of regeneration projects (Peach Place, Elms Field, Carnival Pool) Green N
Milestones (Target) Delivered Actions Time B
Elms Field – whole-scheme completion 1st Sep
29
Elms Field completed and handed over. Carnival demolition has commenced and is ongoing. Slight delay With
2020. Commence demolition at Carnival.
Practical completion of Elms Field and fit-out of
Practical completion at Elms Field achieved on 1st Sep 2020 and fit out of businesses ongoing.
businesses. Continue Carnival demolition and On time With
Carnival site demolished and Southgate House demolition commenced in July 2020.
secure Southgate House.
Further tenants opened and signed for Elms Field. Carnival demolition complete send Sep 20 and site
Ongoing fit-out of businesses and signing of new
handed over to Pellikaan (main contractor) Oct 20. Preparatory works commenced ready for On time With
tenants. Construction works start at Carnival.
construction to begin early 2021.
upancy rate of WBC-owned regeneration units Green
d Actual Target RAG Direction of Travel
21 78% Green N/A
21 87% 78% or more Green Better
21 90% Green Better
cupancy rate equates to around £2m committed income from the lettings from Peach Place
eld. This is a very positive result in what has, and continues to be a very difficult market, which
es the regeneration of Wokingham has responded exceptionally well to market requirements.
m further potential tenants remains high, which is at odds with the national picture.
nformation that contains a small amount of sensitive data which is essential to communicate with an individual but doesn’t require to be sent via secure methods.erformance Indicators Q3 2020/21 – Detail Appendix A - KPIs Q
ng Lives - Key Performance Indicator Profiles Quarter 3 2
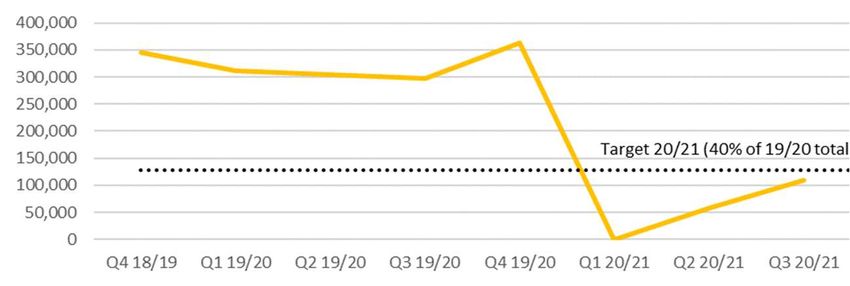
ge of Wokingham borough leisure centres Red
d Actual Quarterly Target RAG Direction of Travel
21 0 Red Worse
127,556 or more
21 57,055 Red Better
(40% of 19/20 usage)
21 109,849 Red Better
d-19 has had a significant impact on attendance and usage at leisure centres across
borough, Q3 has seen an improvement in visits. All leisure centres had reopened, post
lbeit at 50% capacity. Leisure centres then closed again due to Tier 4 restriction. The target for
o achieve 40% of the total usage recorded in 19/20. This target is considered to be reflective
nt circumstances caused by Covid-19 and taking into account the social distancing restrictions
e in place once leisure centres can reopen.
cipation in leisure centre activities Red
d Actual Target RAG Direction of Travel
21 0 Red Worse
21 543 1,060 or more Red Better
30
21 388 Red Worse
or 2020/21 is to achieve 50% of the participation numbers recorded in Wokingham borough
res during 2019/20. This target is considered to be reflective of the current circumstances
ovid-19 and taking into account the social distancing restrictions which will be in place once
res can reopen. Marketing is underway to promote special membership offers to encourage
turn once centres can reopen.
centage of successful homeless preventions Red
d Actual Target RAG Direction of Travel
21 67% Green Worse
21 67% 50% or more Green No change
21 34% Red Worse
ouseholds whose prevention duty ended in Q3 20/21, 15 successfully secured accommodation
s or more. Performance has fallen in Q3 primarily due to the current national lockdown;
isits to properties and with fewer affordable properties becoming available. The majority of
s were due to residents withdrawing their application for assistance, no further contact being
plicants were found not to be homeless or were referred to another local authority. The team
work closely with residents, landlords and families to try to resolve any tenancy-related issues
ction proceedings
nformation and to
that contains prevent
a small homelessness
amount of sensitivewherever
data whichpossible.
is essential to communicate with an individual but doesn’t require to be sent via secure methods.erformance Indicators Q3 2020/21 – Detail Appendix A - KPIs
centage of successful homeless reliefs Green
od Actual Target RAG Direction of Travel
/21 0% Red Worse
/21 50% 25% or more Green Better
/21 52% Green Better
rter 3 20/21 there were 25 households whose relief duty ended; 13 of these successfully
commodation for 6+ months. There has been an increase in the number of successful
eliefs being offered; primarily achieved through securing Council and Housing Association
A full housing journey for the residents we are supporting, will be seen at the end of the
ar. The quarterly monitoring provides a snap shot of the current status however further
be available at year end.
centage of households owed a main duty
d Actual South East England Direction of Travel
21 (3/22) 14% Better
31
65% 66%
21 (11/15) 73% Worse
(Q4 19/20) (Q4 19/20)
21 (9/9) 100% Worse
ness is not successfully prevented or relieved, the local authority will owe the main housing
seholds who have a priority need and are not homeless intentionally. In Quarter 3 20/21,
ds given a main duty decision were owed a Main Housing Duty. Whilst a target is not
this indicator, the aim is to support households through prevention and relief wherever
educe the risk of homelessness.
portion of applicants supported into settled accommodation Red
d Actual Target RAG Direction of Travel
21 40% Green Worse
21 25% 40% or more Red Worse
21 26% Red Better
1 108 applications were received; of which 28 (26%) were successfully supported into
ommodation. All homelessness KPIs are directly impacted by Covid-19 lockdown
Demand is forecast to continue to rise in Q4.
nformation that contains a small amount of sensitive data which is essential to communicate with an individual but doesn’t require to be sent via secure methods.erformance Indicators Q3 2020/21 – Detail Appendix A - KPIs Q
omes, Right Places - Key Performance Indicator Profiles Quarter 3 2
age percentage of Section 106 and Community Infrastructure Levy allocated to schemes Green
d Actual Target RAG Direction of Travel
21 99% Green No change
21 99% 94% or more Green No change
21 100% Green Better
Homes Survey – Percentage of responders satisfied/very satisfied with their new home Amber
d Actual Target RAG Direction of Travel
8 89% Green N/A
9 86% 85% or more Green Worse
0 83% Amber Worse
esidents would most like to improve about their new home experience is the developer after care
32
e to snagging issues. This is followed by access to local amenities, of which most mentioned shops,
s, schools and GPs. Road quality was also a key factor where residents felt there was room for
t; issues with potholes and congestion as areas become more populated. Many departments
urvey results to gain further insight into resident behaviour and satisfaction levels.
l Plan Update Amber N
stones (Target) Delivered Actions RAG
ication of a report on the initial All the consultation responses have been analysed by officers. A report on the initial outcomes of the consultation is due to
Green
omes of the consultation be published by the end of Aug 20.
l Development Scheme (LDS) (Jan 2020)
All the draft Local Plan consultation responses have been analysed, and a summary statement of the main issues raised has
out Regulation 19 consultation for Amber
been prepared.
/Oct 2020
Regulation 19 consultation not undertaken for reasons explained in the rationale. The impact of the change to the DPEX on
sider future Local Plan programme and
the draft Local Plan has been reported to the Planning and Transport Policy Member Working Group. Alternative potential Amber
uired actions
strategies for managing development are being reviewed ahead of future consideration by the Working Group.
raft Local Plan consultation, government announced the joint bid to the Housing Infrastructure Fund (HIF) by Wokingham, West Berkshire and Reading councils to forward fund infras
rden town was unsuccessful, necessitating consideration of alternative finance models. In addition the Urgent Action Area and the Detailed Emergency Planning Zone (DEPZ) around AWE
expanded
nformationand
thatnow cover
contains the Grazeley
a small area,
amount of requiring
sensitive further
data which investigation.
is essential Further engagement
to communicate and investigation
with an individual with stakeholders
but doesn’t require is required,
to be sent via secure which will impact on the timings of the next s
methods.erformance Indicators Q3 2020/21 – Detail Appendix A - KPIs Q
omes, Right Places - Key Performance Indicator Profiles Quarter 3 2
year housing supply Amber
Actual Target RAG The deliverable housing land supply is assessed at 5.23 years at 31 Ma
6.68 years (as at 30 Nov 17, housing need of 894 dwellings/year) 5 years Green Landowners and developers are were re-surveyed over the Summer 202
6.83 years (as at 31 Mar 2018, housing need of 864 dwellings/year) 6 years Green account of the initial impacts of the Covid-19 pandemic. National policy
6.39 years (as at 31 Mar 2019, housing need of 804 dwellings/year) 6 years Green deliverable supply in excess of five years. The assessed supply still exceed
policy, however the supply falls short of the council set target of 6 years.
5.23 years (as at 31 Mar 2020, housing need of 789 dwellings/year) 6 years Amber
sing 1-4-5 Challenge Cumulative Green
020, a further 46 homes have been completed in 20/21 in addition to the 68 completed in
ing total completion of 114 to date. 149 housing programmes are on-site and a further
ogressing in partnership with Wokingham Homes, Loddon Homes & Berry Brook Homes
h HRA.
33
mber of affordable dwellings completed Cumulative Green
Actual Cumulative Target RAG Direction of Travel
21 36 36 46 or more Amber Worse
21 56 92 92 or more Green Worse
21 49 141 138 or more Green Worse
ty of housing delivery is due to take place during Quarters 3 and 4. Overall predicted
s for the year are slightly down this year compared to previous years as affordable housing
e strategic sites is coming to completion.
entage of planning applications determined in the statutory timescales Green
d Actual Target RAG Direction of Travel
21 98% Green Better
21 98% 60% or more Green No change
21 99% Green Better
nformation that contains a small amount of sensitive data which is essential to communicate with an individual but doesn’t require to be sent via secure methods.erformance Indicators Q3 2020/21 – Detail Appendix A - KPIs Q
omes, Right Places - Key Performance Indicator Profiles Quarter 3 2
entage of successfully defended appeal decisions Green
d Actual Target RAG Direction of Travel
20 78% Green Better
21 78% 65% or more Green No change
21 74% Green Worse
Delivered (68)
On-site (193)
portion of planning breaches resolved by negotiation Green
d Actual Target RAG Direction of Travel
21 71% Green Worse
21 65% 50% or more Green Worse
21 78% Green Better
34
ortion of housing stock which meets the Decent Homes Standard Green N
d Actual Target RAG Direction of Travel
21 99.1% Green Worse
21 99.9% 90% or more Green Better
21 99.9% Green No change
of Q3, four homes in the housing stock are yet to meet the Decent Homes Standard; due to
9 restrictions which are affecting the supply of doors (required at all four properties). Once
ations are complete, the service will achieve a 100% decency rate for the rest of the
ar.
nformation that contains a small amount of sensitive data which is essential to communicate with an individual but doesn’t require to be sent via secure methods.rformance Indicators Q3 2020/21 – Detail Appendix A - KPIs Q
& Green Borough - Key Performance Indicator Profiles Quarter 3 2020
mber of fly-tipping incidents Green
d Actual Target RAG Direction of Travel
21 468 Green Worse
21 645 598 or less Red Worse
21 566 Green Better
forecast there to be around 2,656 fly-tipping incidents in Wokingham borough during
he 2020/21 improvement target is to achieve a 10% reduction to this forecast by March 2021.
t for 2020/21 is based on the impact of Covid-19 on the Council’s waste disposal services and,
r, the partial closing and reduced capacity of the two recycling centres. An improvement and
tions plan is in place, along with a cross-party Member working group to monitor progress.
centage of household waste reused, recycled and composted Red
d Actual Target RAG Direction of Travel
35
21 53% Green Better
21 52% 52% or more Green Worse
21 46% Red Worse
e is below target due to the continued impact of wet paper on recycling. Recycling rates
e during Q3 and Q4 each year due to low tonnages collected from garden waste. Q3 20/21
sional and subject to change.
portion of municipal waste sent to landfill Green
d Actual Target RAG Direction of Travel
21 4.88% Green Better
21 4.90% 5% or less Green Worse
21 3.10% Green Better
ata is provisional and subject to change.
nformation that contains a small amount of sensitive data which is essential to communicate with an individual but doesn’t require to be sent via secure methods.erformance Indicators Q3 2020/21 – Detail Appendix A - KPIs Q
& Green Borough - Key Performance Indicator Profiles Quarter 3 2
centage of waste recycled from the kerbside Green
d Actual Target RAG Direction of Travel
21 37.2% Green Better
21 31.4% 26% or more Green Worse
21 26.5% Green Worse
ata is provisional and subject to change.
36
bon footprint of Wokingham borough Green
d Actual Target RAG Direction of Travel
2017) 580 KtCO2e Baseline N/A N/A
Within 1% of
2018) 573 KtCO2e Green Better
571.6 or less
2019) 565.9 or less
footprint is based on government figures, reported two years in arrears, published by the
t for Business, Energy and Industrial Strategy. The baseline corresponds to the Wokingham
otprint in 2017. Carbon dioxide reductions from interventions led by the Council are
o be seen from 2022 when planned projects will be fully implemented. Some of the Council’s
ns include retrofitting public buildings and domestic properties and renewable energy
projects.
nformation that contains a small amount of sensitive data which is essential to communicate with an individual but doesn’t require to be sent via secure methods.erformance Indicators Q3 2020/21 – Detail Appendix A - KPIs Q
& Green Borough - Key Performance Indicator Profiles Quarter 3 2
capita CO2 emissions of Wokingham borough Green
od Actual Target RAG Direction of Travel
(2017) 3.5 Baseline N/A N/A
(2018) 3.4 3.41 or less Green Better
(2019) 3.21 or less
Borough is in a period of growth, with development targets over the coming years. This
ncrease carbon dioxide emissions through construction work and population growth. These
missions may have a negative impact on the carbon footprint. Per capita emissions will
e the decrease in emissions in the context of a growing population. A continued population
okingham borough (at a similar rate to that seen over the last five years) has been considered
asting for this measure.
37
bon offsetting for Wokingham borough Green
d Actual Target RAG Direction of Travel
2017) -15.64KtCO2e Baseline N/A N/A
2018) -15.86 KtCO2e -15.86 Green Better
2019) -15.88
net-zero carbon, Wokingham borough will need to offset some of the carbon dioxide it emits.
es is one of the best ways to do this. Sequestration levels have been steadily increasing in
. Plans are in place to increase afforestation rates and rewilding in areas of the borough;
ly to be implemented from 2023 onwards. Hence the increase in carbon sequestration is
be seen from 2026.
quality Green
d Wokingham Town Twyford Crossroads M4 Target RAG Direction of Travel
32.9μg/m3 40μg/m3 Green Better
33.0μg/m3 29.9μg/m3 39.1μg/m3 40μg/m3 Green Worse
40μg/m3
ource of air quality pollutants in Wokingham borough is road transport, and the main pollutant of concern is nitrogen dioxide (NO2). There are three Air Quality Management Areas in Woking
lared as exceeding the annual average NO2 objective. These are located in Wokingham Town Centre, Twyford Village Centre Crossroads and along, and 60m either side of, the M4 throughou
erall, NO2 levels
nformation in Wokingham
that contains borough
a small amount remain data
of sensitive below target
which and hence
is essential performancewith
to communicate is reported as Green
an individual for 2019
but doesn’t reporting
require year.
to be sent via secure methods.erformance Indicators Q3 2020/21 – Detail Appendix A - KPIs Q
g the Borough moving - Key Performance Indicator Profiles Quarter 3 2
erage delay on locally managed A-roads – seconds per vehicle per mile Amber
Actual South East RAG Direction of Travel
42.1 37.5 (up to 41.3) Amber Worse
40.5 37.6 (up to 41.4) Green Better
38.4 35.1 (up to 37.9) Amber Better
erage daily traffic flow – number of vehicles
Actual South East RAG Direction of Travel
6,231 5,233 Better
6,046 5,223 N/A Better
5,967 5,255 Better
The Council’s transport team have carried out some analysis to explore ave
traffic flow between Apr – Dec 2020 and compare this to flow rates in the
38
year. A sample was taken at two site locations (A4 Bath Road and A32
Road). These charts show the average flow at these two locations per mont
portion of Highways Infrastructure Schemes on track for delivery Green
Actual Target RAG Direction of Travel For Q3 2020/21, 74% (11 phases) are reported as Green
21 60% Green Better since they are on track for delivery, 13% (2 phases) are
21 53% 51% or more Green Worse Amber since there is some time delay or risk identified
21 74% Green Better and the remaining 13% (2 phases) are reported as Red.
re provides an overview of progress on the highway infrastructure schemes. Six major
chemes are being monitored comprising of Arborfield Cross Relief Road, North and South 3 schemes have improved from Amber to Green in Q3
Distributor Roads, Nine Mile Ride, Barkham Bridge, Winnersh Relief Road Phase 2. A further 20/21, and 1 scheme has deteriorated from Amber to Red.
tional schemes, Thames Valley and Coppid Beech Park and Ride and California Cross Roads,
onitored as part of Highways Infrastructure . Some of these schemes include subsidiary
ses and as such a total of 15 phases contribute to this measure and each is assigned a RAG
dicate progress.
nformation that contains a small amount of sensitive data which is essential to communicate with an individual but doesn’t require to be sent via secure methods.erformance Indicators Q3 2020/21 – Detail Appendix A - KPIs Q
g the Borough moving - Key Performance Indicator Profiles Quarter 3 2
blicly available electric charging devices per 100,000 population Green
No. devices Rate per population South East (rate) RAG Direction of Travel
52 31.0 26.7 Green Better
52 30.4 27.0 Green No change
53 31.0 28.9 Green Better
lished by the Department for Transport. The latest release is for Oct 2020. Since October,
m borough has 53 publicly available charging devices; which equates to 31 per 100,000
(comparable with around 60%-80% of local authorities across the United Kingdom). From
population estimate was used for all local authorities. Therefore for Wokingham, although
r of devices remains fairly static the rate per 100,000 may appear different due to a higher
estimate now being used in the calculations. The Council has a target to deliver 1,000
rge devices by 2025.
39
oportion of adults who do any walking or cycling, for any purpose, at least once a week Green
d Actual Target RAG Direction of Travel
17 74.4% N/A N/A
18 77.6% 74.4% or more Green Better
19 80.4% 77.6% or more Green Better
20 80.4% or more
ational indicator reported by the Department for Transport through data collected from the National Travel Survey and Active Lives Survey, run by Sport England. The Nation
household survey of personal travel by residents of England travelling within Great Britain, from data collected via interviews and a one-week travel diary. The Active Lives Su
survey by residents of England from data collected via a web-survey. Latest available national data is for 2018/19 (which was last updated in Aug 2020). The next update, for 2
d Summer 2021.
abling sustainable travel: Length of greenways and cycleways delivered Green N
d Actual Target RAG Direction of Travel The Council aims to deliver additional cycleway/greenway areas between 20/21 an
21 0km N/A Section 1 of these improvement plans covers Cantley Park to Woosehill Meadows. Th
670m by May planned to be completed by May 2021 (timescales have been adjusted) and wi
21 0km Green No change
21 surfacing of 670m at Cantley Park. The tender is currently being evaluated and contra
21 0km Green No change
scheduled to commence work in Jan 21.
nformation that contains a small amount of sensitive data which is essential to communicate with an individual but doesn’t require to be sent via secure methods.erformance Indicators Q3 2020/21 – Detail Appendix A - KPIs Q3
g the Borough Moving - Key Performance Indicator Profiles Quarter 3 2
tional Highways & Transport Public Satisfaction Survey Amber
Overall Target/NHT Average RAG Direction of Travel
49% 50% Amber N/A
51% 52% Amber Better
ts are published by National Highways & Transport Network (NHT). The survey measures
across six themes and each Local Authority is assessed against the NHT average in order to
Delivered (68)
performance. This indicator reports on overall satisfaction recorded for Wokingham borough
ith NHT average scores. The chart displays Wokingham’s scores for each theme compared to
rages (shown in grey). On-site (193)
ng the way we work/ Be the best we can - Key Performance Indicator Profiles Quarter 3 2
mber of resident subscribers to Wokingham Borough Connect
Total subscribers Of which are for Covid-19 alerts Of which are for other alerts
49,408
40
53,367
50,042 39,712 (79%) 10,330 (21%)
f Q3, Wokingham Borough Connect has approximately 50,000 subscribers; 79% of which are signed
ly for Covid-19 alerts.
okingham Borough Council social media impressions, engagement and followers
Total social media impressions Social media engagements Social media followers (as Jan 21)
1,239,735 57,043 30,779
nformation that contains a small amount of sensitive data which is essential to communicate with an individual but doesn’t require to be sent via secure methods.erformance Indicators Q3 2020/21 – Detail Appendix A - KPIs Q3
ng the way we work/ Be the best we can - Key Performance Indicator Profiles Quarter 3 2
pected voluntary staff turnover Amber
d Actual Target RAG Direction of Travel
21 9% Amber Worse
12.5%
21 8% Amber Worse
(+/- 2.5%)
21 7% Amber Worse
19 pandemic continues to drive voluntary turnover down as people seek to retain
in an unstable job market. Staff turnover between 10-15% is considered to be
and in line with national trends. Hence performance within this range is reported as
kness absence – average days lost to sickness per employee – rolling 12 months Green
d Actual Target RAG Direction of Travel
41
21 6.5 Green Better
21 5.7 6.6 or less Green Better
21 5.0 Green Better
bsence continues to fall during the pandemic. The Council is seeing few cases of
elated absence Home working may also be a factor as staff work through minor
mplaints which might normally keep them from a place of work.
rcentage of calls answered Green
d Actual Target RAG Direction of Travel
21 94% Green Better
21 93% 95% or more Amber Worse
21 96% Green Better
s have increased slightly, compared to the same period last year. However there has been a
e in the number of digital interactions via email, online web chat and forms. Performance has
ained due to additional resources allocated to the team from redeployed library and
taff to meet increased demand; which has helped manage call volumes and processing work.
nformation that contains a small amount of sensitive data which is essential to communicate with an individual but doesn’t require to be sent via secure methods.erformance Indicators Q3 2020/21 – Detail Appendix A - KPIs Q
ng the way we work/ Be the best we can - Key Performance Indicator Profiles Quarter 3 2
mber of Stage 1 complaints received Red
d Actual Target RAG Direction of Travel
21 20 Green Better
21 38 36 or less Amber Worse
21 46 Red Worse
complaints were related to housing maintenance. Over the winter period there has been a
nd for repairs, compounded by Covid-19 restrictions and social distancing, contractors have
e to complete as many maintenance calls per day. This has led to customer dissatisfaction
ease in complaints received this quarter. The team are working to proactively manage
pectations around timescales for repair work and liaising continuously with contractors to
anage workload.
nue budget monitoring forecast position Green
Actual (incl.
Target
Actual (BAU) RAG Cov-19) RAG Direction of Travel
0.0% Green Better
42
0.3% +/-1% Green 2.0% Red Worse
-0.43% Green 0.08% Green Better
is monitoring the impact of Covid-19 very closely and is reporting to central government on a
is. We also continue to make representations to government for the need for extra funding to
dditional spend from Covid-19. Current revenue forecast reflects an overspend, including
£119,000.
tal budget monitoring forecast position Green
d Actual Target RAG Direction of Travel
21 0.0% Green Better
21 -0.3% +/-1.0% Green Better
21 -1.0% Green Better
red financially prudent to report an underspend as Green (on target) when there are no
e impacts upon service delivery occurring as a result. There may often be some variance in
actuals throughout the year and at year end depending on the nature of any planned
The concern is whether these are unexplained or uncontainable and this would become
rough regular financial monitoring and the accounting practices that exist within the council.
ng reported at Q3 20/21 represents a forecast variance underspend of £1.8m.
nformation that contains a small amount of sensitive data which is essential to communicate with an individual but doesn’t require to be sent via secure methods.erformance Indicators Q3 2020/21 – Detail Appendix A - KPIs Q
ng the way we work/ Be the best we can - Key Performance Indicator Profiles Quarter 3 2
urn on investment portfolio – Property Investment Fund Green
d Actual Target RAG Direction of Travel
21 5.25% Green No change
21 5.08% 5% Green Worse
21 5.29% Green Better
rate is forecast to drop in 2021 as we manage expected lease expiries and of course suffer
ncome default due to Covid-19 economic impact.
portion of Corporate Risks assessed to be “very high” risk Amber
Borough Council has 19 corporate risks identified, and being monitored, in the Corporate Risk Register. A risk is
o be 1) low-medium, 2) high, or 3) very high depending on the likelihood of the risk occurring and the impact it
A risk considered to have high impact as well as high likelihood is reported as "very high" risk and is monitored
performance measure. Five risks are currently deemed to be very high; these relate to 1) budgeting and financial
43
t, 2) local play delays and appeals, 3) SEND reforms, 4) adult social care provider market and 5) regulatory
using Rent Arrears (HRA) collection Green
d Actual Target RAG Direction of Travel
21 31.9% 32.7% Green Worse
21 50.4% 49.3% Green Better
21 75.0% 75.0% Green Better
travel for this indicator is based on the variance between actual performance and the
get. For example, if actual is closer to target in a quarter then performance is reported as
nformation that contains a small amount of sensitive data which is essential to communicate with an individual but doesn’t require to be sent via secure methods.erformance Indicators Q3 2020/21 – Detail Appendix A - KPIs Q
ng the way we work/ Be the best we can - Key Performance Indicator Profiles Quarter 3 2
ebt management: Number of days for customers to pay Green
d Actual Target RAG Direction of Travel
21 24.57 Green N/A
21 17.32 30 days or less Green Better
21 28.63 Green Worse
ebt management: Arrears collection to reduce outstanding debt Cumulative Green
d Actual Target RAG Direction of Travel
21 53% 18% Green N/A
21 59% 35% Green Better
21 66% 53% Green Better
44
uncil Tax collection Cumulative Green
d Actual Target RAG Direction of Travel
/21 29.1% 30.5% Green Worse
/21 57.2% 58.0% Green Better
/21 86.3% 86.0% Green Better
travel for this indicator is based on the variance between actual performance and the assigned
example, if actual is closer to target in a quarter then performance is reported as better.
iness Rates collection Cumulative Amber
d Actual Target RAG Direction of Travel
21 32.0% 31.2% Green Worse
21 56.7% 57.8% Amber Worse
21 83.5% 84.5% Amber Better
ant payments were outstanding in December 2020. However one payment was received in
and this will be reflected in the Q4 performance update. The team are working closely with
es to support them through these very challenging times. Direction of travel for this KPI is
enformation that contains
variance between a small
actual amount of sensitive
performance data whichtarget.
and the assigned is essential to communicate with an individual but doesn’t require to be sent via secure methods.You can also read