Application of CONDUITS-DST in Brussels - CONDUITS training workshop 26 November 2014 Madrid Pierre Schmitz, Brussels Mobility Antonios ...

Page created by Tina Robbins
 
CONTINUE READING
Application of CONDUITS-DST in Brussels - CONDUITS training workshop 26 November 2014 Madrid Pierre Schmitz, Brussels Mobility Antonios ...
Application of CONDUITS-DST in Brussels
                CONDUITS training workshop
                     26 November 2014
                           Madrid
              Pierre Schmitz, Brussels Mobility
    Antonios Tsakarestos, Technische Universität München
           Ioannis Kaparias, City University London
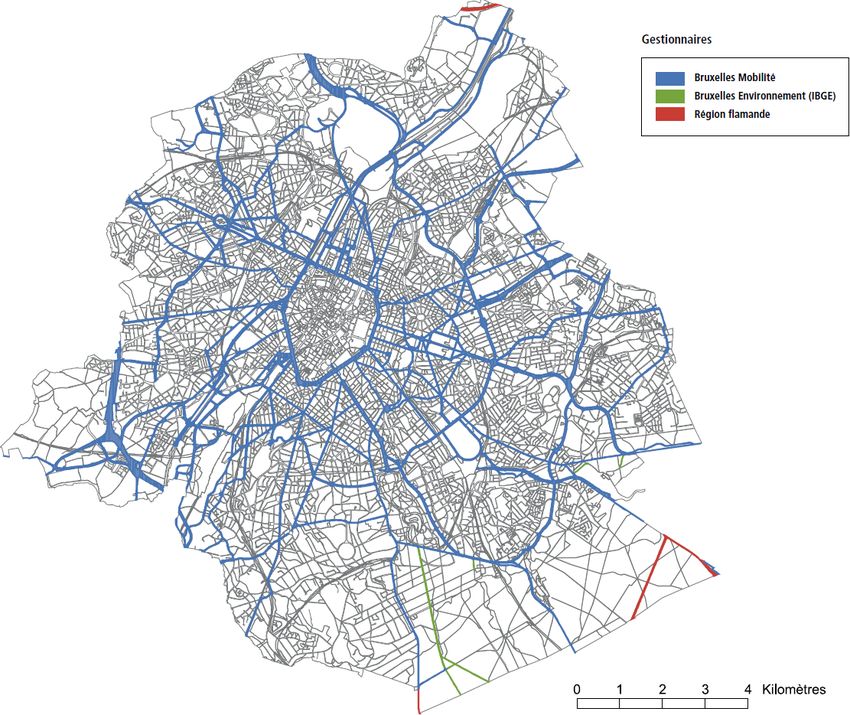
Application of CONDUITS-DST in Brussels - CONDUITS training workshop 26 November 2014 Madrid Pierre Schmitz, Brussels Mobility Antonios ...
The Brussels Region

Population       : > 1,1 million inhabitants
Surface          : 161,4 km²
Density          : 6.500 inh/km²
Road network
Region     : 350 km
Communes :1400 km
PT network
Metro      : 40 km
Tram       : 139 km
Bus        : 445 km
Commercial speeds (2009)
Tram       : 16,8 km/h
Bus        : 17,0 km/h                                                              2

       CONDUITS • 26/11/2014 • Madrid • P. Schmitz - A. Tsakarestos - I. Kaparias
Application of CONDUITS-DST in Brussels - CONDUITS training workshop 26 November 2014 Madrid Pierre Schmitz, Brussels Mobility Antonios ...
Some actions to be implemented in Brussels

The Brussels Mobility Plan IRIS 2 at horizon 2015 – 2020
and particularly 2 of its 9 main actions
  • 2. To improve the PT attractiveness
      • …
      • To develop a complete network allowing a good gridding of
        the Region, with “high level service” (in other words, fast,
        regular, mainly by bus, high-frequency) lanes and benefiting
        from the maximal priority on the traffic lights
      • …
  • 9. Improve the Governance to guarantee the IRIS objectives
      • To measure the progress of the realizations on the
        quantitative and qualitative levels                                        3

      CONDUITS • 26/11/2014 • Madrid • P. Schmitz - A. Tsakarestos - I. Kaparias
Application of CONDUITS-DST in Brussels - CONDUITS training workshop 26 November 2014 Madrid Pierre Schmitz, Brussels Mobility Antonios ...
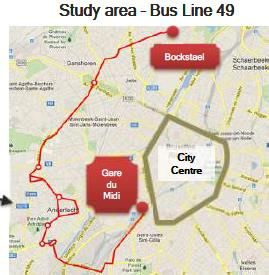
Need of a tool to monitor the expected results
of the ITS implementations for bus priority

Short-term
  •   Increase average speed of the buses
  •   Increase average speed of the private vehicles
      displacement parallel to the line
  •   Reduction average speed of vehicles crossing the line
  •   Increase of air and noise pollution by cars and busses

Medium-term
  •   Change of route choices for private car drivers
  •   Reduction of time losses in the implementation area

Long-term
  •   Demand shift towards public transport reduces private car rides              4

      CONDUITS • 26/11/2014 • Madrid • P. Schmitz - A. Tsakarestos - I. Kaparias
Application of CONDUITS-DST in Brussels - CONDUITS training workshop 26 November 2014 Madrid Pierre Schmitz, Brussels Mobility Antonios ...
Brussels’ needs: relevant Key Performance
Indicators and a Decision Support Tool (DST)

KPI’s (already done during the CONDUITS European R&D project)
 • Easy to use and communicate to decision makers and public
     – No or light extra work for the users
     – Clarity for the political decision makers and the public
 • Adapted to cities individuality
     – Geographical scale : sections, roads, zones, network, …
     – Adaptability :
         Ability to use all kind of urban data that are relevant to
           quantify a performance
         Weighting possibilities
DST (1st step to be done during the Brussels’ case study)
 • Easy to use by many cities in order to allow the
   sharing/dissemination of the results
    – Directly linked to VISSIM and starting with Pollution                       5

     CONDUITS • 26/11/2014 • Madrid • P. Schmitz - A. Tsakarestos - I. Kaparias
Application of CONDUITS-DST in Brussels - CONDUITS training workshop 26 November 2014 Madrid Pierre Schmitz, Brussels Mobility Antonios ...
Brussels’ case study - Evaluation with VISSIM of
bus priority systems by using the CONDUITS DST

Priority bus line 49
    • Many intersections
      with traffic lights

4 VISSIM simulations
    • Morning and
      evening
      peak hours
    • Situation before
      and after
      implementation
                                                                                  6

     CONDUITS • 26/11/2014 • Madrid • P. Schmitz - A. Tsakarestos - I. Kaparias
Application of CONDUITS-DST in Brussels - CONDUITS training workshop 26 November 2014 Madrid Pierre Schmitz, Brussels Mobility Antonios ...
The CONDUITS Decision Support Tool (DST)

1st step of the CONDUITS DST development:
Automatic calculation of the KPIPollution in VISSIM simulations

      with
      •KPIPollution : ″Pollution″ Key Performance Indicator
      •WVT          : ″Type of vehicle″ weighting factor
      •WET          : ″Type of emission″ weighting factor
      •QVT,ET       : ″Emissions″ by type of pollutant and
                       by type of vehicle
                                                                                   7

      CONDUITS • 26/11/2014 • Madrid • P. Schmitz - A. Tsakarestos - I. Kaparias
Results of the Brussels’ case study (1)

       The first results reflect the expected short term effects
            •       Improvement of the public transport quality:
                                – increase average speed of the buses
                                – reduction of the stops at intersections
                        Ave. Speed [km/h]                                             Number of Stops [-]
 19                                                                 12
                                                                                11
                                                    18.5
18.5                                                                                           -18 %
         before                        + 6%                         10                                      before
                        + 3%                                                              9
 18      after                                                                                              after
                                                                     8
                         17.3               17.4                                                       7
17.5
                 16.8
                                                                     6                                                  - 43 %
 17
                                                                                                                    4
                                                                     4
16.5

 16                                                                  2

15.5                                                                 0
                  southbound                 northbound                          southbound            northbound
                                                                                                                                 8

                  CONDUITS • 26/11/2014 • Madrid • P. Schmitz - A. Tsakarestos - I. Kaparias
Results of the Brussels’ case study (2)

… but increase in pollution

                                   + 3%                                      + 7,5 %

                   … what is (hopefully) normal !                                      9

    CONDUITS • 26/11/2014 • Madrid • P. Schmitz - A. Tsakarestos - I. Kaparias
Results of the Brussels’ case study (3)

Sensitivity analysis with a
pragmatic methodology                                                              ~ - 1,8%
•   The given demand levels of
    the relevant flows are
    progressively reduced in
    increments of 1%
•   and the KPI values are
                                                                                   ~ - 3,9%
    recalculated for each
    scenario.

                                                                                              10

      CONDUITS • 26/11/2014 • Madrid • P. Schmitz - A. Tsakarestos - I. Kaparias
Increase in values compared to „before“-sceario
                                                                                                                                                 morning peak
Results of the Brussels’
                     4   case study (4)                                             %

                                                                                    3
                                                                                    2
                                                                                    1

                                                                                        Increase in values compared to „before“-sceario
                                                                                    0
Sensitivity analysis of                                                                                                                   %
                                                                                                                                                                          morning peak              KPI
                                                                                                                                                                                                   KPI
                                                                                                                                           4   Traffic load reduction
the single pollutants                                                                                                                      3
                                                                                                                                                                                                   CO
                                                                                                                                                                                                   NO x
                                                                                                                                                                                                        2

                                                                                                                                           2                                                       PM 10

•   CO2 is the dominant10
                                                                                    %

                                                                                    8
                                                                                                                                           1
                                                                                                                                           0
                                                                                                                                               evening peak

                                                                                    6
    emission                                                                        4
                                                                                                                                                                        Traffic load reduction
                                                                                    2

•
                                                                                    0

    NOx is the most
                                                                                                                                          %      Traffic load reduction evening peak
    resistant                                                                                                                             10
                                                                                                                                           8
                                                                                                                                           6

•   Adjustment to local city
                                                                                                                                           4
                                                                                                                                           2
                                                                                                                                           0

    objectives through
                                                                                                                                                                          Traffic load reduction

    weights                                                                                                                                                                                                 11

      CONDUITS • 26/11/2014 • Madrid • P. Schmitz - A. Tsakarestos - I. Kaparias
Results of the Brussels’ case study (5)

Scalability improves detailed problem analysis
 • The KPI can be scaled down to
   smaller parts of the Network
    single routes
    junctions
 • Critical spots or times
   can be identified
                        Comparison morning peak
              250000

              200000
  KPI value

              150000

              100000

               50000

                   0
                           North corridor           South corridor
                                     Network part                                              12

                  CONDUITS • 26/11/2014 • Madrid • P. Schmitz - A. Tsakarestos - I. Kaparias
Weighting factors (1)

Vehicle types…
   • have different impacts on traffic
   • produce different quantities of pollution
… and therefore have to be weighed equally in the KPI
Weights can be determined…
   • on the basis of Passenger Car Units (PCU) equivalents
   • bearing in mind that some vehicle types have zero
     emissions (e.g. trams, bikes, …), so will have zero
     weights

                                                                                  13

     CONDUITS • 26/11/2014 • Madrid • P. Schmitz - A. Tsakarestos - I. Kaparias
Weighting factors (2)

Pollutants…
    • may be global (CO2) or local (NOx, PM);
    • have different impacts on human health;
    • become critical at different values;
… and therefore cannot be weighed equally in the KPI
Weights can be determined…
    • on the basis of the relative
      quantities of pollutants
    • on the basis of limit values
      determined by policy and
      legislation of countries/cities
                                                                                  14

     CONDUITS • 26/11/2014 • Madrid • P. Schmitz - A. Tsakarestos - I. Kaparias
Weighting factors (3)

Pollutant limit values:

Example weighting scenarios:

                                                                                  15

     CONDUITS • 26/11/2014 • Madrid • P. Schmitz - A. Tsakarestos - I. Kaparias
Weighting factors (4)

Application of pollutant weighting scenarios:
   • “Truly unweighted”, where pollutants are determined on
     the basis of their relative weights only
   • Weighted according to the USA and EU limit values
                                             Truly
                                       unweighted

                                                       USA

                                                     EU
                                                                                  16

     CONDUITS • 26/11/2014 • Madrid • P. Schmitz - A. Tsakarestos - I. Kaparias
Brussels’ evaluation of the KPI’s and DST

•   Same methodology for all the indicators

•   Calculation running with all kinds of data

•   Easy weighting of the parameters

•   Automatic calculation before, during and after the
    implementation of an ITS by using the VISSIM files as
    they are provided

•   Allow sharing results got in other cities for similar ITS
    and the possibility to create a common DB with real
    measurements                                                                   17

      CONDUITS • 26/11/2014 • Madrid • P. Schmitz - A. Tsakarestos - I. Kaparias
Actual limits of these Indicators

•   It will be necessary to wait a few years before having
    “before and after” data based on real measurements

•   Require a cost/benefit analysis to complete the set of
    KPIs needed to cover the overall sustainability
    assessment of an ITS

•   KPIs comparison between cities still needs an
    agreement on common weighting

                                                                                  18

     CONDUITS • 26/11/2014 • Madrid • P. Schmitz - A. Tsakarestos - I. Kaparias
Future developments planned in Brussels

•   Further steps : Road traffic prediction module and Road
    safety prediction module

•   Design of an integrated sustainability module using
    CONDUITS KPIs for VISSIM micro simulations

•   Implementation of this integrated sustainability module
    for VISUM macro simulations and OPTIMA simulations
    + KPI social inclusion
                                                                                   19

      CONDUITS • 26/11/2014 • Madrid • P. Schmitz - A. Tsakarestos - I. Kaparias
Thank you!

Pierre Schmitz – Antonios Tsakarestos – Ioannis Kaparias

Contact Details

Brussels Mobility, Rue du Progrès, 80/1, B-1030 Brussels
kdeterme@sprb.irisnet.be
pschmitz@outlook.be
antonios.tsakarestos@tum.de
kaparias@city.ac.uk

http://www.civitas.eu
You can also read