Applied Sciences Week 2020 - Applied Sciences Thematic Highlights - NASA Applied Science
←
→
Page content transcription
If your browser does not render page correctly, please read the page content below
Applied Sciences
Week 2020
Applied Sciences Thematic Highlights
Alaska Transportation & Infrastructure:
Identifying Permafrost Subsidence Using NASA Earth Observations
to Pinpoint Road & Infrastructure Vulnerability in Fairbanks, AK
Joshua Green*, Patrick Saylor, Marissa Dudek, Katie Lange
COMMUNITY CONCERNS

• Structural damage of critical public
  infrastructure including roads, bridges, highways,
  buildings, and utility lines
• Destabilization of infrastructure posing an
  environmental and health hazard (e.g. oil and gas
  pipelines, power facilities, etc.)
• Environmental harm from permafrost thaw including
  flooding and greenhouse gas emissions
                                                               Bicycle path buckling due to permafrost thaw in
                                                         Fairbanks, AK - Thomas A. Douglas, U.S. Army Cold Regions
                                                                    Research and Engineering Laboratory

PROJECT OBJECTIVES

• Detect permafrost deformation and thermokarst        P R O J E C T PA R T N E R S
  formation
                                                       • US Army Corps of Engineers, Cold Regions
• Identify road and infrastructure vulnerability         Research & Engineering Laboratory
• Create a Python module to automate Sentinel-1,       • Alaska Department of Transportation & Public
  UAVSAR, and LiDAR processing & analysis                Facilities
• Evaluate the feasibility & accuracy of Earth         • Alaska Department of Natural Resources
  observations to detect permafrost thaw
                                                       • Alaska Satellite Facility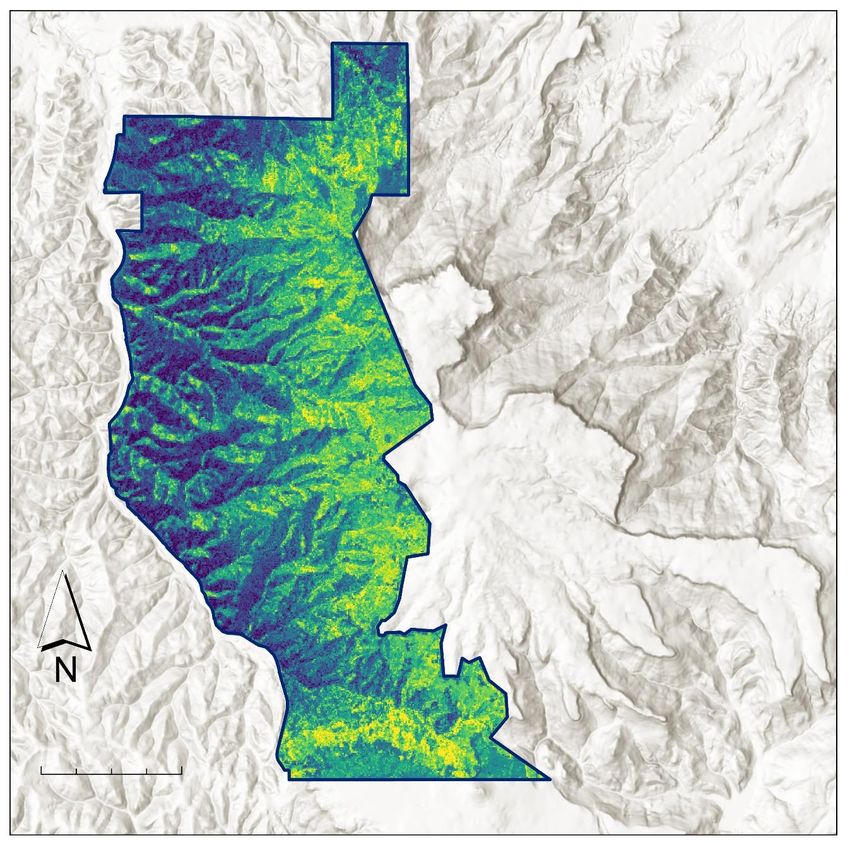
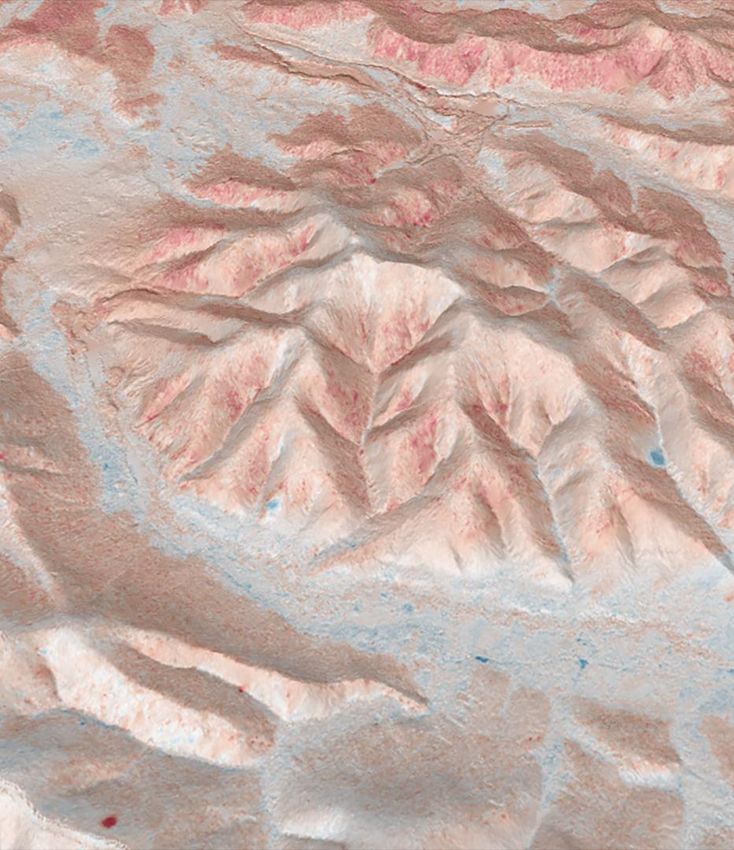
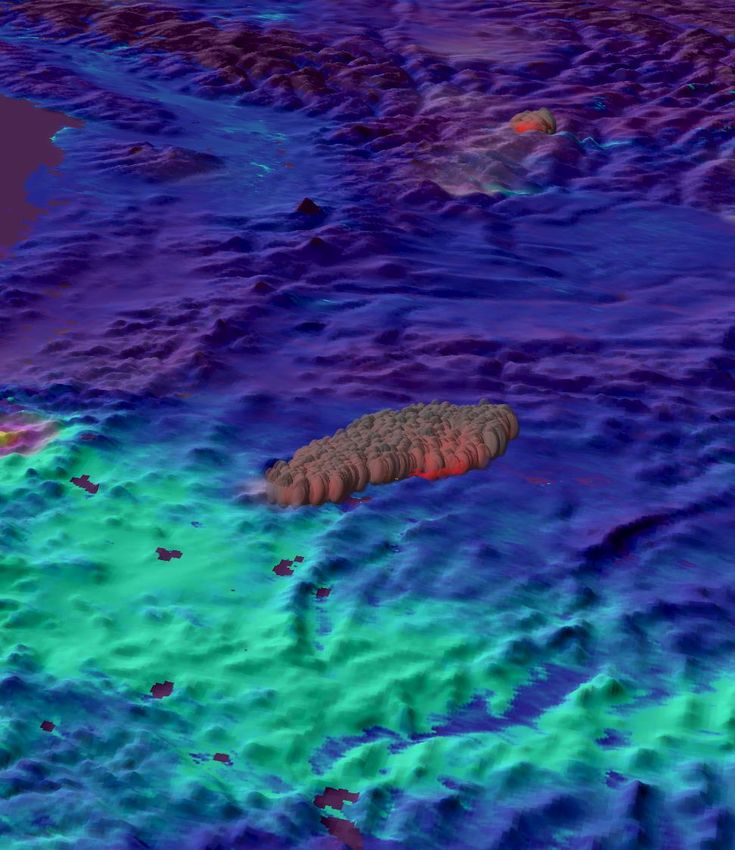
E A R T H O B S E R VAT I O N S & M E T H O D S

        Sentinel-1 C-SAR                                  UAVSAR                               LiDAR

                 HyP3                                           JPL                          Products
     Create Interferograms                           Data Acquisition                  Data Acquisition

           OpenSARLab                                       Python                               GIS
            Pre-Process                                 Pre-Process                        Pre-Process

                GIAnT                                          GIS                               GIS
      Deformation Analysis                        Deformation Analysis                        Analysis

           Credit: Rama, 2012                 Credit: NASA Jet Propulsion Laboratory   Credit: John Davies, 2004
R E S U LT S

•   Focusing on the Caribou-Poker Creek study area seen below, LiDAR demonstrates notable deformation along
    riverbanks and valleys while UAVSAR highlights deformation features along slope angle gradients and hillsides
•   Sentinel-1 detects deformation at low spatial but high temporal resolution
•   UAVSAR detects deformation at higher spatial resolution than Sentinel-1
•   LiDAR detects deformation at high spatial but low temporal resolution
LiDAR vs. Sentinel-1
                                                                                    Root Mean Square Error
CONCLUSIONS
                                                                            50                     RMSE = 21

                                                               LiDAR (mm)
                                                                                                   mm
Earth Observations
• Sentinel-1 C-SAR can be used to identify road &                            0
  infrastructure vulnerability on a large scale, offering
  greater spatial and temporal coverage.                                    -50

• UAVSAR demonstrates a greater accuracy and higher
  spatial resolution imagery than Sentinel-1 C-SAR, enabling                            -20                20
                                                                                                   0
  the improved identification of deformation features.
                                                                                         Sentinel-1 (mm)

Project Applications                                                                  LiDAR vs. UAVSAR
• Project partners can use Sentinel-1 C-SAR, UAVSAR, and                            Root Mean Square Error
                                                                              8
  LiDAR to identify and prioritize areas experiencing the                                          RMSE = 13
  highest intensity of permafrost deformation.                               6
                                                                                                   mm

                                                               LiDAR (mm)
• The PerMA (Permaforst Measurement and Analysis)                            4
  module developed during this project enables automated                      2
  processing of Earth observation data for detection of                       0
  deformation features.                                                      -2
                                                                             -4
                                                                                  -10   -5     0       5    10   15
                                                                                              UAVSAR (mm)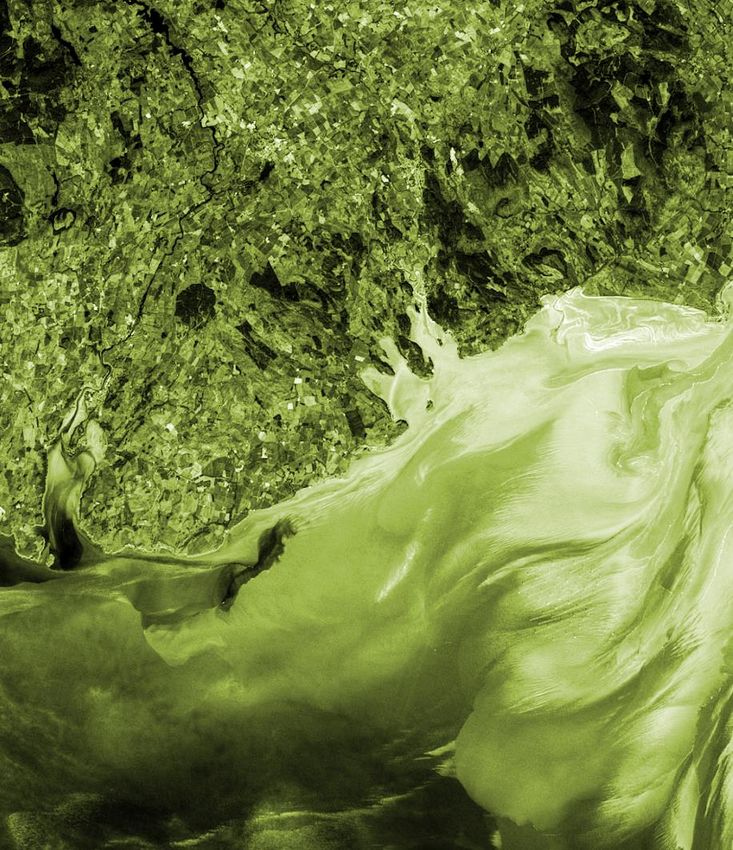
Thank You.
For further questions, please contact
us at NASA-DL-DEVELOP@mail.nasa.gov

https://develop.larc.nasa.gov
(Photo: Christopher Scragg)

Rising Dust and Impacts on American Public
Daniel Tong
George Mason University, Email: qtong@gmu.edu
“DUST BOWL”
Yes!
Severe dust storms during the 1930s; • Severe droughts about once or twice a
Extended droughts & poor land management century
• Global warming Precipitation shift,
SD-1936
greater evaporation, less snow/ice, and
earlier spring amplify natural
oscillation intensified droughts and
“dust-bowlification” (Romm, 2011).
Probably Not?
• Partially man-made
• Under economic stress in 1930s
• Soil conservation measures in places
Will we see another “Dust Bowl”?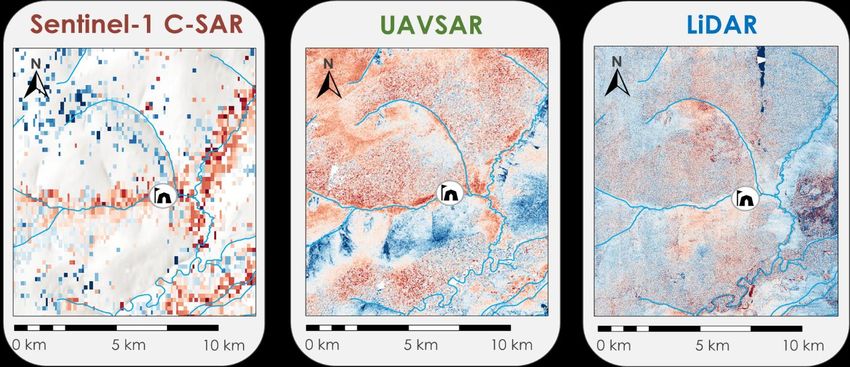
SATELLITE-AIDED DUST DETECTION

           Apr. 15, 2003                        Nov. 27, 2005               • DEVA

                                                                        •
                                 • GUMO                                 SAGO1
                                                         •
                                                         GUMO
                                                                            Apr. 12,
                                                             •BIB           2007
                                                             E
       Crustal (mg/m3)

                         7
                                      Si
                         6            Ca
                         5            K
                         4            Fe
                         3
                         2
                         1
                         0
                         11 1
                         11 4
                         11 7
                           /30

                                                   11 1
                                                   11 4
                                                   11 7
                                                     /30
                                            4/9

                                                                  4/6
                                                                  4/9

                                                                               4/6
                                                                               4/9
                                               2
                                               5
                                               8
                                               1

                                                                     2
                                                                     5
                                                                     8

                                                                                  2
                                                                                  5
                                                                                  8
                            /3

                                                      /3
                           /2
                           /2
                           /2

                                                     /2
                                                     /2
                                                     /2
                                           4/1
                                           4/1
                                           4/1
                                           4/2

                                                                 4/1
                                                                 4/1
                                                                 4/1

                                                                              4/1
                                                                              4/1
                                                                              4/1
                          12

                                                    12
                         11

                                                   11

                             Si – Silicon; Ca – Calcium; K – Potassium; Fe – Iron
LONG-TERM DUST TREND
• Dust storms increased
240% from 1990s to
2000s.
• 10 times faster and in
opposite direction to
global dust trends
(Source: Tong et al., 2017)VALLEY FEVER (Coccidioidomycosis)
Infection caused by inhaling the soil-dwelling fungus Coccidioides
(Source: thinklink.com) (Source: Tong et al., 2017)
• Tens of thousands infected each year; • High Valley fever cases in states
• 3000 deaths caused by Valley Fever; frequented by dust storms.HIGHWAY SAFETY, SOLAR POWER, AGRICULTURE… • Highway traffic accidents caused by visibility loss and high wind • Dust deposition reduces power generation efficiency of solar farms
FATALITIES FROM DUST & OTHER EXTREMES

In Most Years, Dust Storms Kill More People than Hurricanes.
SATELLITE-AIDED DUST EARLY WARNING SYSTEM

                                              NASA Health & Air
                                              Quality Project:
                                            • Use satellite observations to
                                              improve dust forecasting;

                                            • Support three dust services:
                                               a) Valley fever surveillance;
                                               b) Highway safety alert;
                                               c) Air quality management;
CITIZEN SCIENCE PLATFORM FOR DUST: NASA GLOBE OBSERVER Working with NASA GLOBE Observer to launch a new citizen science campaign to collect dust observations (reports and photos). NASA GLOBE Observer Contacts: Stakeholders: Marile Colon Robles: marile.colonrobles@nasa.gov WMO Sand and Dust Regional Centers; Helen Amos: helen.m.amos@nasa.gov Transportation/Health/Air Quality16Agencies
DustWatch: APP FOR HIGHWAY SAFETY

Highway dust forecasts:                               DustWatch App:
 •   Visibility                                        • Citizen Scientist Project
 •   High Wind                                         • Use dust forecasts
 •   Dust Concentration                                • Real-time dust alerts
 •   Inhalable Particle Concentration

                                                             (Contact Dust App. Team:
                            (Courtesy: Barry Baker)
                                                             dustapp2018@gmail.com)
Thank You. For further questions, please contact Daniel Tong at qtong@gmu.edu
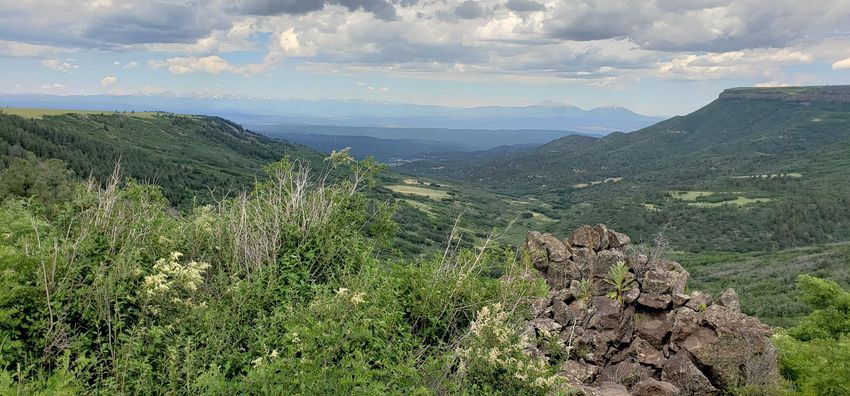
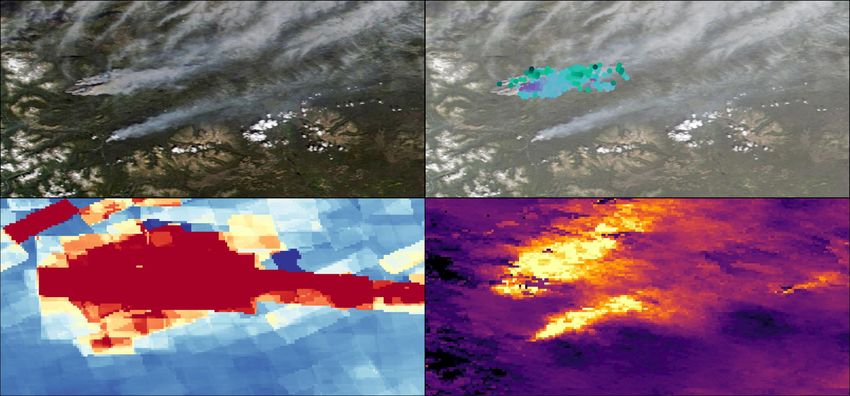
Pacific Northwest Health & Air Quality:
Utilizing NASA Earth Observations to Analyze Air Quality
Impacts from Wildfires in the Pacific Northwest
Liana Solis*, Ani Matevosian, Taylor Orcutt, Danielle Ruffe
C O M M U N I T Y C O N C E R N S & P R O J E C T PA R T N E R S

                                                                     Impacts of wildfire smoke:
                                                                        • Reduced air quality
                                                                        • Adverse effects on health

                                                                     End users:
                                                                        • The Nature Conservancy, Washington
                                                                          Chapter
                                                                        • Puget Sound Clean Air Agency

Sensor Density
     High

     Low

     Air Quality
     Monitoring Station
E A R T H O B S E R V AT I O N S & M E T H O D O L O G Y
How can we
visualize & analyze
smoke?
Aqua Sentinel-5P
MODIS TROPOMI
Vertical Extent Geographic Extent
MINX Methodology GEE Tool PHOENIX
Plume Height Pollutants and Aerosols
Terra LANDSAT 8
2
MODIS & MISR OLIR E S U LT S : C A S E S T U D Y F I R E I N B R I T I S H C O L U M B I A A U G U S T 6 , 2 0 1 8
MODIS True MINX:
Color Image Plume Height
3,674 m
1,287 m
PHOENIX: PHOENIX:
Change in CO Change in
AOD (unitless)
0.28 mol/m2 High
-0.02 mol/m2 Low
N 0 25 50 MiCONCLUSIONS & END USER BENEFIT
• Satellite data fills in gaps over remote regions that lack ground monitoring stations.
• PHOENIX complements NASA JPL’s MINX for a comprehensive, multi-dimensional understanding of wildfire
smoke.
• PHOENIX and the MINX methodology build the partner organizations’ capacity to analyze future fire events and
their impacts on air quality.Thank You. For further questions, please contact us at NASA-DL-DEVELOP@mail.nasa.gov https://develop.larc.nasa.gov
Operational Remote Sensing of Agricultural Water Use in Cooperation
with Western State Water Resource Agencies for Improved Water
Management
Justin Huntington, Research Professor, DRI
Lee Johnson, Charles Morton, Alberto Guzman, Matthew Bromley, Britta Daudert,
Jody Hansen, & Forrest Melton
E V A P O T R A N S P I R AT I O N A N D C O N S U M P T I V E U S E

      Water applied to a field ultimately:
        1.   Evaporates
        2.   Transpires (after being used by plants to grow)
        3.   Recharges underlying groundwater
        4.   Runs off and returns to a local canal or river
Measuring ET enables:
Development of realistic water budgets
Proof of beneficial use
Credit: John Locher,
AP
Proper credit for reduced use
Data-driven water trading programs
Increased on-farm efficienciesTHEN AND NOW…
1985 2020P A R T N E R S H I P I N D E V E L O P I N G O P E R AT I O N A L S AT E L L I T E E T P R O D U C T S
Agency Co-Investigators include:
–California State Water Resource Control Board
–Nevada Division of Water Resources
–Utah Division of Water Resources
–Idaho Department of Water Resources
–Oregon Water Resources Department
–Wyoming State Engineer’s Office
–Texas Water Development Board
–Montana Department of Natural Resources and Conservation
–California Department of Water Resources
Other partners include federal (USGS & Reclamation),
state, local, and private / NGOsP A R T N E R S H I P I N D E V E L O P I N G O P E R AT I O N A L S AT E L L I T E E T P R O D U C T S
Goal
• Create the ability for water management to make
field scale satellite-based ET maps and summaries
using best available science
Approach
• Develop semi-automated open-source open-platform
ET software (based in Python) to produce field scale
ET estimates on local computers at state agencies
• pySIMS and pyMETRIC
• Technology transfer via numerous hands on trainings
with state agency staff
• Migrate the software to the cloud for operational
compute, storage, data access, and visualization via
UIs and APIs
Some Comments from Agencies
• Open lines of communication with technical staff using GitHub and Slack
• Version Control, documentation, and issue reporting using GitHub very useful
for transparency and reproducability
• Without the support from ASP to develop software and trainings, most agencies
unable to apply this technology for water management
• Landsat data must stay free for agencies to use new technologyThe Team
S U M M ARY AN D N E X T S T E P S

•   Developed software and visualization tools so that State
    agencies can create and summarize satellite based ET
    products in-house
•   Support agencies to use stand alone and cloud based
    software
•   Provide 10 years of automated OpenET data for priority
    areas for agencies to evaluate
•   Conduct agency trainings to beta test API and custom
    reporting tools
•   Continue to support agencies to integrate into decision
    making
•   Sustainability…
•   Lessons learned
     • Research -> software engineering and support
     • Balance between end user driven wants, needs, and
         platform designs with feasibility and project scope
     • Engagement, outreach, trainings > 1 FTE
     • Community efforts build trust with partners
Thank You. For further questions, please contact: Justin.Huntington@dri.edu
Leveraging Google Earth Engine for
Rangelands Monitoring
Bo Zhou & Greg Okin
UCLA Geography
F R O M S PA C E T O S O I L

• Bureau of Land Management
  (BLM) Lands are both
  working lands and native
  habitat
• We are developing tools to
  help make management
  decisions
F R O M S PA C E T O S O I L

Tools are made to answer real questions asked by Field, District,
State, and National Offices
• What is the wind erosion risk in Colorado Plateau?
• How is vegetation recovery on abandoned oil pads in North Dakota?
• Is grazing allotment also suitable habitat for sage grouse in Wyoming?
• How has release from grazing affected vegetation on grazing allotments in
  Nevada?
F R O M S PA C E T O S O I L

Model Parameters
• Different Types of Users:
      • Field Office
      • Power User
• Choose Your Own Adventure Approach
  using Multiple Apps, like:
      • Map making and getting statistics
      • Comparing the same area at different times,
        with statistics testing
      • Time series analysis, with statistics testing
• On-the-fly map making
• Scientifically sound in using spatially
  and temporally dispersed field data
F R O M S PA C E T O S O I L Spatial Biases
F R O M S PA C E T O S O I L

Temporal Biases
F R O M S PA C E T O S O I L

Previous solutions
• Time series approaches were used to help address the
  temporal inconsistencies in remote sensing data.
• Regional and various spatial ensemble modeling
  approaches were used to address the spatial biases.
Our approach
• We experimented a new approach using one model trained
  with spatially and temporally dispersed data and applied
  spatial and temporal correction to address the respective
  biases.
• The result is promising and will enable our model to
  reliably predict in any location at any time within the
  spatial and temporal envelope of field data collection.
• Extrapolating beyond the spatial and temporal envelope
  can be done but may subject to lower confidence and
  accuracy.
Thank You.
For further questions, please contact:
Bodacious@UCLA.edu
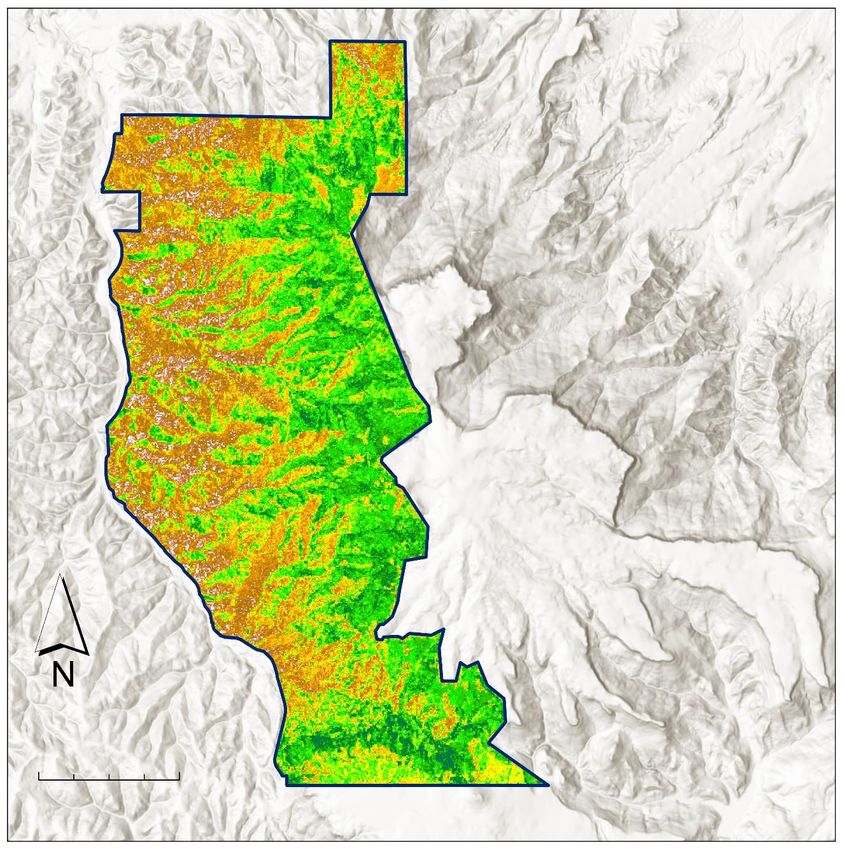
Fisher's Peak Ecological Forecasting:
Mapping Biomass to Inform Conservation Planning
of a Future State Park in Southern Colorado
Lauren Lad*, Scott Cunningham, Laura Krauser, Darby Levin
E S T I M AT I N G B I O M A S S F R O M S P A C E

Fisher's Peak State Park is a venture undertaken by                    Biomass = total mass of
The Nature Conservancy and Colorado State Forest                       living matter, which
Service.                                                               functions as an estimation
                                                                       for carbon storage
• Their joint effort for park development will strike the
  difficult balance of:
      • Growth of the recreation economy for the City of                    Trinidad
        Trinidad
      • Ecological diversity of the existing area                                      WY              NE
      • Preservation of major carbon sinks
      • Effort to estimate the potential for carbon market
        entry                                                                               CO
• The objectives of this project were to:                                                           Fisher's
      • Develop a model for mapping biomass                                                         Peak
      • Create a biomass map of the property                                           NM
      • Estimate the property's carbon storage
                                                             0 1.5   3 Km
      • Forecast high priority preservation areas                                           Study Area
                                                               Colorado
                                                              New Mexico
E A R T H O B S E R V AT I O N S & M E T H O D S
Allometric Resample
Field Equations to 10m
Optical
Stack input
Resample rasters
Active to 10m
Topographic
Extract values
at training
points
Predictor
VariablesR E S U LT S
250 Training Data Distribution
(Mg/ha)
Actual Biomass (Mg/ha)
200 Average: 79.17
Max: 265.31
150 Min: 9.86
y=0.699x + 22.956 Standard Deviation: 57.67
100
Out-of-bag Accuracy Metrics
50 RMSE: 54.98 Mg/ha
R2: 11.66
0
0 50 100 150 200 250
Predicted Biomass (Mg/ha)CONCLUSIONS
AGB Biomass Stored Carbon
Mg/ha tC/ha
169 85
22 11
Fisher's Peak Fisher's Peak
Boundary Boundary
0 1.5 3 Km 0 1.5 3 KmThank You. For further questions, please contact us at NASA-DL-DEVELOP@mail.nasa.gov https://develop.larc.nasa.gov
CEOS Working Group on Disasters Flood Pilot:
Mapping the Red River of the North
Andrew Molthan
MAPPING THE RED RIVER OF THE NORTH

The Red River of the North           Red River of the North flows northward from North Dakota
                                     and Minnesota into Manitoba, Canada, and includes a flat,
experiences frequent flooding        wide, and expansive flood plain.
spanning Manitoba and the            •   Significant floods occur here on a frequent basis,
Dakotas, highlighting a                  especially in years with extensive, deep snowpack, rapid
                                         seasonal warming, and in combination with heavy
transboundary water mapping              rainfall events.
challenge.                           •   Major events have occurred in 2009 and 2011, with other
                                         events in recent years to include 2013, 2014, 2019, and
                                         2020.
                                     •   The CEOS Working Group on Disasters Flood Pilot
                                         brings together scientists and mapping capabilities from
                                         a broad range of platforms to help improve mapping of
                                         these and similar events.
                                             •   Combining GEO (geostationary), LEO (low-
                                                 Earth orbit) and SAR (synthetic aperture radar)
                                                 capabilities to provide comprehensive mapping.
                                             •   From this, a GEO-LEO-SAR focused Flood Pilot
                                                 was developed.
MAPPING THE RED RIVER OF THE NORTH
Combining information from multiple
platforms combines the strengths of each
capability to result in overall improved
mapping capabilities.
• Geostationary data from NOAA’s operational GOES-R
Series (-16, -17) provide high temporal repeat over the
same area, helpful for detecting water between clouds and Water extent via NDWI, Landsat 8, April 17, 2020 and courtesy of Earth Observatory
shadows, albeit at a relatively lower spatial resolution.
• Low-Earth orbit imagery are often at a higher spatial
resolution (< 30 m) but may be available once or twice per
week from a given platform, and may have a view blocked
by clouds or shadows.
• Synthetic aperture radars have similar spatial
resolutions (< 30 m) and limited repeat viewing
opportunities for a given event but see through most
clouds and precipitation that may linger through a given
flood event.
NOAA/NWS detections of flood water (left) and advisory update from the forecast
office in Grand Forks, ND issued on April 11, 2020. (link)MAPPING THE RED RIVER OF THE NORTH
• A goal of the CEOS Working Group on Disasters is to bring
together our international colleagues for shared access to
Earth observations – satellite remote sensing, modeling, in
situ – and work collaboratively to encourage sharing of
both data and capabilities.
• For the Red River, collaborations include access to and use
of data from:
• NASA’s Landsat 7 and 8 missions
• NASA/NOAA S-NPP and NOAA JPSS (VIIRS) data
• NOAA/NASA GOES-R Series (-16, -17 with ABI)
• ESA Sentinel-1 (SAR) and Sentinel-1 (optical)
• RADARSAT-2 and Radarsat Constellation Mission
(RCM)
• Contributions from other international partners, their
platforms, and sensors:
• ALOS, TerraSAR-X, Cosmo-Skymed
Research and Collaboration Question: How do
we best combine data from multiple missions and
platforms to create the highest quality analyses?
Results courtesy of Ian Olthof, Emergency Geomatics Services,
Canada Centre for Remote Sensing / Natural Resource CanadaRadarSat-2
MAPPING THE RED RIVER OF THE NORTH
• Earth observations can also inform our understanding of flood Inundation
risk through recurrence and return period. 100%
• Long-term series of observations capture the frequency of
water present in a pixel, from optical, SAR, and their
combination.
• In combination with flood plain knowledge, digital elevation 0%
maps, and locations of infrastructure, partners can use Earth
observations and mapping techniques to assess the spatial
extent and recurrence interval of flood impacts.
• Here, examples from colleagues in the Canada Centre for
Remote Sensing / Natural Resource Canada highlight the
repeated flooding that occurs in the Red River valley.
• Data provided by RadarSat-2, exploring how to improve Count:
results and add data in combination with international Maximum 72
partners and additional observations.
observations
• In this case:
per-pixel
• 533 images from RADARSAT-2
• Landsat 5, 7, and 8 from USGS for 1985+
• RadarSat Constellation Mission (24 scenes, 2020+)
• More from Sentinel-1, Sentinel-2, and RapidEye
Results courtesy of Ian Olthof, Emergency Geomatics Services,
Canada Centre for Remote Sensing / Natural Resource CanadaMAPPING THE RED RIVER OF THE NORTH
• CEOS Flood Pilot efforts will continue to bring partners Winnipeg
together around regional areas of interest, led by
international partners and with collaborations around data
sharing and algorithm exchange:
• Red River of the North
• Transboundary waters in Bolivia/Paraguay/Argentina Fargo
Rio de la Plata Basin
• Flood impacts in coastal and inland India Leads: CONAE, Partners
• Typhoon rainfall and flooding in eastern China NASA MODIS via Worldview
• Emphasis of collaborations spurs increased sharing of Red River of the North
data, thoughts about improving access and ease of use for Leads: NOAA, NASA, Natural Resources Canada
data and explore preliminary methods for analysis.
In development:
Pearl River Basin, China
Mahanadi River Delta
Leads: ISRO, PartnersThank You. For further questions, please contact: andrew.molthan@nasa.gov
Rocky Mountain Disasters:
Using NASA Earth Observations to Monitor Post-Fire
Vegetation Recovery in the Colorado Front Range
Eric Jensen*, Audrey Colley, Lauren Kremer, Zackary Werner
C O M M U N I T Y C O N C E R N S & P R O J E C T PA R T N E R S

The US Forest Service’s Rocky Mountain
Research Station provides research to
managers and decision makers related to post-
fire forest recovery in Colorado Front Range
Forests. However, field-based studies are
cumbersome at the scale of many fires.

In particular, the project partners were interested in
remote sensing analysis to address a suite of related issues:
•   Extensive high severity fire patches in recent fires
                                                                         2002 Hayman Fire   NBR    NDVI     TCG
•   Loss of tree canopy in moderate and high severity               1
    burns
                                                                   .5
•   Reduction in post-fire conifer regeneration
•   Resulting impacts to watershed health                           0

                                                                   -.5
                                                                           1990             2000     2010
PROJECT OBJECTIVES
Fire Severity
A
With estimates that more than 190 Bobcat
Unburned
million acres of federal public A
forests are unnaturally dense, the Low
risk of future high severity fires in 1.5 3
miles
Front Range communities is high. Moderate
Buffalo
B Creek
High
To aid in post-fire management decision 100
making we analyzed four fires that Tree
Canopy
occurred between 1996–2002. Our 2 4 Cover
miles
objectives were to: 0
1. Apply remote sensing data to C B C D Hayman
detect current tree cover percentage
on the landscape
2. Apply environmental variables
D
to predict probabilities of post-fire
tree regeneration
15 30
miles
¯ High
Meadows
1.5 3
miles
5 10
milesE A R T H O B S E R V AT I O N S & M E T H O D S
Google Earth (6 in)
Google Earth imagery enabled us to estimate tree
cover and to detect small trees.
To detect post-fire tree canopy we applied remote
sensing variables:
• Landsat time-series calculations of common vegetation
indices
• Synthetic aperture radar vegetation structure variables
• Topographic variables
Landsat 8 (30 m)
To predict post-fire tree seedling regeneration we applied
environmental variables:
• Climate variables
• Soils properties
• Fire severity and recovery metrics
• Topographic and hydrographic variablesR E S U LT S & C O N C L U S I O N S
Conifer regeneration suitability Conifer percent cover
Hayman fire Hayman fire
Variance
explained :
68.19%
Tree
Probability Cover
100% 70%
AUC: .72
Out of Bag Error: 27.63%
0% 0%Thank You. For further questions, please contact us at NASA-DL-DEVELOP@mail.nasa.gov https://develop.larc.nasa.gov
Photo: Rainforest Rescue

SERVIR Amazonia
Overview and Highlights
Andrea Nicolau
NASA SERVIR Regional Science Associate, Mekong
SERVIR SERVICES MEET NEEDS IN ASIA, AFRICA, AND THE AMERICAS

 SERVIR Science
Coordination Office
                                                                             SERVIR Hindu Kush Himalaya
  NASA MSFC
                                                                                      ICIMOD
                      USAID Washington
                      NASA Headquarters

 SERVIR Amazonia
      CIAT
                                                                SERVIR Eastern &
                                                                                                SERVIR Mekong
                                           SERVIR West           Southern Africa
                                                                                                    ADPC
                                              Africa                RCMRD
                                           AGRHYMET

Focus Countries
Additional Reach
SERVIR AMAZONI A - FOCUS COUNTRIES
SERVICE AREAS
SERVICE CO-DEVELOPMENT
SERVICES

•   Radar for detecting forest change                   •   Ecosystem services modeling in the Amazon’s forest-
                                                            agriculture interface
•   Monitoring & evaluation of mangroves in Guyana
                                                        •   Quantifying the effects of forest change on
•   Deforestation monitoring and reporting in Ecuador
                                                            provisioning and regulating ecosystem services
•   Monitoring of gold mining in the Peruvian Amazon
                                                        •   Monitoring forest dynamics from space to enable
•   Monitoring of gold mining in the Colombian Amazon       sustainable livelihoods and biodiversity
•   Forecasting seasonal to sub seasonal fire and           conservation in the Amazon (TerraBio)
    agricultural risk from drought                      •   Increase the protection of forests with traditional
•   Improving resilience and reducing risk of extreme       communities and indigenous peoples (Origins)
    hydrological events                                 •   Amazon landscape and biodiversity Atlas
SOCIAL INCLUSION Indigenous People • Most of the Amazon Basin is traditional territory of indigenous peoples now subject to enclosure for legal and illegal purposes. • To ensure IPs know about, can access and benefit from SERVIR-Amazonia services, the Program engages representative IPOs, includes their needs, priorities in planning, training events. • The leading IPOs in the region already use GIS services that we help strengthen.
SOCIAL INCLUSION

            Gender
            • Improving women’s leadership and creating an environment that provides opportunities
              to all, regardless of gender: Community of Practice
            • Integrating a gender lens in services
            • Increasing the use of remote sensing and GIS to address gender equity

Photo credit: SERVIR-Amazonia
I N N O V AT I V E S C I E N C E : 4 A P P L I E D S C I E N C E S T E A M S
Naiara Pinto Jim Nelson
Jet Propulsion Laboratory Brigham Young University
Unlocking the Power of Improving Resiliency and Reducing
Active Remote Sensing for Risk of Extreme Hydrologic Events
Ecosystem Services Modeling through Application of Earth
in the Amazon’s Observations and In Situ Monitoring
Forest-Agriculture Interface Information
Douglas Morton Stephanie Spera
Goddard Space Flight Center University of Richmond
Forecasting Seasonal to Quantifying the Effects of Forest
Sub-Seasonal Fire and Agricultural Cover Changes on Provisioning
Risk from Drought in Amazonia and Regulating Ecosystem
Services in the Southwestern
AmazonMonitoring of Gold Mining in the
Peruvian AmazonOBJECTIVES
Produce near real time information
about gold mining-related
deforestation
• Rapid identification of possible illegal
mining fronts in priority areas
• Differentiate the occurrence type (illegal,
informal, formal) to better inform actions
to authorities
Photo credit: The NationWEB APP
ACCA works extensively with
the Government of Peru to
provide actionable data using
methods that combine
multiple remote sensing
products, computing platforms
such as Google Earth Engine,
SAR and high-resolution data.
Change
Detection
Alerts Validation APP
Base LayersDeforestation Monitoring and
Reporting in Ecuador
74BACKGROUND • Ecuador has been engaging in national efforts to reduce carbon emissions from the forest sector, as an integral part of the National Action Plan for REDD+ • SERVIR-Amazonia, in collaboration with FAO, is now contributing to Ecuador’s efforts to effectively reduce carbon emissions by implementing methodologies to reduce uncertainties in area estimation
Thank You.
For further questions, please contact:
andrea.puzzinicolau@nasa.gov
africa.flores@nasa.gov – SERVIR Amazonia
Regional Science Coordination Lead
                                           www.servir.ciat.cgiar.org
                                             #SERVIRamazonia
Overview & Highlights of NASA’s Engagement With The Central American Integration System (SICA) Betzy Hernandez & Ricardo Quiroga
BACKGROUND

NASA / SICA Joint Statement
   • Building off earlier NASA-CCAD agreement
     (1998-2013)
   • Support Earth observation research +
     applications in Central America & DR
                                                                                     Credit: SICA
   • Priorities span ASP program areas
                                                March 2019: NASA-SICA Joint Statement (ESD level)
   • Specific geographic priority zones also
     identified (Dry Corridor, MBC, etc.)
   • Explore concrete joint activities

SICA / World Bank Agreement
   • Provide additional support to the NASA-
     SICA joint statement

                                                                                         Credit: SICA

                                                     Feb. 2020: SICA-World Bank agreement
SICA sub-
NASA Equivalent Programs GEO SBAs
secretariats
ASP Disasters
CEPREDENAC Public Health Surveillance
R&A Earth Surface & Interior
ASP Ecological Forecasting Biodiversity and Ecosystem
R&A Carbon Cycle & Ecosystems Sustainability
CCAD
R&A Climate Variability & Change
ASP Air Quality Public Health Surveillance*
ASP Water
CRRH R&A Water & Energy Cycle Water Resource Management
R&A Weather
CAC ASP Agriculture & Food Security Agriculture and Food Security
Earth System
Science – R&A
ASP Health
COMISCA Public Health Surveillance
ASP Air Quality
Capacity Building (foundational
CSUCA ASP Capacity Building
activity)
Agriculture and Food Security
OSPESCA ASP Agriculture & Food Security
Biodiversity and Ecosystem
ASP Ecological Forecasting
Sustainability
79EXAMPLES OF R&A PROGRAM AND ASP
UAVSAR flights A.8 Belize SDG project
Credit: JPL
80CAPACITY BUILDING PROGRAM SUPPORT
• DEVELOP
• SERVIR
• ARSET Credit: DEVELOP
Summer 2019: DEVELOP and members of Guatemala’s
• Indigenous Peoples National Coordinator for Disaster Reduction (CONRED)
• AmeriGEO projects
Summer 2019: DEVELOP project on mapping flooding
events in El Salvador and GuatemalaCountries that were
SUMMARY OF COLLABORATION
GEO members
before 2019
To date:
• 70 webinars: awareness raising, skill-building
• 1,500 participants
• 20 universities from the region involved
Countries that
• 8 DEVELOP projects joined GEO after
the signing of the
• 6 ongoing NASA ASP projects in the region joint statement
• 4 countries joined GEO
• Taking advantage of resources from NASA, other
partners, e.g. Copernicus, JAXA
• Leveraging private sector resources, e.g. Google
(GEE), PlanetWHAT’S NEXT…
• Deep Dive discussions among NASA, SICA, &
World Bank
• Identification of areas of collaboration and work
• Capacity building activities
Credit: SERVIR
• SERVIR Central America? SERVIR - Dan Irwin and Emil Cherrington
providing a webinar to SICA
Webinar on the Belize SDG projectCENTRAL AMERICA INTEGRATION ( SICA) HIGH RISK REGION
NASA DISASTER PROGRAM SUPPORTING NASA/SICA   JOIN DECLARATION

• Partnership with SICA, World Bank
  planning Understanding Risk
  conference in Costa Rica 2020. More
  than 500 participants.

• CEPREDENAC in Partnership NASA
  Disaster Program is using NASA Real-
  Time Data to create Complex Risk
  Scenarios for decision-making
  including COVID19 Situational
  Awareness.
MAPPING URBAN RISK IN GUATEMALA CITY

• Supporting multi-risk assessment pilot in
  Guatemalan City to land planning as a
  baseline to build resilience
• Data will be integrated to CEPREDENAC
  platform, also connected with
  AmeriGEOSS Platform
• Guatemala City has a population of
  1,870,000
• Landsat, GPM, LHASA
FROM DATA TO DECISION MAKING IN GUATEMALA WILDFIRES APRIL 2020

                                                                 “We are very grateful to the
                                                                 NASA Disasters Program for
                                                                 this cooperation”
                                                                                  - CONRED
MAPPING URBAN RISK IN GUATEMALA CITY • Supporting multi-risk assessment pilot in Guatemalan City to land planning as a baseline to build resilience • Data will be integrated to CEPREDENAC platform, also connected with AmeriGEOSS Platform • Guatemala City has a population of 1,870,000 • Landsat, GPM, LHASA
DEVELOPING VOLCANO OBSERVATORY IN PARTNERSHIP
WITH CEPREDENAC – GEOLOGICAL SERVICES FROM
SICA

• Supporting Geo Hazards Supersites and
  Natural Laboratories (GSNL)
   • Proposals for: El Salvador, Guatemala,
      Honduras, Costa Rica, Nicaragua.
   • Link with NASA A37 ROSES Projects on
      Volcanoes

• Central American Hydro Resources Committee
  (CRRH) 8 National Meteorological Services
    • Oklahoma University providing expertise
    • NASA data: DEM-IMERG-GPM-FEWS-NET-
      MODIS-SRTM

                                                Guevara H, 2020, Sample of various satellite-based geospatial datasets used
                                                in EF5 for flash flood forecasting over Central America: DEM from SRTM-
                                                based HYDROSHEDS, GPM's IMERG precipitation, Flow accumulation from
                                                DEM, and Impervious Surfaces based on MODIS and SRTM.
Thank You.
For further questions, please contact:
betzy.hernandez@nasa.gov
ricardo.quirogavanegas@nasa.gov
90Measuring How Earth Observations Benefit Society When We Use Them to Make Decisions Bethany Mabee
VA L U A B L E S C O N S O R T I U M

VALUABLES is a collaboration           What makes VALUABLES unique?

between Resources for the              •   Large, sustained effort to measure societal benefits of
Future (RFF) and NASA to                   Earth observations

measure how satellite                  •   Goes beyond anecdotes to quantify these benefits, often
                                           in dollar terms
information benefits people
and the environment when we            •   Focuses on things that are beneficial to society, including
                                           lives saved, increase in profits, and increase in
use it to make decisions.
                                           crop yields

                                       •   Rather than things that are not directly beneficial to
                                           society in and of themselves, like peer-reviewed
                                           publications, data downloads, and “improved
                                           understanding”
W H AT W E D O
We focus on two types of activities:
• Conducting impact assessments
• Apply existing methods and develop new methods
• Build impact assessment literature on Earth
observations for decisionmaking
• Developing educational materials and activities to
build capacity within the Earth science community to
quantify the value of its work. This includes:
• Improving understanding of impact assessment
terms, concepts and methods
• Developing a value of information (VOI) framework
the scientific community can use to design rigorous
impact assessments
• Using this VOI framework as the basis for
VALUABLES’ tutorials, webinars and workshopsCONSORTIUM STRUCTURE • VALUABLES team at RFF and NASA • Scientific council: Diverse, interdisciplinary group of Earth and social scientists engaging in IA activities and advising and serving as advocates for consortium within relevant communities • Consortium members: Organizations with expressed interests/activities in valuing societal benefits of Earth observations and Earth science information • Community of practice: A growing interdisciplinary community that shares a common language and is prepared to do VOI impact assessments
VA L U A B L E S ' I M PA C T A S S E S S M E N T P O R T F O L I O

Case studies that                                             •   Ecosystems: What is the value of incorporating satellite data into a
                                                                  tool that helps commercial ships avoid whale strikes off the Pacific
measure the value of                                              Coast? For blue whale conservation objectives of 15 and 7.5 fatal ship
using satellite data to                                           strikes per year at a probability of 90%, cost savings to commercial
                                                                  shipping of $0.3 billion and $1.1 billion.
protect endangered                                            •   Water quality: What was the value of using satellite data to detect
species, detect harmful                                           a harmful algal bloom and manage recreational advisories in Utah Lake,
algal blooms and                                                  UT, in summer 2017? ~$370,000 in socioeconomic
                                                                  benefits associated with improved human health outcomes (sensitive to
protect human                                                     stated assumptions).
health, inform post-                                          •   Wildfire: What were the cost savings from using Landsat imagery to
                                                                  prioritize post-wildfire response activities for 2013 Elk Complex
wildfire response,                                                wildfire? Over $51,000 for Elk Complex fire and up to $7.7 per year
improve predictability of                                         for federal use of Landsat for BAER program nationally.
corn and soybean prices,                                      •   Agriculture: What is the value of a 30% reduction in weather-related
                                                                  uncertainty in corn and soybean futures markets? $0.9 billion for U.S.
and enforce air quality                                           corn and $0.5 billion for U.S. soybeans annually.
standards.                                                    •   Air quality: What would be the value of using satellite data to enforce
                                                                  the Clean Air Act's National Ambient Air Quality
                                                                  Standards? 5,452 premature deaths could have been avoided in
                                                                  2016 and 2017, a gain to society of $49 billion.
I M PA C T A S S E S S M E N T S I N 2 0 2 0 - 2 0 2 1 Three impact assessments funded through VALUABLES' recent grant competition: • Quantifying the benefits of using satellite derived early warning system to predict cholera in Bangladesh (PI: Sonia Aziz, Moravian College) • Estimating the societal benefits of satellite imagery used to enforce the Brazilian Forest Code and reduce deforestation (PI: Jill Caviglia-Harris, Salisbury University) • Valuing satellite data for harmful algal bloom early warning systems (PI: Stephen Newbold, U. of Wyoming) Four additional impact assessments in 2020-2021 on topics including • Value of Earth observations in a humanitarian decision context • Value of remotely sensed evapotranspiration data for managing water transfers in New Mexico
G E T I N V O LV E D

• Connect with a member of the VALUABLES team
• Talk to a VALUABLES scientific council member
• Join the consortium as a member (organizational level)
      • Complete this form to get started:
        https://airtable.com/shrzPJiLHfz2HLte9
• Join VALUABLES’ community of practice (individual level)
      • Sign up for email alerts about upcoming activities at
        www.rff.org/valuables
      • Submit relevant items to our community newsletter
• Help us identify future study ideas!
      • Submit ideas at
        https://airtable.com/shrBD062UEgmwQV4g
Thank You. For further questions, please contact: mabee@rff.org
You can also read