Storm Tilo over Europe in November 2007: storm surge and impacts on societal and energy infrastructure - ADGEO
←
→
Page content transcription
If your browser does not render page correctly, please read the page content below
Adv. Geosci., 49, 187–196, 2019
https://doi.org/10.5194/adgeo-49-187-2019
© Author(s) 2019. This work is distributed under
the Creative Commons Attribution 4.0 License.

Storm Tilo over Europe in November 2007: storm surge and impacts
on societal and energy infrastructure
Anthony James Kettle
Department of Geography, Maynooth University, Maynooth, Co. Kildare, Ireland

Correspondence: Anthony James Kettle (ake3358@gmail.com)

Received: 27 May 2019 – Revised: 27 August 2019 – Accepted: 12 September 2019 – Published: 4 November 2019

Abstract. Storm Tilo on 8–9 November 2007 ranks among              there is evidence that the storms have also become larger
the serious winter storms in northern Europe over the past         and more intense. One special type of winter storm, typi-
30 years. Its low pressure centre passed across the northern       cally passing on an eastward trajectory across the northern
North Sea, and this led to a cold air outbreak in northwest Eu-    North Sea is serious for coastal and offshore infrastructure
rope. Strong north winds across the North Sea contributed to       in Europe from its associated storm surge and wave field. Al-
a high storm surge that was serious for coastal regions in east-   though not typically ranked with the highest insurance losses,
ern England, the Netherlands and Germany. Storm winds and          this type of maritime storm is serious for energy infrastruc-
unusually high waves caused shipping accidents and damage          ture around the North Sea, including offshore petroleum plat-
to some offshore energy infrastructure. This report presents       forms, wind energy infrastructure, and coastal power plants.
an outline of the met-ocean conditions and a short overview           Coastal flooding during storms represents a potentially
of storm impacts on societal and energy infrastructure. The        serious hazard for energy infrastructure, and this issue has
progress of the storm surge around the North Sea is analysed       been highlighted by Paskal (2009) and Cruz and Kraus-
using data from the national tide gauge networks. A spectral       mann (2013) especially with scenarios of future sea level
analysis of the water level data is used to isolate the long pe-   rise. Paskal (2009) presents an overview of the threat of
riod storm surge and short period oscillations (i.e., < 4.8 h)     storm surge flooding of coastal nuclear power stations, and
from the tidal signal. The calculated skew surge is compared       there have been two notable cases in Europe. On 13 De-
with literature reports for this storm and also with another       cember 1981 the nuclear power plant at Hinkley Point in the
serious North Sea storm from 31 October–1 November 2006            Bristol Channel of the southwest England was shut down as
(Storm Britta). The short period oscillations are compared         the result of coastal flooding during an intense storm whose
with the platform and shipping incident reports for the 2 d        low pressure centre passed across southern Wales on an east-
storm period. The results support previous reports of unusual      ward track (Flather et al., 1982; Kirby, 2010). On 27 Decem-
wave and water level dynamics during some severe regional          ber 1999 the Le Blayais nuclear power station in the Gironde
winter storms.                                                     estuary of western France was forced to shut down as the
                                                                   result of seawater flooding caused by a breach of dyke de-
                                                                   fences by the combined action of a sea surge and high waves
                                                                   during an intense storm (Salomon, 2002; de Fraguier, 2010).
1   Introduction                                                   For both events but particularly at Le Blayais, the action of
                                                                   the wave field on the sea walls may have been important
Winter storms in northern Europe are a potentially serious         for the ultimate flooding event. However, a complete geo-
hazard that can interrupt and damage societal and energy           physical analysis of the events has been limited by the lack
infrastructure. Northwest Europe has been impacted by a            of water level and wave data, in part due to failures of the
higher frequency of damaging winter wind storms starting           tide gauge recorders. These accidents highlight that extreme
about the late 1980s that have resulted in high insurance          coastal flood levels were not fully appreciated in the initial
losses (Berz, 2005). While some of this may be due to the          design criteria of the power stations in the 1960s and 1970s.
increased construction of infrastructure in exposed locations,

Published by Copernicus Publications on behalf of the European Geosciences Union.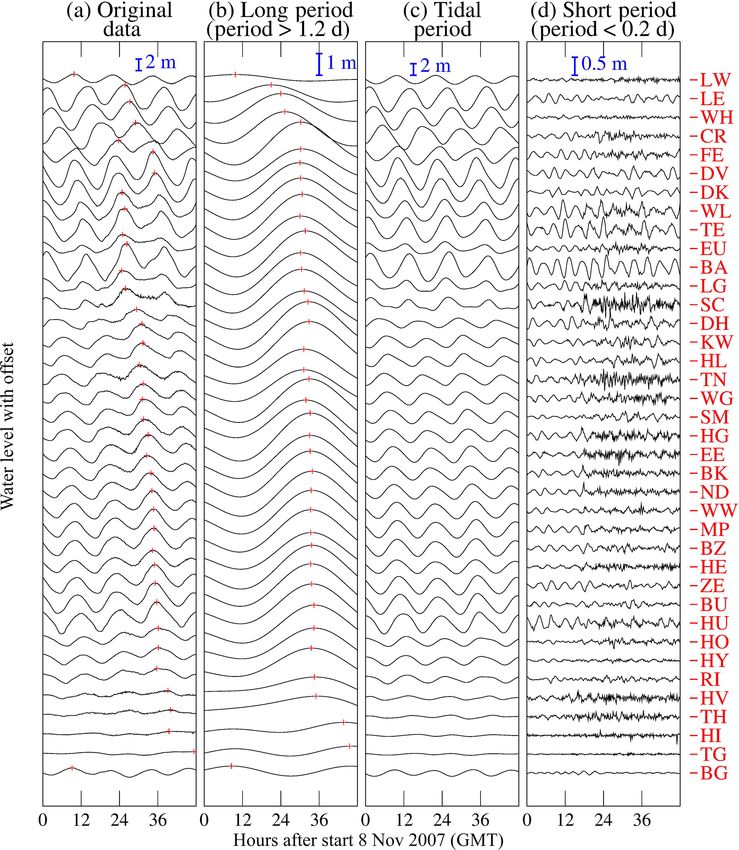
188                                                                A. J. Kettle: Storm Tilo over Europe in November 2007

   Cases of wintertime coastal flooding like this are caused      ods approaching this range have been linked with damage
by storm surges acting on top of high tides, but there is         to the FINO1 offshore wind energy research platform in the
also an important impact of the wind-wave field and possibly      German Bight (Hessner and Reichert, 2007; Neumann and
other dynamic features that are poorly understood. During         Nolopp, 2007; Rosenthal et al., 2011; Pleskachevsky et al.,
a storm surge, water is pushed shoreward under the surface        2012) and with certain ship accidents (e.g., KNRM, 2007).
stress of strong winds, with an additional increase of wa-        Terlouw (2013) has invoked infragravity waves to explain
ter level in response to the lower atmospheric pressure that      deeply-penetrating erosion damage in narrow coastal sec-
typically characterizes winter storm events (i.e., the inverted   tions of Ameland, one of the West Frisian Islands, during
barometer effect). During hurricanes and cyclones at low lat-     Storm Britta in 2006. Spencer et al. (2015) surveyed similar
itudes, maximum surge levels can reach 9 m (Pugh, 1987),          patterns of coastal damage on the North Norfolk coast af-
and for Hurricane Katrina in the northern Gulf of Mexico          ter Storm Xaver in December 2013 and indicated travelling
water levels of 7.5 m were recorded (Muir-Wood and Grossi,        oceanographic features in coastal tide gauges and offshore
2008). For North Sea storm surges, the local effect of storm      wave recorders. The underlying physical mechanisms that
winds and atmospheric pressure is augmented by a travelling       give rise to these types of wave events are unclear. The pre-
storm surge wave that enters the North Sea north of Scotland      sentation of Rosenthal et al. (2008) shows the model results
and moves counter-clockwise around the basin as a coastally-      of a ship-type wake pattern in the context of Storm Britta but
trapped wave with a similar speed as the semi-diurnal tide.       with much larger dimensions that might result from a trav-
This can result in water levels reaching > 4 m above the av-      elling low pressure centre. In an investigation of the New
erage high tide level in the southern North Sea for the worst     Year’s Day storm of 1995, Rosenthal et al. (2011) highlights
winter storm surge events (Ishiguro, 1981). Waves on differ-      that two notable ship accidents in the northern and southern
ent time and spatial scales have an important role in aug-        parts of the North Sea occurred under the same convective
menting coastal erosion and infrastructure damage during          cloud band, and there is a possibility of a concentration of
the storm flooding events. Harbour seiches – oscillations in      wave energy along atmospheric convergence lines in the flow
semi-enclosed basins with time scales of minutes to hours –       direction of certain offshore storms. Another hypothesis re-
are a widely known phenomenon around the world including          lates to a resonant amplification of travelling wave groups
the North Sea (Pugh, 1987). Mostly, the amplitudes of har-        from atmospheric gust structures moving at nearly the same
bour seiches tend to be small relative to the tide and storm      speed during certain winter storms with open cloud cell con-
surge water levels. However, under certain resonance condi-       vective structures (Rosenthal et al., 2011; Pleskachevsky et
tions, associated with basin geometry and the speed of trav-      al., 2012).
elling weather disturbances, these can be greatly increased in       Storm Tilo struck northwest Europe on 8–9 Novem-
amplitude, up to 5–6 m for the highest known cases in the         ber 2007 and belongs in the same category of severity as
Mediterranean Sea. These special cases have the height and        the New Year’s Day storm of 1995, Storm Britta (2006) and
frequency characteristics of tsunamis and have been identi-       Storm Xaver (2013) as an important maritime storm with an
fied as “meteotsunamis” (Monserrat et al., 2006; Pattiaratchi     unusual sea state that caused damage in unexpected offshore
and Wijeratne, 2015). The phenomenon is also known in the         accidents (Rosenthal et al., 2011). Similar to other serious
North Sea but has mostly been a second order effect that          North Sea storms, Tilo passed on a northern track eastward
is smaller than the tidal amplitude (but see also Pugh and        across the northern North Sea, and it had a cold air out-
Woodworth, 2014). De Jong and Battjes (2004) highlighted          break behind the travelling low pressure centre (Lefebvre,
the case of seiches in Rotterdam Harbour during storms, an        2008). In the unstable atmospheric conditions over the North
important issue because of the potential threat to ship nav-      Sea, a southward moving array of open-centre atmospheric
igation and the storm surge barrier. Kettle (2018) showed         convection cells formed, a condition that has been linked
that similar harbour seiches excited during Storm Britta in       with large wave events during previous storms (Rosenthal
2006 were a widespread phenomenon in North Sea coastal            et al., 2011; Pleskachevsky et al., 2012). Storm Tilo af-
areas with some coherence among regional stations. The            fected offshore energy infrastructure in several ways. Pro-
anomalous surge measured at Delfzijl during Storm Britta          duction at several Norwegian North Sea petroleum platforms
on 1 November 2006 may belong to this type of phenomena,          was shut down as workers were evacuated in advance of
but little is known about it other than the fact that it could    the event (Upstream, 2007a, b) as part of that country’s
not be explained by existing surge models (RWS, 2006a, b,         safety procedures for extreme maritime storms (Magnusson,
2007a), and it may be due to physical processes with tem-         2008). Winds at the Norwegian platform of Ekofisk reached
poral and spatial characteristics that are smaller than present   over 20 m s−1 , and a rogue wave was documented early on
storm surge model resolutions (Stoffelen, 2014).                  9 November 2007 before the maximum winds (Magnusson
   Infragravity waves with periods of 25–130 s remain a           and Donelan, 2013; Donelan and Magnusson, 2017). Within
poorly understood phenomenon but may potentially be an            the UK economic zone of the North Sea, the newly con-
important factor for coastal erosion and offshore infrastruc-     structed Buzzard Platform was damaged at a high level of
ture damage. High amplitude wave groups with long peri-           construction on 9 November 2007, resulting in production

Adv. Geosci., 49, 187–196, 2019                                                             www.adv-geosci.net/49/187/2019/
A. J. Kettle: Storm Tilo over Europe in November 2007                                                                           189

Figure 1. Map of tide gauge stations and shipping/platform incidents during Storm Tilo on 8–9 November 2007.

operations to be shut down (Upstream, 2007c, d; Lloyd’s Ca-          (Metoffice, 2011). In the Netherlands, it led to the first-ever
sualty Week, 2007). For the wind energy industry, the storm          closure of the storm surge barrier protecting the port of Rot-
caused several significant events. The offshore wind energy          terdam, and heightened dyke monitoring along the entire
research platform FINO1 was damaged by waves at 15 m                 coast (RWS, 2007b). Along certain sections of the German
above sea level in an incident similar to Storm Britta on            coast, there were dune collapses (Heyken, 2007). There were
1 November 2006 (Outzen et al., 2008). There were several            also a number of ship and platform incidents across the North
onshore wind farm incidents in Scotland (Caithness Wind-             Sea where the winds or sea state were reported to have had
farms, 2018). The storm was associated with a serious coastal        an important role. The Supplement gives a list of the sources
storm surge that caused minor flooding in eastern England            reviewed for this report, together with a set of thematic ta-

www.adv-geosci.net/49/187/2019/                                                                   Adv. Geosci., 49, 187–196, 2019
190 A. J. Kettle: Storm Tilo over Europe in November 2007
bles with more information on the different met-ocean as-
pects and societal impacts of the storm.
2 Methods
The water level data from 76 tide gauges around the North
Sea (Fig. 1) were analysed to characterize their storm surge
component and short period oscillations. The tide gauge data
originate from the national tide gauge networks of the UK,
France, the Netherlands, Germany, Denmark, and Norway.
Data quality was assessed visually, and for the UK stations,
quality assessment was facilitated by the annual tide gauge
report from the government authority (Natural Environment
Research Council, 2007). The water level data sets had a time
resolution of 10 min, except for the UK (15 min), Germany
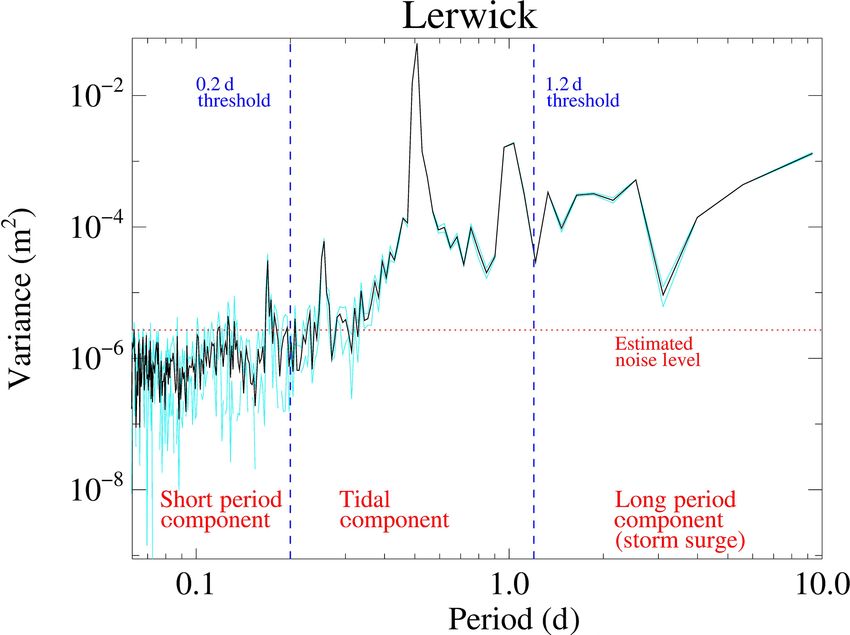
(1 min), and the two GESLA stations for France (60 min). Figure 2. Spectrum of the water level time series from Lerwick,
UK for 1–14 November 2007. The original 15 min time series was
The 1 min data for the German tide gauge stations were aver-
subsampled to give three data sets of 45 min resolution from which
aged onto a 10 min grid to facilitate subsequent processing. the spectral mean and standard deviation uncertainty could be calcu-
Further information about the tide gauges is given in Table S1 lated, as shown. The noise level was estimated based on the standard
in the Supplement. The spectral components of the 14 d time deviation of the first difference of the original time series.
series intervals across the storm period (1–14 November, in-
clusive) were calculated using a discrete Fourier transform
(Stull, 1988). Spectral graphs were produced to identify the oscillation for each tide gauge station during Storm Tilo de-
dominant tidal and storm surge periods (see Fig. 2). The cayed during successive oscillations.
spectral information was used to reconstruct three compo- A data base of 16 shipping and offshore platform inci-
nent time series with different frequency bands correspond- dents was compiled from media, trade, and scientific re-
ing the storm surge (with periods greater than 1.2 d), tides ports. Lloyd’s Casualty Week (2007) was the most impor-
(with periods between 0.2 and 1.2 d), and short period oscil- tant source of this information, and most of the accident re-
lations (with periods less than 0.2 d). The tides in the North ports could be corroborated in different sources. The inci-
Sea have a dominant semi-diurnal component and a smaller dents were grouped into different categories according to the
diurnal component. The division of 1.2 d between the tidal reported nature of the accident: ship collisions or groundings,
band and the storm surge band was chosen on the basis of containers or deck cargo washed overboard, engine problems
a minimum inflection at this period shown in many spectral or power blackout, and injuries or man overboard. Most of
graphs (see Fig. 2). The division of 0.2 d (or 4.8 h) between these offshore incident reports mention bad weather condi-
tidal and short period oscillations was chosen empirically tions as a contributing factor, and one case (“NYK Antares”)
so that for most water level stations the reconstructed time specifically attributes containers lost overboard to a single
series would have a smooth profile with two semi-diurnal wave event. Information on the incidents is summarized in
peaks per day (see also Kettle, 2018). Other investigations Table S2 with a list of sources. Most of the reports give fairly
of meteotsunamis have used similar filtering techniques to precise information on the location and time of the accidents,
isolate the meteotsunami signal from the tide, and different and it is possible to compare them with the short period os-
frequency cutoff thresholds have been used corresponding to cillation features observed in the water level data. Although
periods that vary between 2 and 6 h (Monserrat et al., 2006; some of the infrastructure events may have been caused by
Pattiaratchi and Wijeratne, 2015). large infragravity waves whose time duration would be too
The statistics of the short period time series component short to register on tide gauges (e.g., KNRM, 2007), the im-
were calculated to characterize periods and amplitudes of the pact of these waves on nearby coasts and harbours may have
oscillation structures for the 2 d storm period (8–9 Novem- excited transient harbour seiches with periods on the order of
ber). This included a count of the number of complete zero 10s of minutes, which is within the measurement capability
crossing oscillations present, the maximum (crest height) and of water level recorders.
minimum (trough depth) of each oscillation, and the trough-
to-crest oscillation height. This was conducted separately for
the down-crossing and up-crossing oscillations. Following 3 Results
observations of a ringing dissipation effect in certain tide
gauge stations during Storm Britta (Kettle, 2018), an anal- The main results of the spectral analysis and time series re-
ysis was conducted to assess how the highest trough-to-peak constructions are shown in the four panels of Fig. 3. The first
Adv. Geosci., 49, 187–196, 2019 www.adv-geosci.net/49/187/2019/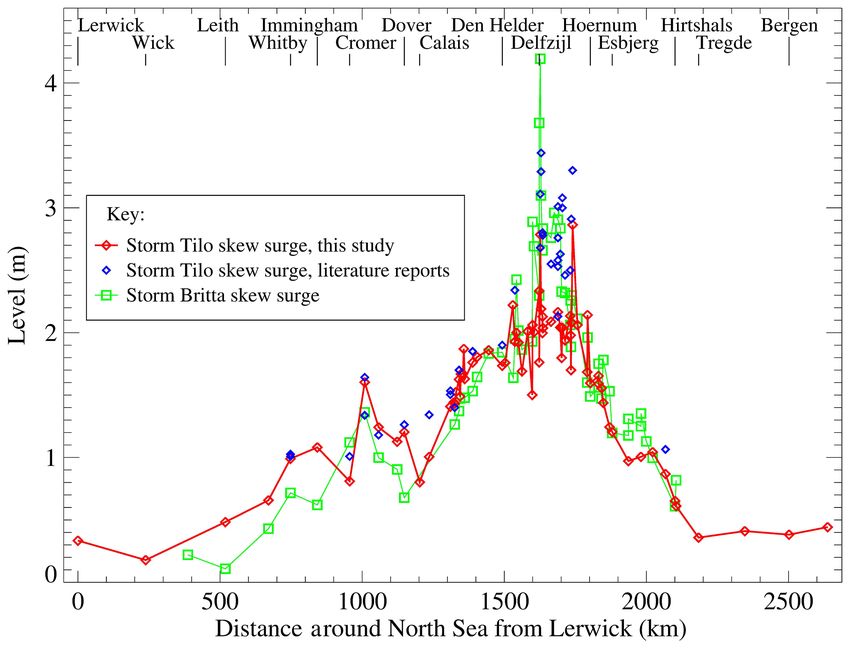
A. J. Kettle: Storm Tilo over Europe in November 2007                                                                                   191

Figure 3. (a) Original tide gauge time series for the 2 d interval of Storm Tilo 8–9 November 2007 and reconstructions for the (b) long
period component (periods > 1.2 d; storm surge), (c) intermediate period component (periods in the range 0.2–1.2 d; tide), and (d) short
period component (periods < 0.2 d; harbour seiche). The plot shows a subset of time series data from 38 stations, and the full data set of 76
stations used in this project is shown in the Supplement.

panel (Fig. 3a) shows the original water level time series data          ter levels for these series are shown by red crosses, and these
for the storm period 8–9 November 2007. The time series are              highlight the progression of the tide and storm surge peaks
plotted with a vertical offset and arranged counter-clockwise            around the North Sea.
around the North Sea starting with Lerwick north of Scotland                The time series reconstructions from the spectral analy-
and ending with Maløy in western Norway. The main feature                sis clarify the different time scale components of the original
of this series is the semi-diurnal tide, and locations in the            time series, and these are shown in the panels of Fig. 3b–d.
southern North Sea show higher tidal ranges than other lo-               Figure 3b shows the storm surge peak as it travels around
cations in northern Denmark and western Norway. Some of                  the North Sea from Scotland, and its amplitude was high-
the stations show short period features that appears as a noisy          est in the southern North Sea. Figure 3c shows the travel-
fluctuation on the dominant tidal features. The maximum wa-              ling peaks in the tidal frequency band, highlighting the semi-

www.adv-geosci.net/49/187/2019/                                                                        Adv. Geosci., 49, 187–196, 2019
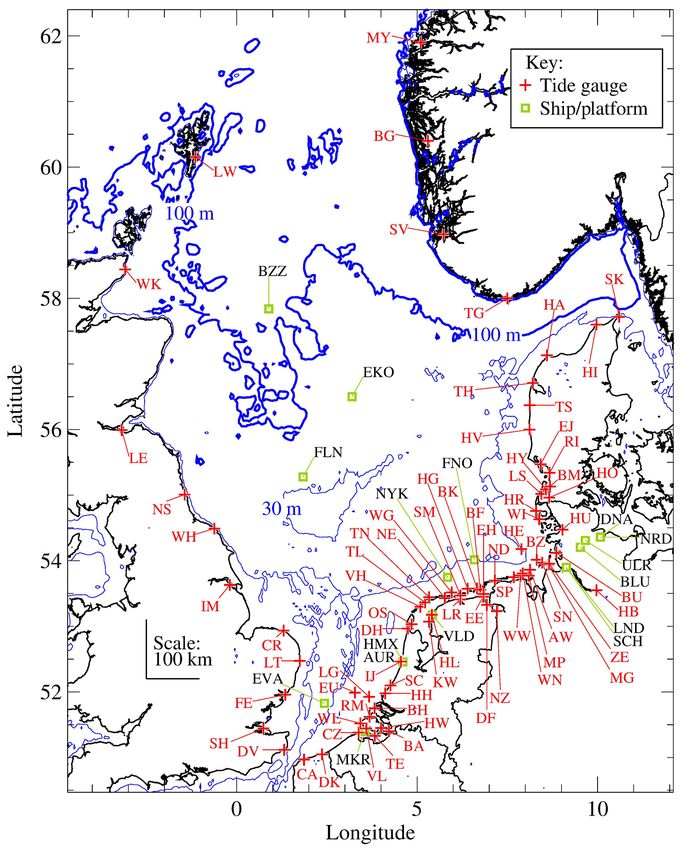
192                                                                  A. J. Kettle: Storm Tilo over Europe in November 2007

Figure 4. Calculated skew surge for Storm Tilo on 8–9 November 2007 with literature reports. The skew surge for Storm Britta on
31 October–1 November 2006 from Kettle (2018) has been shown for comparison.

diurnal component. Figure 3d shows the short period com-            high tide peaks for period of the analysis of 1–14 Novem-
ponents from the tide gauges. For the short period compo-           ber 2007 is shown for different locations around the North
nent, there are six cases with the trough-to-peak oscillation       Sea in Fig. 4. For comparison, literature reports (Table S3)
heights exceeding 60 cm, and the highest oscillation height         of the skew surge are also plotted, along with the skew surge
at Nieuwe Statenzijl exceeded 90 cm. Even though all the            analysis for the Storm Britta in 2006 from Kettle (2018; see
tide gauges have been processed with the same spectral anal-        Table S4). Figure 4 highlights how the skew surge reached
ysis routines, there is a qualitative difference in the short pe-   above 2 m above the average high tide level for many stations
riod reconstructions with some clusters of stations exhibiting      in the northern Netherlands and the German Bight. For most
features of high frequency noise and others showing longer          stations along the coast of the UK and the southern Nether-
period wave-like features. Among some of the stations show-         lands, Storm Tilo had a slightly higher skew surge than Storm
ing longer period oscillations, there are instances of temporal     Britta. For stations in the northern Netherlands and the Ger-
offsets that may be due to shallow water wave propagation or        man North Sea coast, the skew surge of Storm Britta was
be linked with the field of atmospheric convection cells mov-       generally higher. The anomalous water level event recorded
ing over the North Sea.                                             at Delfzijl during Storm Britta was noted in several national
   The height of the measured water level above the ex-             authority investigations (RWS, 2006a, b, 2007a), and Fig. 4
pected high tide prediction (i.e., skew surge; Williams et al.,     shows that it was higher than what was measured during
2016) is an important parameter to assess the impact of storm       Storm Tilo.
surge coastal flooding. For this study, the height of the maxi-        The relationship among the water level features at different
mum measured water level (Fig. 3a) minus the median of the          time scales during Storm Tilo is shown in Fig. 5 along with

Adv. Geosci., 49, 187–196, 2019                                                               www.adv-geosci.net/49/187/2019/
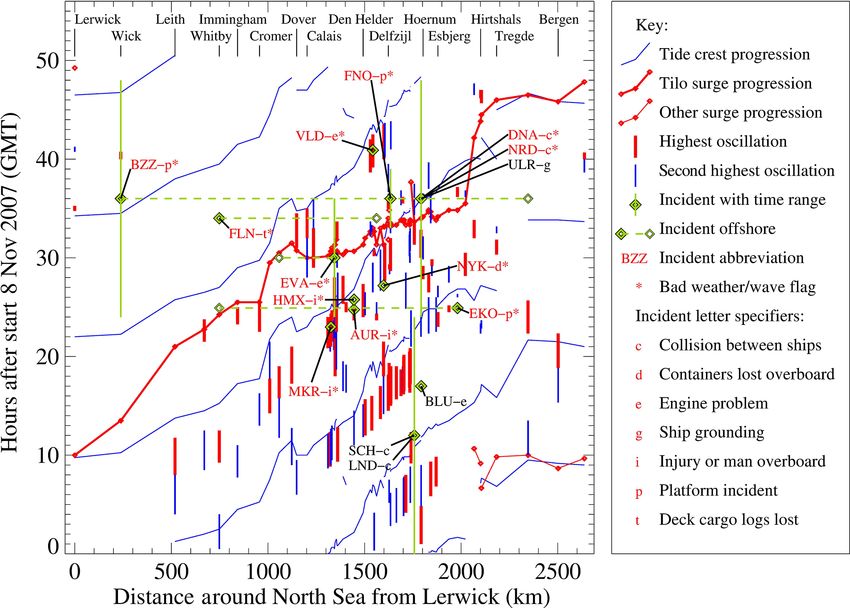
A. J. Kettle: Storm Tilo over Europe in November 2007                                                                                  193

Figure 5. Relation between time and coastline distance around the North Sea during Storm Tilo on 8–9 November 2007 for the semi-diurnal
tides, storm surge peak, highest two trough-to-peak heights of the down-crossing short period oscillations, and shipping/platform incidents.

the ship and offshore platform events. The diagram shows the            of the full 14 d time series yielded several other propagating
data plotted on axes of time (hours after the start of 8 Novem-         storm surge crests of lower amplitude, and two of these ap-
ber 2007) versus counter-clockwise coastal distance around              pear as thin red lines and diamonds at the corners of Fig. 5.
the North Sea starting from Lerwick in the UK. Because the              The data set of offshore ship and platform events is plotted
tides and storm surge travel along the coast, Fig. 5 is a simpli-       as green diamonds with vertical bars and horizontal tie-lines
fying diagnostic that permits the representation of the multi-          for reports with temporal or spatial ambiguity.
dimensional dynamics of the system (i.e., latitude, longitude,             There is a fairly close association of the propagating storm
and time) on a two-dimensional graph. Four data sets are                surge crest and the semidiurnal tidal in Fig. 5. The semidiur-
plotted for the 48 h period: the progression of the tidal max-          nal tide propagates with an average speed of ∼ 14–17 m s−1 ,
ima, the main storm surge maximum associated with Storm                 corresponding to a water depth of ∼ 20–30 m for a shal-
Tilo, the first and second highest trough-to-crest ranges of the        low water wave. The moving storm surge crest is associated
short period oscillations, and the 16 shipping/platform inci-           mainly with one semi-diurnal tidal crest, but the surge max-
dents. (Figs. S1 and S2 in the Supplement show the four data            imum occurs after the tide along the coasts of the UK and
sets separated into two graphs to facilitate inspection). The           the southern Netherlands, while for the German Bight the
progression of the semi-diurnal tide peaks are shown as di-             high tide and storm surge crest occur at nearly the same time.
agonal blue lines on the plot, which have been constructed              The first and second highest trough-to-peak oscillations oc-
by linking together semi-diurnal tidal crests between succes-           cur mainly before the tidal high water times during the storm
sive stations within a certain time window. The progression             surge period. In many cases, the offshore incidents were as-
of the surge peak for Storm Tilo is shown by the heavy red              sociated with the first or second highest short period oscilla-
line in the plot, and these have been constructed in the same           tions. Because the short period oscillations have amplitudes
manner as the semidiurnal tidal lines. The spectral analysis            of tens of centimetres and periods on the order of tens of

www.adv-geosci.net/49/187/2019/                                                                        Adv. Geosci., 49, 187–196, 2019
194                                                                     A. J. Kettle: Storm Tilo over Europe in November 2007

minutes to hours, they do not directly record the wave field        4    Conclusions
that was identified as a contributing factor in several offshore
incidents. On the other hand, they indicate where an analy-         Storm Tilo ranks among the more serious storms of the
sis of wave data recordings might be targeted for insight into      past 30 years (Larsén et al., 2017) for its threat to energy
the offshore incidents. Different related oscillation height di-    infrastructure, especially offshore. Offshore platforms for
agnostics can be used to characterize the extreme short pe-         petroleum production and wind energy research were dam-
riod oscillations in this type of diagram. These are shown          aged during this storm by the wind and wave field. The anal-
in Figs. S3 and S4. Figure S3 is similar to Fig. 5 but uses         ysis of dynamical features in the tide gauge records for a
up-crossing oscillation to show the highest crest-to-trough         series of stations around the North Sea reveals the progres-
height ranges, and there are some differences related to the        sion of the surge, tides, and short period oscillations. The
fact that the oscillations sometimes have a pronounced asym-        amplitude of the skew surge at different sections around the
metrical shape. Figure S4 selects the two extreme oscillations      coast is highlighted, and the highest skew surge was along the
based on the crest heights instead of the trough-to-crest full      coasts of the Netherlands and Germany. The reconstructed
height range. There are some differences in the pattern of the      short period (< 0.2 d) elements of the water level record re-
most extreme oscillations among these diagrams compared             vealed an oscillation or ringing phenomena that exceeded
with Fig. 5, but the overall trends are similar. Figure S5 fo-      60 cm in trough-to-crest height for several stations. These os-
cuses on the pairwise comparison of the offshore events and         cillations have previously been identified with the harbour
the highest trough-to-peak height ranges of the short period        seiche phenomenon (Pugh, 1987), but they also fall within
oscillations of the closest tide gauge station, and it suggests     the range of defining characteristics of meteotsunamis (Mon-
that there may be a close association between these data sets.      serrat et al., 2006; Pattiaratchi and Wijeratne, 2015; Max-
   The technical literature recognizes that the extreme wa-         ial et al., 2019). For Storm Tilo, the trough-to-peak height
ter level fluctuations associated with tsunamis and harbour         of these features was smaller than range of the tides and
seiches last for periods of hours to days, oscillating at partic-   storm surge at most North Sea stations, so that they were
ular frequencies before decaying out through frictional en-         of second order importance for coastal flooding risk. On the
ergy losses (Pugh, 1987; Murty, 1977; Pattiaratchi and Wi-          other hand, storm flood levels during Storm Britta exceeded
jeratne, 2015). Many published time series recordings of            the numerical model predictions that encapsulate the under-
the phenomena show approximately exponentially decreas-             standing of storm surge dynamics (RWS, 2006a, b, 2007a),
ing trends. Murty (1977, p. 243) quantifies the trend in terms      and certain reports indicate there may have been a high risk
of a “decay constant”, which would correspond to the inverse        of coastal dyke breaches and flooding (Ulm et al., 2018).
of the e-folding time in his mathematical treatment, and Dean       As well, the highest of the short period oscillations during
and Dalrymple (1991) give more information on the math-             Storm Tilo appeared to show correspondence in time and lo-
ematical description of exponentially decaying long waves.          cation with some of the reported infrastructure events. To-
For the North Sea tide gauge data for Storm Tilo, many cases        gether with instances of coastal dune collapse and accounts
were found where the highest oscillation was directly fol-          of wave-damage of offshore infrastructure, this may indicate
lowed by the second highest oscillation (Fig. 5). This indi-        an important role for wave-like features on intermediate time
cates that there may be a ringing effect initiated by an ex-        and space scales between wind waves and the semidiurnal
citation mechanism possibly associated with the travelling          tide.
atmospheric convection cells (De Jong and Battjes, 2004).
An analysis of this effect was conducted using the summary
statistics of the down-crossing oscillations for 8–9 Novem-         Data availability. The water level data for this study was measured
ber 2007. For the 2 d of data for each station, the oscillation     by the national tide gauge networks of the UK, France, the Nether-
                                                                    lands, Germany, Denmark, and Norway. The data were downloaded
with the highest trough-to-peak range was identified, and the
                                                                    from publicly accessible websites maintained by the national au-
information for all the successively decreasing oscillations
                                                                    thorities, except for France (dataset obtained through the GESLA
was extracted. The extracted data series had at least two and       online archive) and Germany (datasets sent by Wilfried Wiechmann
up to eight oscillations (for the case of Delfzijl). The data       of the Federal Institute of Hydrology in Germany). Further infor-
were fitted with an exponential decay model to yield a me-          mation on the URL internet addresses is given in Table S1 of the
dian value for the e-folding decay times of 3.3 h (range of         Supplement.
0.4–45.1 h), which agrees with results from Storm Britta in
Kettle (2018). Additional information on the time span and
e-folding decay times of the short period oscillations at indi-     Supplement. The supplement related to this article is available on-
vidual stations is shown in Figs. S6, S7 and Table S5.              line at: https://doi.org/10.5194/adgeo-49-187-2019-supplement.

Adv. Geosci., 49, 187–196, 2019                                                                 www.adv-geosci.net/49/187/2019/
A. J. Kettle: Storm Tilo over Europe in November 2007 195
Author contributions. AJK conducted the data analysis, wrote the clear Plant Safety Session, presentation to U.S. NRC, Regulatory
manuscript, and made a poster presentation at the EGU General As- Information Conference (RIC) at the Bethesda North Marriott
sembly 2019, Vienna, Austria. Hotel and Conference Center, 11 March 2010.
De Jong, M. P. C. and Battjes, J. A.: Low-frequency sea waves gen-
erated by atmospheric convection cells, J. Geophys. Res., 109,
Competing interests. The author declares that they have no conflict C01011, https://doi.org/10.1029/2003JC001931, 2004.
of interest. Donelan, M. A. and Magnusson, A.-K.: The making of the
Andrea Wave and other rogues, Sci. Rep.-UK, 7, 44124,
https://doi.org/10.1038/srep44124, 2017.
Special issue statement. This article is part of the special issue “Eu- Flather, R. A., Draper, L., and Proctor, R.: Coastal flooding in the
ropean Geosciences Union General Assembly 2019, EGU Division Bristol Channel and Severn Estuary on 13th December 1981, IOS
Energy, Resources & Environment (ERE)”. It is a result of the EGU Internal Document No. 162, May, 1982.
General Assembly 2019, Vienna, Austria, 7–12 April 2019. Hessner, K. and Reichert, K.: Sea surface elevation maps obtained
with a nautical X-band radar – Examples from WaMoS II sta-
tions, 10th International Workshop on Wave Hindcasting and
Forecasting and Coastal Hazard Symposium, North Shore, Oahu,
Acknowledgements. The author gratefully acknowledges data from
Hawaii, 11–16 November 2007.
national tide gauge networks of the UK, Netherlands, Germany,
Heyken, H.: Schwere Sturmflut an niedersächsischer Nordseeküste
Denmark, and Norway, and the GESLA archive for France. The
– Dünenabbrüche auf den Inseln, NLWKN press release, avail-
tide gauge data for the UK, France, the Netherlands, and Nor-
able at: https://www.nlwkn.niedersachsen.de/startseite/aktuelles/
way was downloaded from Internet servers. For Germany, Wil-
presse_und_offentlichkeitsarbeit/pressemitteilungen/-43218.
fried Wiechmann of the Federal Institute of Hydrology of Ger-
html (last access: 15 October 2019), 9 November 2007.
many kindly provided tide gauge data by email. For Denmark,
Ishiguro, S.: Storm surge predictions by the quasi uniform stead
part of the tide gauge data was downloaded from public websites,
wind/pressure field method, Institute of Ocean Sciences, Internal
and Bjørn Steen Frederiksen of Kystdirektoratet indicated a web-
Document 102, Wormley, Surrey, England, 1981.
site where other tide gauge data could be accessed. Antke Reemts
Kettle, A. J.: The North Sea surge of 31 October–1 Novem-
of the German Search and Rescue Service and Edwin Granneman
ber 2006 during Storm Britta, Adv. Geosci., 45, 273–279,
of the Netherlands Coastguard provided information on some of
https://doi.org/10.5194/adgeo-45-273-2018, 2018.
the offshore incidents during Storm Tilo. The author appreciated
Kirby, R.: Hinkley Point sediment transport – potential impacts of
conversations on offshore storm issues with other EGU2019 at-
new structures, British Energy Estuarine & Marine Studies Tech-
tendees: Dirk Becker, Elizabeth Bradshaw, Lidia Gaslikova, Gre-
nical Report Series, BEEMS TR 149, September 2010.
gor Giebel (ERE Energy Meteorology convener), Daniela Maxial,
KNRM: Capsize and Survival, Report on lifeboat Anna Mar-
Vinca Rosmorduc, Pal Schmitt, Len Shaffrey, Ina Teusch, and Mar-
garetha’s capsizes November 1st 2006, Koninklijke Nederlandse
ius Ulm. The comments of two anonymous referees improved the
Redding, Maatschappij, 16 May 2007.
manuscript.
Larsén, X. G., Du, J., Bolaños, R., and Larsen, S.: On the impact of
wind on the development of the wave fields during storm Britta,
Ocean Dynam., 67, 1407–1427, https://doi.org/10.1007/s10236-
Review statement. This paper was edited by Gregor Giebel and re- 017-1100-1, 2017.
viewed by two anonymous referees. Lefebvre, C.: Orkan TILO am 8. und 9. November 2007,
DWD report, available at: https://www.dwd.de/DE/leistungen/
besondereereignisse/stuerme/20071108_orkan_tilo.pdf?__
blob=publicationFile&v=4 (last access: 15 October 2019),
References 1 January 2008.
Lloyd’s Casualty Week: Lloyd’s Casualty Week, Lloyd’s of London
Berz, G.: Windstorm and storm surges in Europe: loss trends Press, Colchester, Essex, UK, 23 November 2007.
and possible counter-actions from the viewpoint of an inter- Magnusson, A. K.: Forecasting extreme waves in practice, Proceed-
national reinsurer, Phil. Trans. R. Soc. A, 363, 1431–1440, ings of Rogue Waves 2008, Brest, France, 13–15 October 2008,
https://doi.org/10.1098/rsta.2005.1577, 2005. 23 pp., 2008.
Caithness Windfarms: WIND TURBINE ACCIDENT Magnusson, A. K. and Donelan, M. A.: The Andrea wave. Charac-
AND INCIDENT COMPILATION, available at: http: teristics of a measured North Sea rogue wave, J. Offshore Mech.
//www.caithnesswindfarms.co.uk/fullaccidents.pdf, last ac- Arct., 135, 1–10, https://doi.org/10.1115/1.4023800, 2013.
cess: 30 September 2018. Maxial, D., Omira, R., Baptista, M. A., Rabinovich, A., and Viterbo,
Cruz, A. M. and Krausmann, E.: Vulnerability of the oil and gas sec- P.: Meteotsunamis in the instrumental records of the Iberian
tor to climate change and extreme weather events, Clim. Change, coast: Oceanic and atmospheric data analysis towards build-
121, 41–53, 2013. ing a meteotsunami catalogue, EGU General Assembly, 21,
Dean, R. G. and Dalrymple, R. A.: Water wave mechanics for engi- EGU2019-9953, Vienna, Austria, April 2019.
neers and scientists, World Scientific, New Jersey, 1991. Metoffice: Storm surge – November 2007, https://www.metoffice.
De Fraguier, E.: Lessons learned from 1999 Blayais flood: gov.uk/about-us/who/how/case-studies/floods-2007 (last access:
Overview of EDF flood risk management plan, RIC 2010 Ex- 21 September 2018), last update: 11 May 2011.
ternal Flood and Extreme Precipitation Hazard Analysis for Nu-
www.adv-geosci.net/49/187/2019/ Adv. Geosci., 49, 187–196, 2019196 A. J. Kettle: Storm Tilo over Europe in November 2007 Monserrat, S., Vilibić, I., and Rabinovich, A. B.: Meteotsunamis: RWS: Evaluatie Allerheiligenvloed 2006. Analyse van de voor- atmospherically induced destructive ocean waves in the tsunami spelling van de hoogwaterstand voor Delfzijl, 38 pp., Den Haag, frequency band, Nat. Hazards Earth Syst. Sci., 6, 1035–1051, the Netherlands, 24 November 2006b. https://doi.org/10.5194/nhess-6-1035-2006, 2006. RWS: Allerheiligenvloed 2006. Achtergrondverslag van de stor- Muir-Wood, R. and Grossi, P.: The catastrophe modelling response mvloed van 1 november 2006, Rijkswaterstaat Rijksinstituut to Hurricane Katrina, in: Climate Extremes and Society, edited voor Kust en Zee/RIKZ, Artoos Drukkerijen, Rijswijk, the by: Diaz, H. F. and Murnane, R. J., Cambridge University Press, Netherlands, 30 June 2007a. Cambridge, UK, 296–319, 2008. RWS: Verslag van de Stormvloed van 9 november 2007 (SR88), Murty, T. S.: Seismic Sea Waves Tsunamis, Bulletin of the Fisheries Ministerie van Verkeer en Waterstaat, Direktoraat-Generaal Research Board of Canada, Bulletin 198, Ottawa, 1977. Rijkswaterstaat Waterdienst, Stormvloedwaarschuwingsdi- Natural Environment Research Council: Annual Report for 2007 for enst/SVSD, Postbus 17, 8200 AA Lelystad, Lelystad, 45 pp., the UK National Tide Gauge Network and Related Sea Level Sci- November 2007b. ence, National Tide and Sea Level Facility, NERC 100017897, Salomon, J.-N.: L’inondation dans la basse vallée de la Garonne available at: https://www.bodc.ac.uk/data/hosted_data_systems/ et l’estuaire de la Gironde lors de la “tempête du siè- sea_level/uk_tide_gauge_network/reports/ (last access: 15 Octo- cle” (27–28 décembre 1999)/Flooding in the Garonne val- ber 2019), 2007. ley and the Gironde estuary caused by the “storm of Neumann, T. and Nolopp, K.: Three years operation of far offshore the century” (27–28 December 1999), in: Géomorpholo- measurements at FINO1, DEWI Magasin, 30, 42–46, 2007. gie: relief, processus, environnement, Avril–juin, 8, 127–134, Outzen, O., Herklotz, K., Heinrich, H., and Lefebvre, C.: Extreme https://doi.org/10.3406/morfo.2002.1134, 2002. waves at FINO1 research platform caused by storm ‘Tilo’ on 9 Spencer, T., Brooks, S. M., Evans, B. R., Tempest, J. A., and Möller, November 2007, DEWI Magazin, 33, 17–23, 2008. I.: Southern North Sea storm surge event of 5 December 2013: Paskal, C.: The security implications of climate change in the Water levels, waves and coastal impacts, Earth-Sci. Rev., 146, OSCE region, Organization for security and co-operation in Eu- 120–145, https://doi.org/10.1016/j.earscirev.2015.04.002, 2015. rope, Chairmanship Conference, Bucharest, 5 October 2009, Stoffelen, A.: Modelling Surges, Cork eSurge Training, Cork, Ire- PC.NGO/10/09, 12 October 2009. land, 20–21 February 2014. Pattiaratchi, C. B. and Wijeratne, E. M. S.: Are meteotsunamis Stull, R. B.: An Introduction to Boundary Layer Meteorology, an underrated hazard?, Phil. Trans. R. Soc. A, 373, 2140377, Kluwer Academic Publishers, Dordrecht, 1988. https://doi.org/10.1098/rsta.2014.0377, 2015. Terlouw, A.: Predicting morphological storm impact on coastal Pleskachevsky, A. L., Lehner, S., and Rosenthal, W.: Storm obser- dunes at Ameland, MSc thesis, University of Twente, Enschede, vations by remote sensing and influences of gustiness on ocean 2013. waves and on generation of rogue waves, Ocean Dynam., 62, Ulm, M., Arns, A., and Jensen, J.: Black swans and risk – assess- 1335–1351, https://doi.org/10.1007/s10236-012-0567-z, 2012. ing consequences of extreme events for the German Bight, 36th Pugh, D. T.: Tides, Surges and Mean Sea Level, John Wiley and International Conference on Coastal Engineering 2018 – Coastal Sons, Chichester, 1987. Protection and Risk, Baltimore, Maryland, USA, 30 July–3 Au- Pugh, D. and Woodworth, P.: Sea-Level Science. Understanding gust 2018. Tides, Surges, Tsunamis and Mean Sea-Level Changes, Cam- Upstream: Storms force Ekofisk closures, contributor: Michael bridge University Press, Cambridge, 2014. O’Neill, 9 November 2007a. Rosenthal, W., Lehner, S., Schulz-Stellenflet, J., and König, T.: Upstream: Passing storm keeps platforms shut, contributor: Rob Investigation of ship accidents using global ERS-2 and EN- Watts, 9 November 2007b. VISAT wave mode, The 2nd International Workshop on Ad- Upstream: Storm downs Nexen’s Buzzard, contributor: Jonathan vances in SAR Oceanography from ENVISAT and ERS Mis- Davis, 9 November 2007c. sions, 21–25 January 2008, available at: http://www.earth.esa. Upstream: Storm clips Buzzard’s wings, contributor: Anthea Pitt, int/seasar2008/participants/232/pres_232_rosenthal.pdf (last ac- 12 November 2007d. cess: 8 October 2019), 2008. Williams, J., Horsburgh, K. J., Williams, J. A., and Proc- Rosenthal, W., Pleskachevsky, A. L., Lehner, S., and Brusch, S.: tor, R. N. F.: Tide and skew surge independence: New in- Observation and modeling of high individual ocean waves and sights for flood risk, Geophys. Res. Lett., 43, 6410–6417, wave groups caused by a variable wind field, 12th International https://doi.org/10.1002/2016GL069522, 2016. Workshop on Wave Hindcasting and Forecasting, Kohala Coast, Hawai’i, HI, 2011. RWS: Verslag van de stormvloed van 31 oktober en 1 novem- ber 2006 (SR84), Allerheiligenvloed, Ministerie van Verkeer en Waterstaat, Rijkswaterstaat, Stormvloedwaarschuwingsdi- enst/SVSD, ‘s-Gravenhage, November 2006a. Adv. Geosci., 49, 187–196, 2019 www.adv-geosci.net/49/187/2019/
You can also read