ARTILLRY INTELLIGENCE BRIEFING - THE CAMERA IS THE NEW SEARCH BOX: ADS IN AR AUGUST 2018 - AR Insider
←
→
Page content transcription
If your browser does not render page correctly, please read the page content below
ARTILLRY INTELLIGENCE BRIEFING
THE CAMERA IS THE NEW SEARCH BOX: ADS IN AR
AUGUST 2018
Table of Contents
EXECUTIVE SUMMARY ......................................................................................................................................................... 3

KEY TAKEAWAYS.................................................................................................................................................................. 4

INTRODUCTION: SIGNS OF OPPORTUNITY ....................................................................................................................... 5

AR ADVERTISING: 3 EXAMPLES ......................................................................................................................................... 7

ARE AR ADS WORKING? .................................................................................................................................................... 10
HOW MUCH DOES IT COST? ................................................................................................................................... 11
INTERESTED IN AR ADS… NOW W HAT?................................................................................................................. 12

VISUAL SEARCH: PUSH VS. PULL .................................................................................................................................... 13
GOOGLE LENS: HIGHLY MOTIVATED ....................................................................................................................... 14
AR IN RETAIL: THE LAST MILE ............................................................................................................................... 15

LOCATION, LOCATION, LOCATION .................................................................................................................................. 16

BUY SIDE: ADVERTISER ADOPTION ................................................................................................................................ 19

THE BEAR CASE: DOES IT SCALE? ................................................................................................................................. 21

QUANTIFYING AR ADS: THE REVENUE OUTLOOK ........................................................................................................ 23
IN PERSPECTIVE ..................................................................................................................................................... 24

FINAL THOUGHTS: IT’S ALL ABOUT ANALYTICS ........................................................................................................... 25

KEY TAKEAWAYS (REDUX) ............................................................................................................................................... 26

ABOUT ARTILLRY INTELLIGENCE .................................................................................................................................... 27

METHODOLOGY................................................................................................................................................................... 29

DISCLOSURE AND ETHICS POLICY .................................................................................................................................. 29

CONTACT .............................................................................................................................................................................. 29

REFERENCES....................................................................................................................................................................... 30

                                                                                                                           Copyright © ARtillry Intelligence, 2018
Executive Summary
One of the many areas projected to be transformed by immersive computing is advertising. The
visually-immersive nature of technologies like AR and VR can offer advertisers new ways to spotlight
products, and to engage prospective customers in deeper ways than two-dimensional media.

For example, advertisers can create AR campaigns that let consumers visually infuse products in the
world around them, as captured through their smartphone’s camera. Several brands like Nike, Home
Depot and Michael Kors are already experimenting with – and learning from – such campaigns.

Beyond graphical AR overlays, advertisers will soon be able to participate in a related area: visual
search. A close cousin of AR, this is represented by tools like Google Lens, which let users point their
smartphone cameras at objects around them to contextualize (or purchase) those items.

Altogether, AR ad formats are beginning to map to existing 2D ad formats that advertisers have been
using for years. For example, branded graphical AR overlays are analogous to display advertising,
while visual search can carry similar dynamics and user intent as search advertising.

But the opportunity is to go much deeper than these legacy formats in both creative capacity and
effectiveness. Indeed, brands that have experimented with AR-based promotion already see
favorable engagement and conversion metrics, such as 11x increases in product purchases.

The opportunity is further fueled by vested interest of tech giants. Tech’s “four horsemen” – Google,
Apple, Facebook and Amazon – are especially keen on AR. Those specifically built on ad revenue
(Google and Facebook), will fight to ensure positioning in advertising’s next visually-immersive era.

Resulting competition will accelerate innovation, investment and market timing for AR advertising in
general. Indeed, one point of confidence ARtillry Intelligence holds for AR’s overall revenue
generation and opportunity is the level of motivation behind these tech giants to make it happen.

But it won’t be without challenges and question marks. Though all of the above stands to reason and
quantitative analysis, one wild card is advertiser adoption. They’re a famously laggard constituency of
the tech ecosystem, and the survey data we examine in this report indicates their AR uncertainty.

There are also practical hurdles. Though mobile AR’s addressable market is 762 million smartphones
at the time of this writing, the actual market is a subset of that. Active AR users are relatively few, and
session lengths are small, due to factors like arm strain, which diminish ad inventory.

All of these variables converge to drive $2.6 billion in AR ad revenues by 2022. But how will this
materialize? What campaign tactics work? And what does it mean for developers, media companies
and anyone vetting AR. This report answers such questions and dissects the AR ad opportunity.

                                                                       Copyright © ARtillry Intelligence, 2018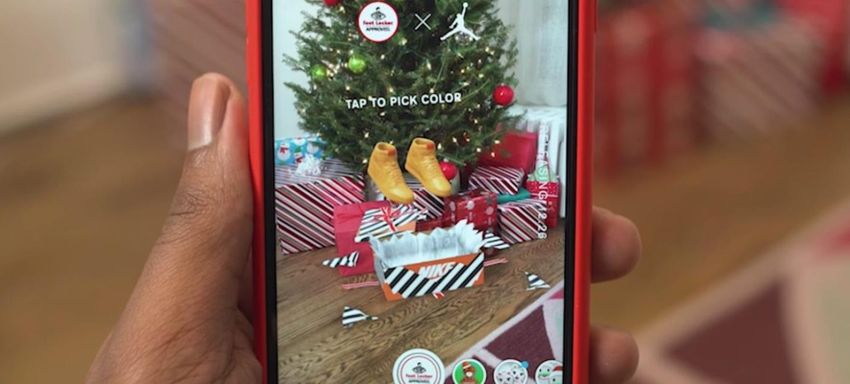
Key Takeaways
Key takeaways are also highlighted throughout the main body of this report.

Advertising has been transformed by Internet and mobile revolutions. Visually immersive tech could be next.
 Augmented Reality’s (AR) visual orientation and interactivity align with advertising’s core goals.
 AR can enhance “upper funnel” awareness ads by letting consumers playfully interact with products.
 AR can boost “Lower funnel” conversions by contextualizing products at or near the point of purchase.

AR advertising will piggyback on smartphone scale (762 million smartphones), and a visually-engaging format.
 AR can boost consumer purchase intent by 11x and time spent with media by 2.7x, according Houzz.

Advertisers are already reporting favorable Key Performance Indicators (KPIs) for AR campaigns.
 ASUS achieved 10x greater engagement with AR ads in Facebook Messenger.
 Kia achieved a 46 percent boost in dealer inventory searches, and a 20 percent boost in phone calls.
 Home Depot achieved 2+ minute engagement time and a 12.5 percent click through rate.
 Nike’s commerce-enabled AR ad for the exclusive Kyrie 4 shoe sold out all inventory in one hour.

Tech giants are investing heavily in AR advertising, providing further momentum and confidence.
 Ad-dominant business models (Facebook and Google) are motivated to position for advertising’s next era.
 Ad approaches map to existing business models and formats, such as display-oriented AR for Facebook.
 Google is investing heavily in visual search (Google Lens and VPS) given its ties to a $60 billion search business.
 Visual search will provide Google additional query volume and “last mile” attribution for in-store engagement.

Display-oriented AR ads dominate thus far, but visual search will emerge as an intuitive way to gather information.
  Visual search will take longer to develop, due to its reliance on advanced computer vision and the AR cloud.
  Longer term, visual search will gain share of AR ad dollars, due to its high-intent (thus high-value) use case.
  Visual search is also aligned with buying-empowered millennials’ sensibilities, given their affinity for the camera.

Location-relevant AR will be opportune given buying intent, proximity and immediacy that drive local search today.
  Most retail spending happens local/offline, but a growing portion is influenced by mobile engagement like search.
  AR will amplify this existing dynamic through an intuitive way to contextualize local stores, activities and products.
  ARtillry survey data indicate that the most desired AR use cases include local apps, such as city guides.

It’s not all good news for AR Advertising: Challenges await in brand adoption, risk aversion and learning curves.
   AR ad campaigns so far represent an adoptive minority: About 10% of brands have active AR initiatives.
   The rest are uncertain, citing lack of clear ROI, scale and internal aptitude.
   These reasons are misaligned with reality, such as ROI metrics, indicating that industry education is needed.

Technical and practical realities also present adoption hurdles for AR advertising.
 Though potential scale is high given 762 million smartphones, active users are a subset of that (158 million).
 AR has short session lengths due to arm fatigue, which further diminishes ad inventory.
 Platform fragmentation raises additional barriers by segmenting audience and complicating creative production.
 Success hinges on “native” development and analytics which will require time and learning curves.

All of the above variables converge to inform an AR advertising revenue outlook of $2.6 billion by 2022.
  This correlates to an active user base that grows from 158 million to 1.19 billion by 2022.
  AR Advertising will hold 5.4% of overall AR revenues, compared with mobile ads’ 10% of mobile industry revenue.
  AR ads will be display-dominant in early years, while visual search ad revenues gain share over time.
  This has historical parallels to online display ads that preceded more technically-advanced search ads.

                                                                                Copyright © ARtillry Intelligence, 2018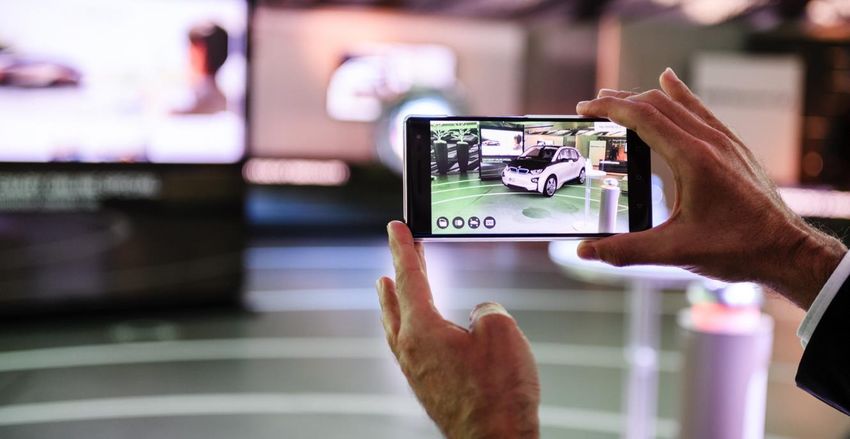
Introduction: Signs of
Opportunity
Whenever tech revolutions come along, they affect – and create opportunity within – several aspects
of our lives and work. This was the case with the PC, commercial internet and mobile revolutions.
One of the areas most transformed by these technology shifts has been media and advertising.

Advertising specifically has been completely transformed by the Internet, which was then further
catapulted by the distribution, formats and strategies developed in the smartphone era. ARtillry
Intelligence believes the next advertising inflection will happen with immersive media such as AR.

AR’s visual orientation and interactivity align with advertising’s core goals. It can enhance “upper
funnel” (e.g. awareness) ads by letting consumers playfully interact with products. And “lower funnel”
actions (e.g. conversions) are achieved by contextualizing products at or near the point of purchase.

Further boosting these qualitative attributes are quantitative measures. The advertising opportunity
piggybacks on AR’s scale: ARtillry Intelligence pegs mobile AR’s installed base at 762 million
smartphones at the time of this writing. This is key, given that brand advertisers are reach driven.

                                                                    Copyright © ARtillry Intelligence, 2018
Beyond high level or theoretical advantages, we’re seeing proof points that these factors translate to
real results. Among several key performance indicators (KPIs) detailed later in this report, AR can
boost consumer purchase intent by 11x and time spent with media by 2.7x, according Houzz.

Influential tech giants are also investing heavily in AR advertising, providing further confidence in its
opportunity. Ad-dominant business models at Facebook and Google have motivated significant
resources to ensure positioning in advertising’s next era, thereby accelerating the AR industry overall.

But it’s not all positive signals. Advertisers will be slow to adopt (as they often are), and already
indicate some uncertainty. And mobile AR presents challenges such as diminished ad inventory
through short session lengths, which can result from arm fatigue and other form-factor realities.

Further jeopardizing available ad inventory are questions of reach. Though the installed base of
compatible AR smartphones is sizeable, as noted, a more relevant figure is active AR users. That
figure stands at about 158 million users today, which is fragmented between different AR apps.

So where do all of the advantages and potential drawbacks come together and indicate the path
forward? We’ll examine all the factors in the following pages, including bull and bear perspectives,
and our ultimate revenue outlook. But first let’s examine the types of mobile AR ads developing today.

                                                                       Copyright © ARtillry Intelligence, 2018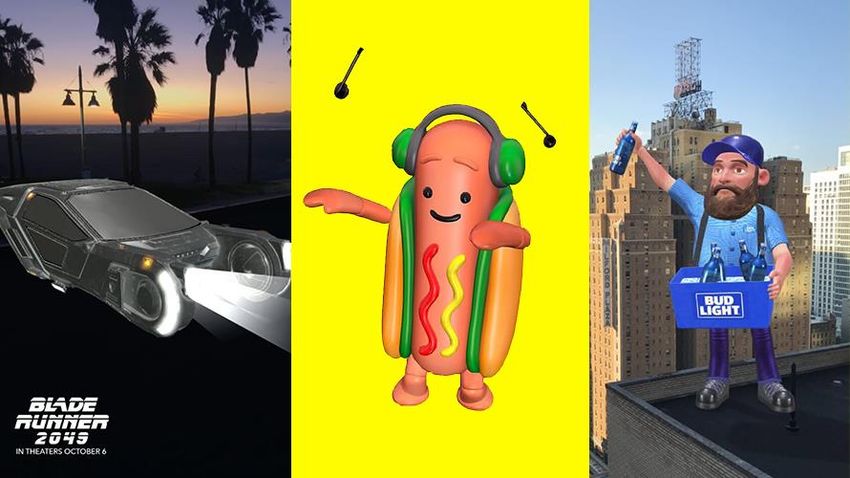
AR Advertising: 3 Examples
So what does AR advertising look like? It will develop in several ways as the medium evolves and as
creative professionals gain their “native footing” to optimize campaigns in ways that play to AR’s
strengths. Until then, we’re seeing early signs of effectiveness by several prominent brands.

Here are three illustrative examples.

1. Shoe Drop
                                             Advertiser: Foot Locker
                                             App/Network: Snapchat
                                             Advertising Stage: Upper funnel, awareness
                                             Cost: Programmatic ad buy, $3-$8 CPM (estimated total
                                             campaign cost = $22,000)
                                             Results: 45 second average play time, 4 million
                                             impressions

Foot locker, in partnership with Jordan Brand, devised an AR campaign to run on Snapchat. Using
Snapchat’s “Ad to AR” format, users swiped up on a related story to reveal a branded lens. In this
case, the lens featured an AR animation for a new shoe release and Gatorade flavor.

Specifically, users could launch the AR overlay, which featured the new shoe in an animated
sequence placed in their immediate surroundings. The gamified and animated appeal of the
campaign drove an average play time of 45 seconds, and four million total impressions.

Though it wasn’t the case in this campaign, Snapchat’s AR lenses can be integrated with its
“shoppable AR” program. This lets advertisers integrate an additional layer of transactional
functionality that lets users purchase goods right within Snapchat, which is more user-friendly.

This commerce infusion will be a key evolution in AR advertising, given the potential for lower-funnel,
high-intent interactions with products. As time goes on and advertisers gain greater levels of comfort
and skill with AR advertising, commerce functionality will allow them to take a “full funnel” approach.

                                                                     Copyright © ARtillry Intelligence, 2018
2. The Future’s Looking Bright
                              Advertiser: Michael Kors
                              App/Network: Facebook
                              Advertising Stage: Full-funnel, awareness and direct response
                              Cost: Undisclosed
                              Results: Unavailable (early stage)

Speaking of full funnel, Michael Kors is a launch partner for Facebook’s newest AR ad format which
places actionable AR ads in the news feed. Similar to standard news feed ads, these are placed
programmatically based on social signals and targeting parameters, but also come with AR triggers.

Known as News Feed AR ads, they let advertisers apply AR camera effects (in Facebook’s
terminology) including virtual product try-ons. The Michael Kors campaign did just that, allowing users
to quickly go from the ad unit to a front-facing camera activation that virtually tries on sunglasses.

Beyond the novelty and utility of trying on sunglasses, the ads can capture high user intent by flowing
into a transaction thread. Specifically, advertisers can integrate calls to action that lead users to an
online store. Video of product try-ons can also be shared with friends for an additional viral kick.

Though it’s too early to tell the results from this campaign, other KPIs are available for AR ads on
Facebook. For example, ASUS saw 10x greater engagement with AR ads in Facebook Messenger,
and Kia saw a 46 percent boost in dealer inventory searches, and a 20 percent boost in phone calls.

3. ‘Tis The Season
                                          Advertiser: Home Depot
                                          App/Network: Oath/Yahoo Mail
                                          Advertising Stage: Lower-funnel, direct response
                                          Cost: Undisclosed
                                          Results: 2+ minute average engagement time. 12.5 percent
                                          CTR to shopping page.

To drive interest around its holiday décor products, including Christmas Tree decorations, Home
Depot built an AR campaign that let users virtually decorate a tree. This was done with digital agency
RYOT using Unity, through publishing giant Oath, with Yahoo Mail as a distribution channel.

                                                                     Copyright © ARtillry Intelligence, 2018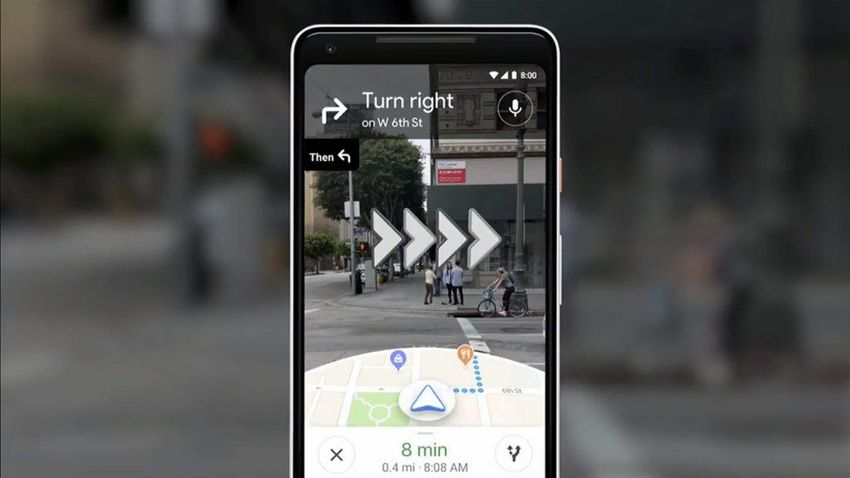
Much like the above examples, an AR activation could be launched from a typical banner ad. Once
clicked, users could place a virtual tree in their surroundings, then decorate that tree with animated
lights and ornaments. Interested users could then click to a transaction page to buy said items.

The results included an average engagement time that exceeded two minutes, and a 12.5 percent
click through rate to transaction pages. These are strong metrics in advertising terms. Also notable:
the campaign achieved greater scale through email distribution, and by not requiring app downloads.

“You click on a little link and it launches an AR shopping experience right there,” Unity’s Tony Parisi
said at AWE. “You decorate your Christmas tree and it closes the loop to the shopping page. They
got double the lift in terms of click-through, which demonstrates engagement to the shopping page.”

Honorable Mention: Does it Fit?
                                         Advertiser: N/A
                                         App/Network: Houzz
                                         Advertising Stage: Lower-funnel, direct response
                                         Results: 11x increase in purchase intent. 2.7x increase in
                                         time-in-app

When discussing AR engagement that drives measurable commerce, it’s only fair to cite Houzz. It
achieved an 11x boost in purchase intent and 2.7x boost in time spent. We list this as “honorable
mention” because it’s not technically an ad campaign (paid “ad buy”) like the above examples.

It is rather the standard engagement within its organic app, specifically using its AR furniture
visualization feature. This should be delineated from paid ad campaigns, but is nonetheless an
important indicator of commerce-oriented engagement levels that can be achieved with AR.

Image Credit: Houzz
                                                                     Copyright © ARtillry Intelligence, 2018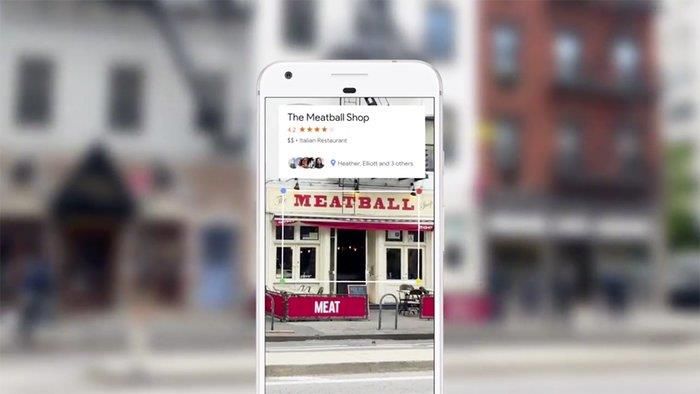
Are AR Ads Working?
The examples above specify results and performance indicators. For convenience, we’ve also
aggregated them below, along with a broader set of campaigns. For example, Nike's Kyrie 4 shoe
sold out in less than an hour through exclusive availability in a Facebook Messenger AR campaign.

Here are several more:

        Advertiser           App/Publisher         Campaign Dynamics                  Results
 Home Depot              Yahoo Mail               AR sequence launched        2+ minute average
                                                  from static email           engagement time. 12.5
                                                  banner ad.                  percent CTR to
                                                                              shopping page.
 Kia                     Facebook Messenger       Car visualization via       46 percent boost in
                                                  AR overlay, launched        dealer inventory
                                                  from Kia’s Facebook         searches; 20 percent
                                                  Messenger Bot.              boost in phone calls.
 Nike                    Facebook Messenger       Kyrie 4 shoe release        Shoe sold out in less
                                                  available exclusively       than an hour
                                                  through Facebook
                                                  Messenger after users
                                                  launched AR
                                                  visualization feature.
 Asus                    Facebook Messenger       Customers “virtually        Achieved 10x
                                                  unbox” latest               engagement compared
                                                  ZenPhone 5 via AR           to non-AR campaigns.
                                                  visualization launched
                                                  from Messenger.
 Foot Locker             Snapchat                 The latest Jordan           45-second average
                                                  sneaker visualized          play time, 4 million
                                                  through AR                  impressions.
                                                  animations, launched
                                                  from Snap Stories.
 N/A                     Houzz                    In-home furniture           11x increase in
                                                  visualization of a large    purchase intent. 2.7x
                                                  portion of Houzz’s          increase in time-in-app.
                                                  online catalogue.
 N/A                     Snapchat                 Branded Lenses,             Overall 15 percent
                                                  Shoppable AR and Ad         boost in purchase
                                                  to AR comprise its          intent and a 9 percent
                                                  current range of paid       boost in conversions
                                                  AR offerings.               from branded AR
                                                                              lenses.

                                                                   Copyright © ARtillry Intelligence, 2018
How Much Does It Cost?
One factor that comes up in any discussion of advertising efficacy and ROI is cost. With AR, it’s
nascence dictates a small corpus of available pricing data, as the above players keep their early and
experimental ad initiatives relatively quiet. But there are some signals and disclosures to examine.
The most information so far has come from Snapchat (or leaked by its advertisers). These figures can
be used as a proxy for the moving target that is AR ad pricing. For example, these are some of the
signals that ARtillry Intelligence uses in its bottom-up methodologyi for market sizing (explored later).
Currently, Snapchat offers a few options. The example given above for Foot Locker’s campaign
involves the relatively new “Snap Ad to AR” ads. One of its points of appeal is cost: It has been
reported to be more economical than branded AR lenses (though Ad to AR includes lenses).
Specifically, Ad to AR ads are auctioned at $3 to $8 CPMs, then placed programmatically and
targeted to relevant users and affinity groups in Snapchat’s social graph. Using these prices and
reported reach, we’ve estimated the cost of the above Foot Locker campaign to be $22,000.
This compares to branded lenses which cost $40,000 per day to run, plus an $8-$20 CPM. The
difference between “Ad to AR” and branded lenses is how they’re distributed. The former are
delivered through Snap Ads, while the latter are delivered through the lens tray of targeted users.
Though this is an admittedly a sample of one, it’s a valuable data point to calibrate how AR ad pricing
is shaping up today. Just like in the early days of smartphone advertising (which we covered at the
time), more data will become available. We’ll be watching closely and collecting it as that happens.
Image Credit: Snap, Inc.
Copyright © ARtillry Intelligence, 2018Interested in AR Ads… Now What?
Though this report’s scope is mostly high-level strategic analysis, we would be remiss to not at least
mention a few tactical details. For example, where do you begin? Many of the AR providers
mentioned above have tools to make it easier, but 3D graphical creation is still a specialized field.
Snapchat has launched its Lens Studio which provides developers and creative agencies a toolkit for
campaign creation. Facebook meanwhile offers a Video Creation Kit as part of its Camera Effects
platform. This similarly lets developers build campaigns from new or existing content assets.
Though these platforms are a bit fragmented in terms of standards and languages, we believe the
market will move towards more interoperability. That will happen through web XR, as well as tools
that allow developers to repurpose graphical assets or plug in to each platform as a unification layer.
This is analogous to what Unity has done in the broader world of 3D asset creation (and Unity will
play a part in AR ad creation, as it did with the above Home Depot ad). Several 3D graphics tools will
also continue to democratize creation, such as Google Blocks, Amazon Sumerian, and Adobe Aero.
But it will take a while to reach true interoperability. Fragmentation will inhibit growth among an
already-hesitant set of buyers (explored later). And despite democratized graphics tools, it’s safe to
assume that in the near term, 3D development skills are needed for campaigns like those above.
Image Credit: Snap, Inc.
Copyright © ARtillry Intelligence, 2018Visual Search: Push vs. Pull
Most AR ad campaigns examined so far involve ads that are programmatically pushed to users in a
targeted way. This is analogous to digital display ads today. Indeed, many of those AR activations
piggyback on exiting display ad channels and tactics. AR simply adds dimension as a call to action.
But beyond that push format, what about the advertising world’s other modality: pull. We’re of course
referring to search. It’s a $90 billion per year industry,ii whose success has a lot to do with its
contextual relevance and alignment with user intent. That’s because users explicitly indicate a need.
This push versus pull delineation will play into AR advertising’s evolution. Just as the web started with
display ads before search was introduced (GoTo.com, Overture, Google Page Rank, etc.), a similar
progression will happen in AR. That’s why the above examples are display-heavy in AR’s early days.
But search will gain prominence in AR in both native fit and in dollars (as quantified later). If you think
about it, AR is inherently a form of search. But instead of typing or tapping search queries in the
traditional way, the search input is your phone’s camera and the search “terms” are physical objects.
Image Credit: Google
Copyright © ARtillry Intelligence, 2018The way this is taking shape so far is “visual search.” Represented best by Google Lens, users point
their phones at items to retrieve information (or transact). Its use cases and product categories will
materialize over time (think: electronics and apparel), but could be almost as broad as search itself.
“A lot of the future of search is going to be about pictures instead of keywords,” Pinterest CEO Ben
Silberman said recently. His claim also underscores another key factor that indicates visual search’s
potential appeal: millennials. The buying-empowered generation has a high affinity for the camera.
Google Lens: Highly Motivated
These are some reasons why Google is keen on AR. As with all its XR initiatives, Google’s AR efforts
are driven to advance its core business.iii In other words, to continue dominating and deriving revenue
from search, Google must establish its place in this next visual iteration of the medium.
"Think of the things that are core to Google, like search and maps," said Google XR Partnership Lead
Aaron Luber at ARiA. "These are core things we are monetizing today and see added ways that we
can use [AR]. All the ways we monetize today will be ways that we think about monetizing with AR."
For example, a key search metric is query volume (along with cost-per-click, click-through-rate and fill
rates). Visual search lets Google capture more “queries” when consumers want information. These
out-of-home moments are “high intent” when monetization potential is greatest (see next section).
Image Credit: Google
Copyright © ARtillry Intelligence, 2018These aspirations will manifest initially in Google Lens. Using Google’s vast image database and
knowledge graph, Lens will identify and provide information about objects you point your phone at.
For example, point your phone at a store or restaurant to get business details overlaid graphically.
This can all be thought of as an extension to Google’s mission statement to “organize the world’s
information.” But instead of a search index and typed queries, local AR delivers information about an
item on that item. And instead of a web index, this works towards a sort of “internet of places” (IOP). iv
AR in Retail: The Last Mile
Google’s visual positioning service (VPS) is another manifestation of IOP. It helps shoppers navigate
and obtain product information in retail stores like Lowes. Using point-cloud based 3D mapping data
within retail partners’ locations, it will help consumers find the aisles and products they’re looking for.
“GPS can get you to the door, and then VPS can get you to the exact item that you’re looking for,”
said Google’s VR/AR lead Clay Bavor at last year’s VPS unveiling at Google I/O. “Imagine in the
future your phone could just take you to that exact screwdriver and point it out to you on the shelf.”
Like visual search, this will help Google serve monetizable information to consumers. But it also ties
nicely into Google’s existing search ad business with “last-mile” attribution data to report ROI to its
advertisers. It knows the best way to do that is to track dollars where they’re mostly spent – offline.
Image Credit: Lowes
Copyright © ARtillry Intelligence, 2018Location, Location, Location
Much of this report has focused on AR advertising that involves product engagement that flows into
an eCommerce function. Though we’re bullish on that opportunity, as characterized earlier, it could
pale in comparison to a separate but related opportunity: AR-guided offline commerce.
As background, it’s often forgotten that $3.7 trillion is spent in consumer retail purchases in the U.S.v
Of that total, $300 billion (8 percent) is e-commerce. This means offline brick & mortar spending –
though often overshadowed by its sexier online counterpart – is where the true scale occurs.
But digital media like mobile search is still impactful. Though spending happens predominantly offline,
it’s increasingly influenced online. Specifically, $1.7 trillion (46 percent of that $3.7 billion) is driven
through online and mobile consumer interactions. This is known as online-to-offline (O2O) commerce.
O2O is one key area where AR will find a home. Just think: is there any better technology to unlock
O2O commerce than one that literally melds physical and digital worlds? AR can shorten gaps in time
and space that currently separate those interactions (e.g. search) from their offline outcomes.
We’re talking contextual information on items you point your phone at. AR overlays could help you
decide where to eat, which television to buy, and where to buy the shoes you see worn on the street.
This is what ARtillry Intelligence calls “Local AR,” and it will take many forms – both paid and organic.
U.S. CONSUMER SPENDING
AR’S ADDRESSABLE MARKET WILL MAP TO WHERE THE MONEY IS BEING SPENT
$4.00 Total Retail Sales
$3.50
U.S. $ Trillions
$3.00
U.S. Trillions
$2.50
Digitally-
Influenced
$2.00 Offline Sales
$3.70
$1.50 Mobile-Influenced
Offline Sales
$1.00
$1.70
$0.50 $0.97 eCommerce
$0.30
$0.00
Source: Deloitte Digital
© ARtillry 2017
ARtillry Intelligence, 2018
Copyright © ARtillry Intelligence, 2018This once again goes back to search and its longstanding dynamics. For example, traditional (typed)
local search performs best when consumers are out of home, using their smartphones.vi This is when
“buying intent” is highest, and therefore when click-through-rates and other metrics are highest.
Proximity-based visual searches could carry that same high-value user intent. In fact, our recent
consumer survey research indicates local commerce could be a prominent AR use case.vii Among
types of AR apps that consumers want, city guides, in-store retail and commerce apps scored high.
These proximity-based searches are conducive to AR because the phone is near the subject (think: a
restaurant you’re walking by), and can therefore derive information and context after mapping it
visually. This really just makes it an evolution of high-intent local search… but done with the camera.
MOBILE AR APPS IN DEMAND
72% What types of mobile AR would be most valuable to you?
AR USER NON-USER
38% 39% 40% 39%
33% 35%
32%
27% 25% 25%
22% 23% 21% 19%
16%
13%
3%
In-store retail Games (Pokemon Visualizing large Sports (live stats & City guides (menus, Educational In-home technical Social media I’m not interested in
(product information, Go, NBA AR) items in your home player info during reviews, navigation) (historical landmarks, support (“see what I (augmenting pictures AR on my mobile
in-store navigation) (furniture, new car) events) museum tours, see” remote and videos) device.
astronomy) assistance)
Thrive Analytics
smart decisions that drive success
N= 2,198 © ARtillry Intelligence, 2018
Copyright © ARtillry Intelligence, 2018Video Companion: AR Advertising
(click URL to open)
https://youtu.be/naJ9MEeb0Ws
Copyright © ARtillry Intelligence, 2018Buy Side: Advertiser Adoption
AR campaign examples in this report represent an adoptive minority. How does the rest of the
industry look? According to Boston Consulting Group (BCG), ten percent of companies have AR
campaigns, 45 percent are interested, and 35 percent foresee campaign launches within two years.
As for the stage in the consumer purchase funnel where AR is making a mark, it’s mostly in
“consideration.” This makes sense, as higher-funnel stages like awareness are better served by
reach media like TV. But as examined above, AR presents an opportunity for full-funnel engagement.
Advertisers see this potential: when asked where AR will be in two years, BCG’s survey respondents
see it moving down the funnel (figures below). They also recognize that AR’s melding of digital and
physical worlds makes it fitting to proximity-based engagement like Google Lens or in-store overlays.
But advertisers’ feelings on the AR advertising opportunity aren’t all positive. They show lots of signs
of doubt or uncertainty. Among those uninterested in AR advertising, top reasons for holding back
include a lack of scale (explored later), internal expertise and unclear ROI (figures below).
Copyright © ARtillry Intelligence, 2018This speaks to the need for education because the KPIs for AR’s advertising efficacy are certainly
there. Advertisers just have to be made aware en masse, which will take a while if history is any
indication. Their acclimation to smartphone advertising is still underway, 10 years later.
But it goes beyond awareness and even real interest and adoption. AR ad campaign effectiveness
and sustained spending will come down to execution. And that will be an even longer learning curve,
which will be all about native ad design and measuring the right things (explored later).
In the meantime, there will be misfires and porting of legacy media to AR. It’s a necessary process,
like we saw in early days of smartphone ads. We even still see this, given that the desktop-inherited
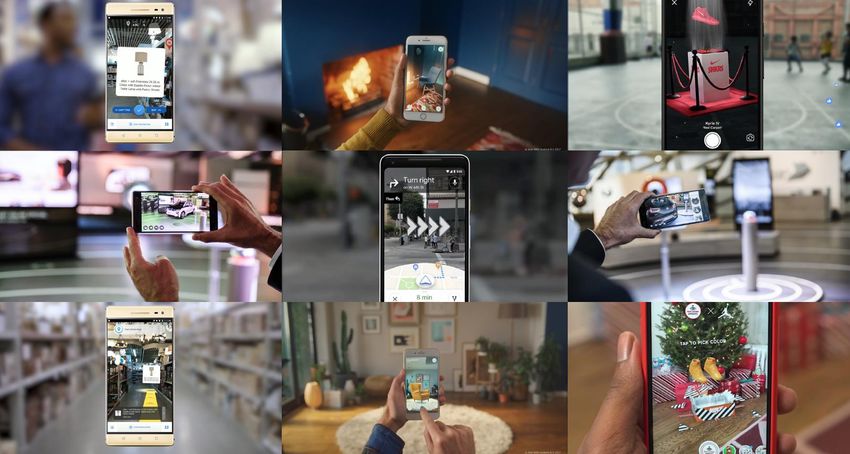
static banner ad persists in mobile. But AR’s eventual payoff will be big for those who get it right.
“In 2007 when Apple launched the iPhone, most of the apps were flashlights,” said Escher Reality
CTO Diana Hu at TechCrunch Disrupt. “People didn’t know what to do yet. And there’s going to be
this phase of learning. There’s a genesis of any technology when people need to experiment.”
Copyright © ARtillry Intelligence, 2018The Bear Case: Does it Scale?
When it comes to AR’s ad scenarios, there are lots of potential strengths including the high user
engagement and performance indicators examined earlier. But though that could be effective on an
individual-impression basis, AR advertising could be challenged to scale in the aggregate.
In other words, AR in the next 12-18 months will continue to have a relatively niche status in media
and advertising terms. This diminishes reach, which is a primary objective of most brand advertisers
and ad agencies. There’s simply not enough scale yet in AR to get them excited.
“Advertising is something we’ve thought of,” Snaappy CEO Gal Shvebish told ARtillry recently. “At the
moment, it won’t be interesting enough for brands because there isn’t enough muscle; there isn’t
enough of a user base and critical mass. How many people will see their ads?”
Quantifying that, there are about 2000 ARkit apps within a universe of about 2.2 million iOS apps.
And there will be 1.21 billion AR-compatible smartphones by the end of 2018. That’s a strong
addressable market, but a more relevant figure is the actual market of 158 million active AR users.
Copyright © ARtillry Intelligence, 2018In other words, ad networks, media companies and publishers don’t sell ads based on hardware
penetration (e.g. how many people own TVs). Ad sales happen based on specific and validated
network or publisher reach (e.g. how many people watch CBS on Tuesday night).
Those 158 million users represent 13 percent of 1.21 billion AR-compatible smartphones. Over time,
that percentage will grow as the industry evolves. Specifically, we project 1.19 billion mobile AR
active users by 2022 which is 36 percent of the 3.4 billion AR compatible smartphones at that time.
Beyond active users, it’s also important to consider metrics for usage. For example AR session
lengths are known to be short due to arm strain of holding one’s phone up. Developers are learning
and applying this to app design which is a good thing: but a by-product is diminished ad inventory.
Those ad inventory constraints combined with advertisers’ historically-validated pace of new
technology adoption (further supported by survey data in the previous section) signal us that AR ad
revenues will be relatively moderate in the near term. We’ll quantify that in more detail next…
ARCORE + ARKIT INSTALLED BASE
AR-Compatible smartphones versus active users (DETAILED VIEW)
4,000
Millions of Units
3,500 3,420
July 2018 Installed Base: 762
3,191
3,000 2,794
Millions of Units
2,500
2,193
2,000
1,500 1,197
1,219
1,000
957
699
477 439
500
48 158
0
2017 2018 (E) 2019 (E) 2020 (E) 2021 (E) 2022 (E)
AR-Compatible Phones Monthly Active AR Users
© ARtillry Intelligence, 2018
Copyright © ARtillry Intelligence, 2018Quantifying AR Ads: The
Revenue Outlook
Based on variables examined in the previous sections and several other market signals, ARtillry
Intelligence has quantified the revenue outlook for AR advertising. These figures are a component of
our global XR Revenue Forecastviii but are broken out in greater depth for the first time here.
Specifically, we project AR advertising to grow from $167 million in 2017 to $2.6 billion in 2022.
Notably, this is dominated by display-oriented AR advertising in the near term. Over time, search-
based AR advertising (visual search), will gain share for many of the reasons explored earlier.
This “late arrival” for visual search also follows a familiar historical pattern. As noted earlier, display
advertising was a predominant format in the web’s early days before search advertising started to
emerge. This is partly due to more complex and sophisticated technology, such as search algorithms.
In AR, visual search will also require more evolution in computer vision and the AR cloud. Though it’s
convenient to envision the act of pointing one’s phone at objects to receive qualifying information, its
“prime-time” introduction will involve lots of technology still in development by Google and others.
GLOBAL AR ADVERTISING BY FORMAT
Global AR ad revenues: search versus display (DETAILED VIEW)
3,000
$US Millions $2,619
2,500
2,000 $1,784
$ Millions
$1,783
1,500
$1,208
$1,444
1,000 $779.4
500
$428.3 $1,106
$166.7 $766.7 $835.7
$428.3 $340.1
$166.7 $12.7 $102.3
0
2017 2018 (E) 2019 (E) 2020 (E) 2021 (E) 2022 (E)
Visual-Search Ad Revenue AR Display Ad Revenue
© ARtillry Intelligence, 2018
Copyright © ARtillry Intelligence, 2018In Perspective
Panning back, AR advertising will be a relatively small portion of overall AR revenues. That overall pie
also includes AR software (e.g. app purchases) and hardware (AR glasses),. These are each driven
by different market dynamics and growth curves explored in our Global XR Revenue Forecast.ix
Specifically, advertising will hold a 14.8 percent share of AR revenues in 2017, shifting to 5.4 percent
in 2022. Reduction in share isn’t due to a deficiency in AR advertising but rather more accelerated
growth from other opportune areas of AR, such as consumer and enterprise hardware and software.
To put this further into perspective, mobile ad revenues today are about $107 billion.x Though that’s
sizeable, it’s only 10 percent of the $1.1 trillionxi mobile industry, including hardware, software, apps
and other revenue drivers. A similar share breakdown will play out in mobile AR as it matures.
It’s also important to specify what’s being measured. AR advertising includes money spent on paid
AR campaigns, such as the examples given earlier. It does not include general “marketing” spend,
such as brands that develop their own AR apps (measured under enterprise AR software spend).
Furthermore, devising these figures involves the “bottom-up” market-sizing methodology which
involves granular ad revenue dynamics such as campaign pricing and spending. For more on ARtillry
Intelligence’s market sizing calculations, see methodology section at the end of this report.
GLOBAL AR REVENUE OVERVIEW
(DETAILED VIEW)
2022: Enterprise AR
AR Hardware, Software & Advertising Revenues adoption accelerates,
$60,000 while software pulls
Excludes mobile network data & hardware revenue (smartphone shipments)
ahead as a leading
revenue stream, built on
2020-2021: Apple
$50,000 launches consumer
the installed base of
hardware adopted in
$48,418
smart glasses.
U.S. $Millions 2018 - 2019: Mobile AR
revenues pick back up Hardware revenues
preceding years. Saas $2,619
models facilitate rapid
through app sales and begin to ramp up in
refresh cycles and
2021. Software is still
$40,000 in-app purchases as recurring revenue.
U.S. $ Millions
the dominant revenue
ARkit and ARCore apps $15,406
source, due to
2017: Mobile AR
revenues dip as
rapidly grow. Pokémon
Go’s follow-up game continued mobile AR $31,439
(Harry Potter-themed) Penetration.
Pokémon Go $1,784
$30,000 engagement wanes. will drive considerable $3,375
ArKit and ARCore plant app revenue, as in-app
the stake for mobile purchase models and $10,455
$20,000
AR’s future. native AR standards
develop
$17,512
$2,363 $16,238
$1,208
$428 $6,307
$167 $779 $9,712
$10,000 $728
$5,936 $3,167 $825
$421
$1,927 $75 $4,531
$1,127 $35 $113
$7,125
$10,780
$280 $398 $997 $4,640
$0 $225 $298 $880
2017 2018 (E) 2019 (E) 2020 (E) 2021 (E) 2022 (E)
Enterprise AR Hardware Enterprise AR Software Consumer AR Hardware Consumer AR Software Advertising
© ARtillry Intelligence, 2018
Copyright © ARtillry Intelligence, 2018Final Thoughts: It’s All About
Analytics
One key theme in this report – and in lots of ARtillry writing is – “native” thinking. The idea is to build
new experiences around AR, rather than tacking AR to existing UX. Also known as “AR-first,” we
learned similar lessons in “mobile-first” design principles of the last decade, including advertising.
That not only applies to mobile apps and ads but how they’re measured. Just like AR ads will evolve,
analytics will have to evolve with them. That means metrics that align with user behavior and
accurately capture engagement. We’ve witnessed the same ongoing evolution with mobile ads.
In fact, this report’s author wrote an op-ed in 2009 that argued mobile engagement shouldn’t be
measured with the same metrics as the desktop PC.xii Things like clicks and impressions don’t do
justice to mobile’s more immersive engagement (e.g. touch). A similar scenario now faces AR.
This can be viewed as an opportunity. Due to relatively laggard advertiser adoption rates examined
earlier, we’re still measuring mobile ads with clicks and impressions. “Legacy” metrics will likewise
follow AR ads for years. But that signals opportunity for anyone who can break out of this mold.
Otherwise, misaligned ad metrics like click-through-rates will define AR ads. But AR advertising’s
value will only be realized when metrics truly capture user intent and behavior. Whether that’s gaze-
based or action-oriented (e.g. tracking store visits), there will be lots of transformation to watch.
Image Credit: BMW
Copyright © ARtillry Intelligence, 2018Key Takeaways (redux)
Key takeaways are also highlighted throughout the main body of this report.
Advertising has been transformed by Internet and mobile revolutions. Visually immersive tech could be next.
Augmented Reality’s (AR) visual orientation and interactivity align with advertising’s core goals.
AR can enhance “upper funnel” awareness ads by letting consumers playfully interact with products.
AR can boost “Lower funnel” conversions by contextualizing products at or near the point of purchase.
AR advertising will piggyback on smartphone scale (762 million smartphones), and a visually-engaging format.
AR can boost consumer purchase intent by 11x and time spent with media by 2.7x, according Houzz.
Advertisers are already reporting favorable Key Performance Indicators (KPIs) for AR campaigns.
ASUS achieved 10x greater engagement with AR ads in Facebook Messenger.
Kia achieved a 46 percent boost in dealer inventory searches, and a 20 percent boost in phone calls.
Home Depot achieved 2+ minute engagement time and a 12.5 percent click through rate.
Nike’s commerce-enabled AR ad for the exclusive Kyrie 4 shoe sold out all inventory in one hour.
Tech giants are investing heavily in AR advertising, providing further momentum and confidence.
Ad-dominant business models (Facebook and Google) are motivated to position for advertising’s next era.
Ad approaches map to existing business models and formats, such as display-oriented AR for Facebook.
Google is investing heavily in visual search (Google Lens and VPS) given its ties to a $60 billion search business.
Visual search will provide Google additional query volume and “last mile” attribution for in-store engagement.
Display-oriented AR ads dominate thus far, but visual search will emerge as an intuitive way to gather information.
Visual search will take longer to develop, due to its reliance on advanced computer vision and the AR cloud.
Longer term, visual search will gain share of AR ad dollars, due to its high-intent (thus high-value) use case.
Visual search is also aligned with buying-empowered millennials’ sensibilities, given their affinity for the camera.
Location-relevant AR will be opportune given buying intent, proximity and immediacy that drive local search today.
Most retail spending happens local/offline, but a growing portion is influenced by mobile engagement like search.
AR will amplify this existing dynamic through an intuitive way to contextualize local stores, activities and products.
ARtillry survey data indicate that the most desired AR use cases include local apps, such as city guides.
It’s not all good news for AR Advertising: Challenges await in brand adoption, risk aversion and learning curves.
AR ad campaigns so far represent an adoptive minority: About 10% of brands have active AR initiatives.
The rest are uncertain, citing lack of clear ROI, scale and internal aptitude.
These reasons are misaligned with reality, such as ROI metrics, indicating that industry education is needed.
Technical and practical realities also present adoption hurdles for AR advertising.
Though potential scale is high given 762 million smartphones, active users are a subset of that (158 million).
AR has short session lengths due to arm fatigue, which further diminishes ad inventory.
Platform fragmentation raises additional barriers by segmenting audience and complicating creative production.
Success hinges on “native” development and analytics which will require time and learning curves.
All of the above variables converge to inform an AR advertising revenue outlook of $2.6 billion by 2022.
This correlates to an active user base that grows from 158 million to 1.19 billion by 2022.
AR Advertising will hold 5.4% of overall AR revenues, compared with mobile ads’ 10% of mobile industry revenue.
AR ads will be display-dominant in early years, while visual search ad revenues gain share over time.
This has historical parallels to online display ads that preceded more technically-advanced search ads.
Copyright © ARtillry Intelligence, 2018About ARtillry Intelligence
ARtillry is a publication and intelligence firm that examines augmented reality and virtual reality,
collectively known as XR. Through writings, data and multimedia, it provides deep and analytical
views into the industry’s biggest players and opportunities. It’s about insights, not cheerleading.
Run by career analyst and journalist Mike Boland, coverage is grounded in a disciplined and
journalistic approach. It also maintains a business angle: Though fun and games permeate VR and
AR (especially the former) long-term cultural, technological and financial implications are primary.
Learn more at https://artillry.co/about
Copyright © ARtillry Intelligence, 2018About Intelligence Briefings
ARtillry Intelligence Briefings are monthly installments of VR/AR data and analysis. They synthesize
original and third-party data to reveal opportunities and dynamics of VR and AR sectors. In addition to
data, a layer of insights is applied to translate market events and raw figures into prescriptive advice.
More information, past reports and editorial calendar can be seen at:
https://artillry.co/artillry-intelligence/
About the Author
Mike Boland was one of Silicon Valley's first tech reporters of the Internet age, as a staff reporter for
Forbes (print) starting in 2000. He’s been an industry analyst covering mobile and social media since
2005, and is now Chief Analyst of ARtillry Intelligence, and SF president of the VR/AR Association.
Mike is a frequent speaker at industry conferences such as AWE, VRLA and LeadsCon. He has
authored in-depth reports and market-sizing forecasts on the changing tech & media landscape. He
contributes regularly to news sources such as TechCrunch, Business Insider and the Huffington Post.
A trusted source for tech journalists, his comments have appeared in A-list publications, including The
New Yorker, The Wall Street Journal and The New York Times.
Further background, history and credentials can be found at:
http://www.mikebo.land/
Copyright © ARtillry Intelligence, 2018Methodology
This report highlights ARtillry Intelligence viewpoints, gathered from its daily in-depth coverage of the
XR sector. To support the narrative, data are cited throughout the report. These include ARtillry
Intelligence original data, as well as that of third parties. Data sources are attributed in each case.
For market sizing and forecasting, ARtillry Intelligence follows disciplined best practices, developed
and reinforced through its principles’ 15 years in tech sector research and intelligence. This includes
the past 2.5 years covering AR & VR exclusively, as seen in research reports and daily reporting.
AR advertising figures specifically include money spent on paid AR campaigns, such as the examples
cited early in this report. Figures do not include general “marketing” spend, such as brands that
develop their own AR apps. The latter is measured in our forecast under enterprise AR software.
Furthermore, devising these figures involves the “bottom-up” market-sizing methodology, which
involves granular ad revenue dynamics such as campaign pricing and spending. For more on ARtillry
Intelligence’s market sizing and forecasting methodology, see the explanations at the following link.
https://artillry.co/artillry-
intelligence/forecasts/methodology/
Disclosure and Ethics Policy
ARtillry has no financial stake in the companies mentioned in this report, nor was it commissioned to
produce it. With respect to market sizing, ARtillry remains independent of players and practitioners in
the sectors it covers, thus mitigating bias in industry revenue calculations and projections.
ARtillry’s disclosure and ethics policy can be seen in full at:
https://artillry.co/about/disclosure-and-ethics-policy/
Contact
Questions and requests for deeper analysis can be submitted at:
https://artillry.co/contact/
Copyright © ARtillry Intelligence, 2018References
i https://artillry.co/artillry-intelligence/forecasts/methodology/
ii https://www.statista.com/outlook/219/100/search-advertising/worldwide
iii See ARtillry Intelligence Briefing, Tech Giants Tackle AR: https://artillry.co/2017/08/08/tech-
giants-tackle-ar-top-takeaways/
iv See ARtillry Intelligence Briefing, AR Cloud and the ‘Internet of Places’: http://artillry.co/artillry-
intelligence/ar-cloud-and-the-internet-of-places/
v
U.S. retail spending breakdown: https://www2.deloitte.com/us/en/pages/consumer-
business/articles/navigating-the-new-digital-divide-retail.html
vi Mobile users’ local purchase intent: http://www.mikebo.land/forecasting
vii See ARtillry Intelligence Briefing, Mobile AR Usage & Consumer Attitudes: http://artillry.co/artillry-
intelligence/mobile-ar-usage-and-consumer-attitudes/
viii See ARtillry Intelligence Briefing, XR Global Revenue Forecast 2017-2022:
http://artillry.co/artillry-intelligence/forecasts/xr-global-revenue-forecast-2017-2022/
ix
See ARtillry Intelligence Briefing, XR Global Revenue Forecast 2017-2022:
http://artillry.co/artillry-intelligence/forecasts/xr-global-revenue-forecast-2017-2022/
x https://www.recode.net/2017/9/14/16294450/mobile-ad-spending-growth-worldwide
xi https://www.statista.com/statistics/219546/global-mobile-industry-revenues-since-2011/
xii https://www.mobilemarketer.com/ex/mobilemarketer/cms/opinion/columns/4640.html
Copyright © ARtillry Intelligence, 2018You can also read