Asia Pacific Hotel Market Review - SPOTLIGHT: AUSTRALIA Q3 2016
←
→
Page content transcription
If your browser does not render page correctly, please read the page content below
Asia Pacific Hotel Market Review
SPOTLIGHT: AUSTRALIA

                     Q3 2016
Hotel Market Review                                     Australia

Australia Hotel Market Update                           Asia Pacific Hotel Market Review

                                                        Hotel Openings
         Quarter 1         2015     2016     % Change
                                                        Asia Pacific hotel openings as of YTD September 2016
 Number of Hotels           71       114       61%
                                                        continued in robust fashion with 376 new hotel openings,
 Number of Rooms           11,931   15,649     31%      representing 60,346 rooms.
         Quarter 2         2015     2016     % Change
                                                        As there are more hotel groups participating in Horwath
 Number of Hotels           97       118       22%
                                                        HTL’s deal signings and hotel openings report, the growth
 Number of Rooms           13,560   22,377     65%      is not necessarily reflective of the market’s growth year-on-
         Quarter 3         2015     2016     % Change   year.
 Number of Hotels           134      144       7%
                                                        The newly opened hotels between Q1 and Q3 2016 have
 Number of Rooms           19,474   22,320     15%
                                                        an average 160 key count, slightly larger compared to the
        YTD Q1-Q3          2015     2016     % Change   average key count seen in the previous year.
 Number of Hotels           302      376       25%
                                                        Economy hotel chains continue to dominate the hotel
 Number of Rooms           44,965   60,346     34%
                                                        opening market, representing 52 percent of the total
Source: Horwath HTL
                                                        market. This is mainly driven by the fast expansion of
                                                        franchised economy hotels in China.
Hotel Opening by Country
                                                        With regards to location, China recorded the highest
                                                        number of new properties opened in 2016, an increase of
                                                        61 percent year-on-year (y-o-y), contributing 74 percent
                                                        of total market, followed by Indonesia and Thailand, each
                                                        accounting for 5 percent.

                                                                 Quarter 1             2015       2016      % Change
                                                         Number of Hotels               250        187         25%
                                                         Number of Rooms              31,427     28,807        -8%

                                                                 Quarter 2             2015       2016      % Change
                                                         Number of Hotels               176        221         26%
                                                         Number of Rooms              34,899     45,306        30%

Source: Horwath HTL                                              Quarter 3             2015       2016      % Change
                                                         Number of Hotels               190        228         20%
                                                         Number of Rooms              32,001     37,507        17%

                                                                YTD Q1-Q3              2015        2016       % Change
                                                         Number of Hotels               516         636          20%
                                                         Number of Rooms              98,327      111,620        17%
                                                        Source: Horwath HTL

www.horwathhtl.com
www.strglobal.com
Hotel Market Review                                           Australia

Deals Signing by Country                                      Australia Hotel Market Review

                                                              Hotel Openings

                                                              Australia has seen a spate of hotel openings in 2016. In
                                                              the first three quarters of this year, 4,349 new rooms (36
                                                              properties) entered the market, more than double the
                                                              number compared to the same period last year.

                                                              A resilient economy, low interest rates and strong
                                                              international tourism growth are cited as some of the main
                                                              reasons behind the renewed interest in hotel development.

                                                                       Quarter 1             2015       2016     % Change
                                                               Number of Hotels                9         11         22%
Source: Horwath HTL
                                                               Number of Rooms                669      1,136        70%
Deal Signing                                                           Quarter 2             2015       2016     % Change
                                                               Number of Hotels                7         11         57%
During the first three quarters of 2016, the Asia Pacific
                                                               Number of Rooms                351      1,504       328%
Market recorded a total of 636 deal signed, with a total of
111,620 rooms.                                                         Quarter 3             2015       2016     % Change
                                                               Number of Hotels               11         11           -
The overall average key count was 175 rooms, slightly
                                                               Number of Rooms               1,105     1,709        55%
smaller compared to average key count in 2015.
Deals were signed across 22 countries with top 5 being                YTD Q1-Q3              2015       2016     % Change
China, India, Indonesia, Thailand, and Malaysia. China         Number of Hotels               27         36         33%
continued to be the most active market with a total 442        Number of Rooms               2,215     4,349        105%
new deals signed, representing 69 percent of total market,
                                                              Source: Horwath HTL
India came second with 37 deals signed.
                                                              As of YTD September 2016, 51 percent of new openings
Signings under a typical management contract represents       were 4-star rated (Upscale ranked) hotels. The 5-star
44 percent of all deals signed in 2016, compared to 53        (Luxury ranked) market has also seen significant growth,
percent during the same time last year. This was driven       accounting for just over a quarter of new rooms. It seems,
by the strong expansion of franchised economy hotels in       however, that 3 and 3.5-star (Midscale & Upper-Midscale
China.                                                        ranked) properties were less popular with developers,
                                                              accounting for just 17% of the new rooms in 2016.
Approximately 46 of the deals are scheduled for opening
within the same year of signing.                              The average 5-star hotel to open in 2016 had 186 rooms,
                                                              29 rooms more on average than a new 4.5-star hotel, and
Converted properties contributed up to 28 percent of all      76 rooms more on average than a new 4-star property.
reported deal signings, of which 86 percent are scheduled     5-star properties are typically more expensive to construct
for opening in 2016.                                          and operate, and thus require a greater number of rooms
                                                              to make them economically viable in Australia.

www.horwathhtl.com
www.strglobal.com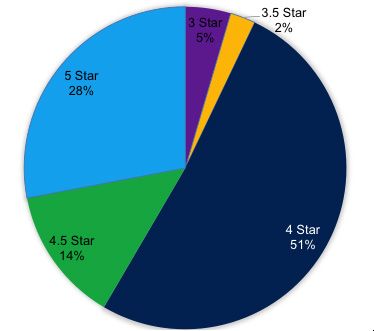
Hotel Market Review                                             Australia

New Rooms Openings YTD 2015 vs YTD 2016 by                      Deal Signing
Star Rating
                                                                The Australian economy is forecast to experience
                                                                continued stable growth, and likewise the hotel market is
                                                                expected to remain resilient, especially when compared
                                                                to other major markets around the world. Deal signings
                                                                are therefore expected to remain strong as international
                                                                investors increasingly seek to invest in safer Australian hotel
                                                                assets.

                                                                         Quarter 1              2015       2016      % Change
                                                                 Number of Hotels                 11         11            -
Source: Horwath HTL
                                                                 Number of Rooms                1,582      2,287        45%
Number of New Hotel Rooms in Australia’s                                 Quarter 2              2015       2016      % Change
Capital Cities, YTD September 2016                               Number of Hotels                 10         24         140%
                                                                 Number of Rooms                1,481      5,161        248%
Sydney is Australia’s hottest hotel market, not just in terms
of performance, but also in the amount of new properties                 Quarter 3              2015       2016      % Change
coming online. During the first three quarters of 2016, 37       Number of Hotels                 3          12         300%
percent of Australia’s new branded rooms opened up in
                                                                 Number of Rooms                 175       2,083       1090%
Sydney.
                                                                        YTD Q1-Q3               2015        2016     % Change
Sydney may have had the largest number of additions              Number of Hotels                 25         47         96%
but more telling are the 1,013 rooms, which opened in
                                                                 Number of Rooms                3,238      9,531        194%
Brisbane, a city less than half the size of Sydney. These
                                                                Source: Horwath HTL
openings are to a large extent the results of planning
decisions made during the resource sector boom years,
                                                                2016 YTD Deal Signings by Star Rating
when occupancy and rate outlooks were much more
optimistic. Perth and Darwin, two further resource-
                                                                4-star hotels are set to remain the dominant hotel class in
dependent cities, have also seen a number of new
                                                                Australia, with 51 percent of new hotel deals relating to
openings, even as occupancy and rate in both cities
                                                                a 4-star hotel. Deal signings in the 5-star market are also
continues to slide.
                                                                strong, accounting for 28 percent of new rooms signed,
                                                                perhaps indicating current under-supply or perceived
Melbourne, by contrast, saw only five new additions,
                                                                opportunity in this segment. Inline with current openings,
relatively little for Australia’s second largest city.
                                                                the Midscale market is experiencing limited activity.

Source: Horwath HTL

www.horwathhtl.com
www.strglobal.com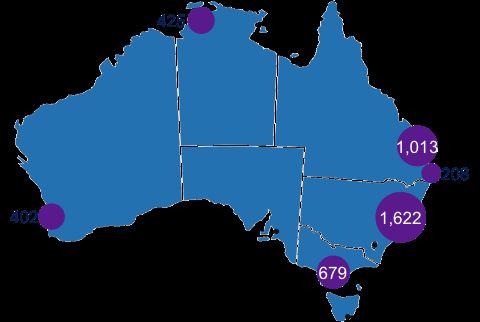
Hotel Market Review Australia
Australia Performance, YTD September 2016
Last year, while hotels in most key countries in the
Asia Pacific region struggled, Australian hotels showed
resilience, posting growth across all key performance
indicators. In 2015, the market registered growth in
both occupancy and ADR at 1.6 percent and 2.6 percent
respectively.
This positive trend has continued this year, with the
country’s occupancy and ADR growing by 1.1 percent,
and 1.4 percent respectively as of YTD September 2016.
As a result, RevPAR increased 2.5 percent compared to the
same time last year. Limited supply growth (+1.7 percent)
and steady market demand (+2.8 percent) have helped the
Source: Horwath HTL
country maintain healthy occupancy levels.
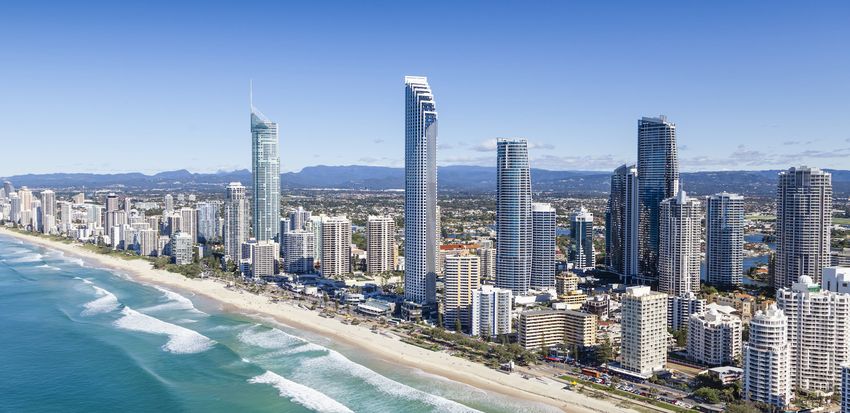
Deal Signings by Location, YTD September 2016
Australia welcomed 5.23 million international visitors
Sydney looks set to see even more new hotels opening
between January and August 2016, up 11.7 percent
up, with a full third of deals signed being for hotels in the
compared to the same period last year, according to the
Harbour City. Australia is also starting to see resurgence
Australian Bureau of Statistics (ABS). China, New Zealand,
in its leisure destinations, after many years of anaemic
and the United States were the top 3 tourism source
growth. The Gold Coast, in particular, is likely to see a large
markets, accounting for approximately 40 percent of total
increase in hotel rooms in the coming 3-5 years.
international arrivals. According to the ABS, over half of the
total international arrivals entered as leisure visitors, while
Brisbane, struggling under the weight of new supply, now
the Visiting Friends & Relatives (VFR) category and business
has far fewer new signings than a couple of years ago.
travelers accounted for roughly 31 percent of the total
It will likely be some time before the market absorbs the
arrivals.
new supply and is able to recover. Until then it may prove
difficult for new hotel developments to stack-up.
Australia Performance, Occupancy & ADR Growth, FY 2014
- YTD Sept. 16, Australian Dollar
Interestingly, new hotel deals continue to be inked for
Perth, inevitably contributing to increased uncertainty
about future performance in a market already significantly
down from its 2012 high.
Source: STR
A weaker Australian Dollar has resulted in a shift to more
domestic travel, as traveling abroad has become more
Source: Horwath HTL expensive for Australians. As of June 2016, domestic
travel was up 4.2 percent, according to Tourism Research
www.horwathhtl.com
www.strglobal.com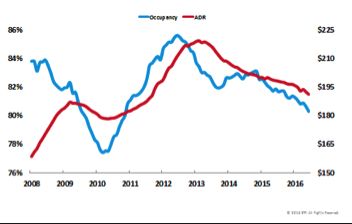
Hotel Market Review                                             Australia

Australia (TRA), with leisure travel accounting for most of    Australia Performance by States, Occupancy & ADR
the growth.                                                    Growth, YTD Sept. 16, Australian Dollar

New South Wales (NSW), Victoria and Queensland held
their titles as the most frequented states, accounting for
nearly 80 percent of total domestic travel, according to
TRA.

Among the three regions, NSW was the most visited state
for leisure travel, up 10.1 percent in Q1 2016. Victoria
ranked second, with a 2.6 percent y-o-y increase, and
Queensland ranked third with a 12.6 percent increase for
leisure visitors.

As of YTD June 2016, business travel decreased 14.2            Source: STR
percent and 2.8 percent in Queensland and Victoria,
respectively, while NSW reported an increase of 4.9            Sydney and the Other Key Financial Centres
percent.
                                                               RevPAR Comparison (Indexed to 2008), Key Financial
Territory Performance, YTD September 2016                      Center Worldwide, 2008 - YTD Sept. 16, in local currency

New South Wales led the states in hotel performance for
the first nine months of the year. Mainly driven by ADR
(+4.9 percent), NSW’s RevPAR grew 6.1 percent. The story
was, however, less rosy in some of the other states. ADR
dropped by 7.5 percent in the Northern Territory and by
5.6 percent in Western Australia. These regions also posted
the largest RevPAR declines in Australia at 7.7 percent
and 8.2 percent respectively. Hotels in both territories are
struggling due to a downturn in the resources industry,
brought on by a drop in commodities prices since 2012.

                                                               Source: STR
Softened demand growth was seen in the Australia Capital
Territory (ACT), as occupancy decreased 1.0 percent, in
                                                               Occupancy and ADR Growth, Key Financial Centers
part because many members of parliament were absent
                                                               Worldwide, YTD Sept. 16, in local currency
during the federal election period, slowing business
activity. Tasmania experienced a substantial growth in
demand (3.3 percent), boosting occupancy by 3.3 percent
and contributing to a 4.9 percent increase in RevPAR.
Queensland, South Australia and Victoria all benefitted
from increases in both domestic and international arrivals.

                                                               Source: STR

www.horwathhtl.com
www.strglobal.com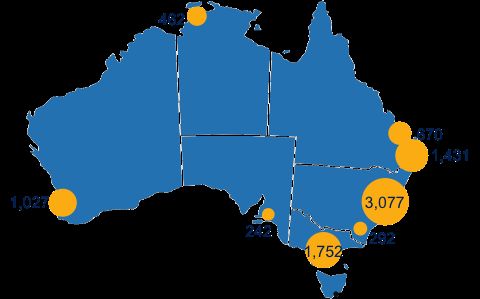
Hotel Market Review                                             Australia

The RevPAR comparison graphs above show how Sydney is           part due to the transition of the INPEX project moving
performing against other major world markets: New York          from the construction phase into production phase,
City, Hong Kong, Tokyo, Singapore and London.                   requiring fewer workers and, in turn, reducing demand
                                                                for accommodation nights. As of YTD September 2016,
The RevPAR performance of each market is indexed with           Darwin’s RevPAR decreased by 11.9 percent, as a result of a
their 2008 levels, to show how significantly the global         3.5 percent decline in occupancy tied with an 8.8 percent
financial crisis (GFC) impacted each market’s performance       decline in ADR.
in 2009 and how quickly each market recovered.
                                                                Perth Occupancy and ADR, R12 Monthly Data (Jan. 08 -
In 2009, Sydney’s demand declined 1.0 percent, while            Sept. 16, in local currency
RevPAR declined 8.4 percent. However, the market
bounced back quickly in 2010, as the Australian economy
proved resilient. Since 2010, Sydney’s occupancy has
remained fairly stable, averaging 82.7 percent over the
past five years. This will likely continue in 2016, as supply
growth has been slow since 2010, and ADR and RevPAR
have continued to grow each year.

Darwin Occupancy and ADR, R12 Monthly Data (Jan. 08
- Sept. 16, in Australian Dollar

                                                                Source: STR

                                                                Perth’s performance has been driven down by decline in
                                                                ADR every year since 2013, due to decreasing demand,
                                                                and competitive-rate, volume-driven strategy adopted by
                                                                hoteliers to try and fill their hotels.

                                                                Although Perth’s occupancy remained steady in 2015,
                                                                around the 80 percent level, ADR sank to its lowest level
                                                                since 2011 (-1.8 percent y-o-y to AUD 196.5). As of YTD
                                                                2016, the market has continued to struggle in 2016, as
Source: STR                                                     ADR declined 6.7 percent, while occupancy dropped 2.5
                                                                percent compared to the same time last year. As a result,
After the GFC, Brisbane’s hotel performance reached its         RevPAR dropped 9.1 percent y-o-y to AUD 144.5.
peak coinciding with the boom in the resource industry.
Strong growth in both international and domestic travel,
limited supply additions and robust demand growth, all          OUTLOOK
helped the market’s performance. It was however not to
last. A large increase in supply (+6.8 percent) in 2015,        Continue low interest rates and weaker dollar are anticipate
combined with the downturn of the resource industry             to help the NSW economy to grow robustly in the coming
saw Brisbane’s RevPAR decrease to its lowest level since        years. RND will likely to grow by a healthy CAAG rate of
the financial crisis (-11.5 percent y-o-y to AUD 126.5).        3.7 percent between now and 2021. The supply additions
The trend has continued this year, as Brisbane reported         is expected to be absorbed smoothly together with the
negative performance across all key indicators (occupancy       solid economic growth, the market’s RevPAR is expected to
-2.4 percent, ADR -6.6 percent, and RevPAR -8.9 percent).       growth at a CAAG rate of 4.7 percent between now and
                                                                2021.
After a significant RevPAR jump from AUD 114.4 in
2009 to AUD 144.8 in 2013, in 2014 Darwin started               Melbourne’s RND growth is also expected to be positive
to face challenges as demand dried up. This was in              in the next 5 years. The demand is forecasted to grow at

www.horwathhtl.com
www.strglobal.com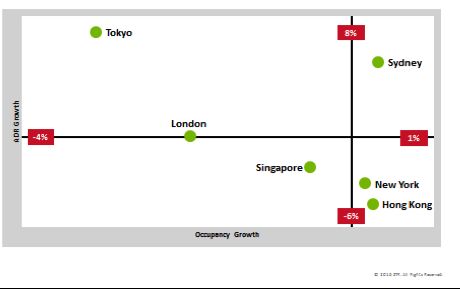
Hotel Market Review                                            Australia

a CAAG rate of 3.2 percent from 2016 to 2021. However,        WRITTEN BY:
the market is anticipated strong growth is supply, which
will put downward pressure on both occupancy and ADR.
Thus, RevPAR is expected to grow at a slower pace of          HORWATH HTL SINGAPORE
CAAG rate of 2.4 percent for the same period.                 15 Scotts Road, #08-10/11 Thong Teck Building
                                                              228218 Singapore
Brisbane’s RND growth is expected to be the most robust       Singapore
amongst the three markets, at a healthy CAAG rate of 5.7      singapore@horwathhtl.com
percent between now and 2021. However, the market             +65 67 351 886
also expects an influx of supply for the same period. Thus,
RevPAR is expected to grow at a CAAG rate of 1.5 percent      HORWATH HTL AUSTRALIA
for the same period.                                          Level 15, 1 O Connell Street
                                                              Sydney, NSW 2000
                                                              Australia
                                                              sydney@horwathhtl.com
                                                              +61 2 9262 2155

                                                              www.horwathhtl.asia
                                                              www.horwathhtl.com

                                                              STR SINGAPORE
                                                              Thong Teck Building
                                                              15 Scotts Road #08-12
                                                              228 218 Singapore
                                                              Singapore
                                                              APInfo@strglobal.com
                                                              +65 6800 7850

                                                              STR AUSTRALIA
                                                              +61 (0) 2 8091 2009

                                                              www.strglobal.com

www.horwathhtl.com
www.strglobal.com
ASIA PACIFIC EUROPE
AUCKLAND, NEW ZEALAND AMSTERDAM, NETHERLANDS LATIN AMERICA
auckland@horwathhtl.com amsterdam@horwathhtl.com BUENOS AIRES, ARGENTINA
cspinelli@horwathhtl.com
BANGKOK, THAILAND ANDORRA LA VELLA, ANDORRA
HEALTH & WELLNESS vmarti@horwathhtl.com DOMINICAN REPUBLIC
ischweder@horwathhtl.com speralta@horwathhtl.com
BARCELONA, SPAIN
BANGKOK, THAILAND vmarti@horwathhtl.com SANTIAGO, CHILE
nikhom@horwathhtl.com cspinelli@horwathhtl.com
BELGRADE, SERBIA
BEIJING, CHINA slovreta@horwathhtl.com
beijing@horwathhtl.com
BUDAPEST, HUNGARY MIDDLE EAST
HONG KONG, SAR mgomola@horwathhtl.com DUBAI, UNITED ARAB EMIRATES
hongkong@horwathhtl.com kdrubbel@horwathhtl.com
DUBLIN, IRELAND
JAKARTA, INDONESIA ireland@horwathhtl.com
jakarta@horwathhtl.com
BERLIN, GERMANY NORTH AMERICA
KUALA LUMPUR, MALAYSIA germany@horwathhtl.com ATLANTA, USA
kl@horwathhtl.com pbreslin@horwathhtl.com
ISTANBUL, TURKEY
MUMBAI, INDIA merdogdu@horwathhtl.com DENVER, USA
vthacker@horwathhtl.com jmontgomery@horwathhtl.com
LISBON, PORTUGAL
SHANGHAI, CHINA vmarti@horwathhtl.com MIAMI, USA
shanghai@horwathhtl.com acohan@horwathhtl.com
LIMASSOL, CYPRUS
SINGAPORE, SINGAPORE cmichaelides@horwathhtl.com MONTREAL, CANADA
singapore@horwathhtl.com pgaudet@horwathhtl.com
LONDON, UK
SYDNEY, AUSTRALIA eheiberg@horwathhtl.com NEW YORK, MADISON AV., USA
rdewit@horwathhtl.com pbreslin@horwathhtl.com
MADRID, SPAIN
TOKYO, JAPAN vmarti@horwathhtl.com NEW YORK, ROCKEFELLER PL., USA
tokyo@horwathhtl.com jfareed@horwathhtl.com
OSLO, NORWAY
oslo@horwathhtl.com ORLANDO, USA
jfareed@horwathhtl.com
AFRICA PARIS, FRANCE
ABIDJAN, IVORY COAST pdoizelet@horwathhtl.com TORONTO, CANADA
cspecht@horwathhtl.com pgaudet@horwathhtl.com
ROME, ITALY
KIGALI, RWANDA zbacic@horwathhtl.com
fmustaff@horwathhtl.com
SALZBURG, AUSTRIA
CAPE TOWN, SOUTH AFRICA austria@horwathhtl.com
capetown@horwathhtl.com
WARSAW, POLAND
dfutoma@horwathhtl.com
ZAGREB, CROATIA
zagreb@horwathhtl.com
ZUG, SWITZERLAND
hwehrle@horwathhtl.com
www.horwathhtl.comASIA PACIFIC EMEA LATIN AMERICA
AUSTRALIA DUBAI, UAE ARGENTINA / BRAZIL
+61 (0) 2 8091 2009 + 971 (0) 557 701202 +55 (11) 30932765
BEIJING, CHINA LONDON, UK
+86 (0) 10 8518 2438 +44 (0) 207 922 1930 NORTH AMERICA
HENDERSONVILLE, TENNESSEE, USA
HONG KONG, CHINA MADRID, SPAIN +1 615 824 8664
+852 6963 0761 +34 9 1123 3296
JAKARTA, INDONESIA MILAN, ITALY
+62 (0) 21 2555 8944 +39 02 4547 2236
MUMBAI, INDIA
+91 (0) 22 6631 1480
SINGAPORE, SINGAPORE
+65 6800 7850
TOKYO, JAPAN
+81 (0) 3 4589 9890
apinfo@str.com hotelinfo@str.com info@str.com
www.strglobal.comYou can also read