Assessing inequality, irregularity, and severity regarding road traffic safety during COVID 19 - Nature
←
→
Page content transcription
If your browser does not render page correctly, please read the page content below
www.nature.com/scientificreports
OPEN Assessing inequality, irregularity,
and severity regarding road traffic
safety during COVID‑19
Lei Lin1, Feng Shi2 & Weizi Li3*
COVID-19 has affected every sector of our society, among which human mobility is taking a dramatic
change due to quarantine and social distancing. We investigate the impact of the pandemic and
subsequent mobility changes on road traffic safety. Using traffic accident data from the city of Los
Angeles and New York City, we find that the impact is not merely a blunt reduction in traffic and
accidents; rather, (1) the proportion of accidents unexpectedly increases for “Hispanic” and “Male”
groups; (2) the “hot spots” of accidents have shifted in both time and space and are likely moved from
higher-income areas (e.g., Hollywood and Lower Manhattan) to lower-income areas (e.g., southern
LA and southern Brooklyn); (3) the severity level of accidents decreases with the number of accidents
regardless of transportation modes. Understanding those variations of traffic accidents not only sheds
a light on the heterogeneous impact of COVID-19 across demographic and geographic factors, but also
helps policymakers and planners design more effective safety policies and interventions during critical
conditions such as the pandemic.
The coronavirus disease 2019 (COVID-19) has undoubtedly impacted all aspects of our s ociety1,2. In particular,
the human mobility is taking a big hit due to quarantine and social distancing. For example, the total amount of
travels in the US dropped 71% between early March and mid A pril3 in 2020. A direct consequence of the reduced
mobility is reduced traffic, and a seemingly straightforward question follows: How is road safety affected by the
COVID-19 pandemic? This simple question turns out to have conflicting answers.
On one hand, reduced mobility leads to a decreased number of traffic accidents because the number of
accidents is known to be positively correlated with the amount of t raffic4. A reduction of almost 50% in traffic
accidents after the stay-at-home orders is found in five states in the U S5. On the other, researchers and authorities
both find that the new traffic pattern can cause frequent speeding, careless driving, and even “revenge driving”,
hence worsening road safety. One report from the National Safety Council (NSC) shows that the fatality rate of
traffic accidents increases 14% in March 2020, compared to the same period in 20196, while others find the num-
ber of fatalities either increasing or decreasing in different regions due to various factors including topography,
driving culture, or police recording p rocedures7.
Previous studies have mainly taken the descriptive approach to analyze road safety and used government
orders’ dates as the mobility change-point5,8,9. Studies that statistically evaluate the road safety during the pan-
demic and use systematically-determined mobility change-point are scarce. Besides, previous studies mainly
examine the temporal changes of road safety, changes of the spatial distribution of traffic accidents are largely
under-investigated. Here we take a systematic and statistical approach to assessing road traffic safety during
the COVID-19 pandemic. Using traffic accident data from the city of Los Angeles (LA)10 and New York City
(NYC)11, we find that although the number of accidents drops substantially across demographic groups during
the pandemic, different groups are affected disproportionately. Beyond demographics, we also observe that
the “hot spots” of accidents have shifted in both time and space. Finally, we find one positive change during
the pandemic—the severity level of accidents decreases with the number of accidents. Overall, the impact of
COVID-19 on road traffic safety is found far more complicated than a blunt reduction in traffic and accidents.
Understanding traffic accidents in various demographic groups will not only shed a light on the heterogene-
ous impacts of COVID-19 but also contribute to transportation inequity analysis in general9. Road traffic safety
has been a long-standing challenge for modern society, with an estimate cost of $871 billion dollars annually
in the U.S.12. In order to contain the spread of COVID-19, a natural experiment is conducted as a byproduct
that dramatically reduces the traffic and provides unprecedented data to study how traffic accidents change
1
Goergen Institute for Data Science, University of Rochester, Rochester, USA. 2Odum Institute for Research in
Social Science, University of North Carolina at Chapel Hill, Chapel Hill, USA. 3Department of Computer Science,
University of Memphis, Memphis, USA. *email: wli@memphis.edu
Scientific Reports | (2021) 11:13147 | https://doi.org/10.1038/s41598-021-91392-z 1
Vol.:(0123456789)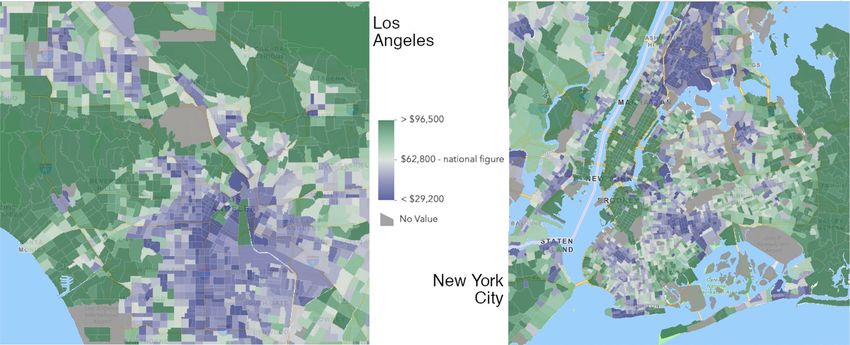
www.nature.com/scientificreports/
Figure 1. Detected mobility change-points, Stay-at-Home order dates, daily new COVID-19 cases, and Google
Mobility Index of LA and NYC are shown.
Figure 2. Change of daily accidents across age, race, and gender groups. Top: Change of daily accident count.
Bottom: Change of daily accident fraction (the fraction of daily accidents among all accidents that day for each
group). 95% confidence intervals are shown as vertical bars for each data point. Also shown are estimates from
three time windows: 15 days (blue and green), 30 days (purple and orange), and 60 days (red and cyan) before
and after the mobility change-point.
accordingly. Although such measures are not reproducible, understanding their effect can help us design more
effective road safety policies and interventions.
Worth noting, existing studies have analyzed the impact of COVID-19 on various aspects of our transporta-
tion systems, including transport energy13, air pollution14, and freight transportation15. Researchers have also
explored the potential of redesigning buildings and urban areas, such as leveraging sustainable built environment
solutions, to prevent the spread of COVID-1916. We contribute to this broad literature by filling the gap of the
impact of COVID-19 on road traffic safety.
Results
Mobility change‑point. The mobility change-point is the date when there is an abrupt, dramatic change of
the mobility flow of a large group of people (See Methods for detailed definitions). Existing studies mainly use
the dates of government’s stay-at-home orders as the mobility change-points5,8,9, ignoring the fact that the soci-
ety might have different reaction time to the disease17. Here, we resort to a systematic and statistical approach
via the change-point detection algorithm18. The mobility time series is chosen to be the Google Mobility I ndex19.
Figure 1 shows the detected mobility change-point, March 15, 2020, which is prior to the dates of stay-at-home
orders (e.g., March 19 and March 22). Using this date, we study the differences in traffic accidents beforehand
and afterwards.
Inequality. Figure 2 shows the change of daily traffic accidents concerning age, race, and gender before and
after the mobility change-point. The top row presents the changes in daily accident counts: they are significantly
Scientific Reports | (2021) 11:13147 | https://doi.org/10.1038/s41598-021-91392-z 2
Vol:.(1234567890)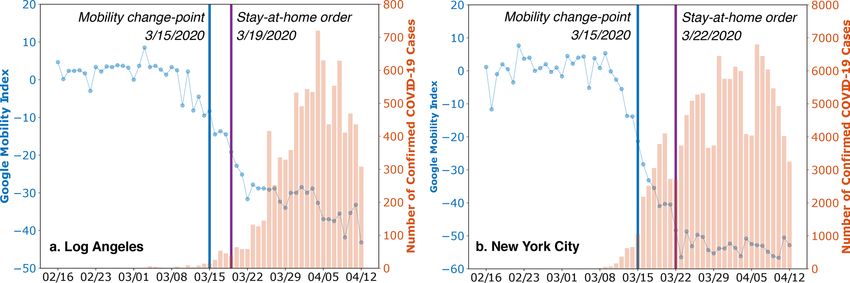
www.nature.com/scientificreports/
negative in most demographic groups (meaning the number of accidents decreases in general). However, the
share of accidents of each demographic group (i.e., the fraction of accidents among the total number of accidents
for each group) shows a different pattern in the bottom row of Fig. 2. These results highlight the unequal impact
of the pandemic on different demographic groups. To assess the robustness of the results in time, we consider
three time windows: 15 days, 30 days, and 60 days, before and after the mobility change-point (same for all
other analyses unless stated otherwise). We remove seasonal effects from the changes using the difference-in-
differences method detailed in the Methods section.
Specifically, all age groups except “70–79”, “80–89”, and “90–99” have significant reductions in daily accident
counts. The groups “20–29” and “30–39” have the largest decrease, but their shares of the accidents do not change
significantly. In fact, only the age group “10–19” has a significant (although barely) decrease of 3.2% in the share
of accidents. Overall, the pandemic does not seem to have a largely biased impact across age groups.
Regarding race, all groups experience a significant reduction in accident counts. The “Hispanic” group has
the largest decrease, but its share of accidents actually increases after a transient reduction in the first 15 days.
In comparison, the “White” group has a significant reduction in both measures.
Regarding gender, both “Male” and “Female” groups have significant reductions in the number of accidents.
However, in terms of the share of accidents, the “Male” group has increased around 4%, while the “Female” group
has decreased around 5%. In sum, the distribution of accidents has been shifting its mass towards “Hispanic”
and “Male” groups, not because the increase of their numbers of accidents but the disproportionate decrease of
accidents across the groups.
We have further attempted to assess the intersectionality between gender, race, and age. A linear regression on
gender and race and their interactions: y ∼ gender ∗ race ∗ period , where y is daily accident count and ∗ means
all interactions, is conducted. However, due to data scarcity in covering all interactions (of all factors), only
“Hispanic∗Female” witnesses a significant decrease in daily accident count ( p = 0.003) during the pandemic.
While changes of other groups are insignificant, the results agree with our findings in terms of statistical trend.
For example, we find that “Hispanic∗Male” has the largest drop, followed by “Hispanic∗Female” and “White∗
Male”, agreeing with the patterns in Fig. 2
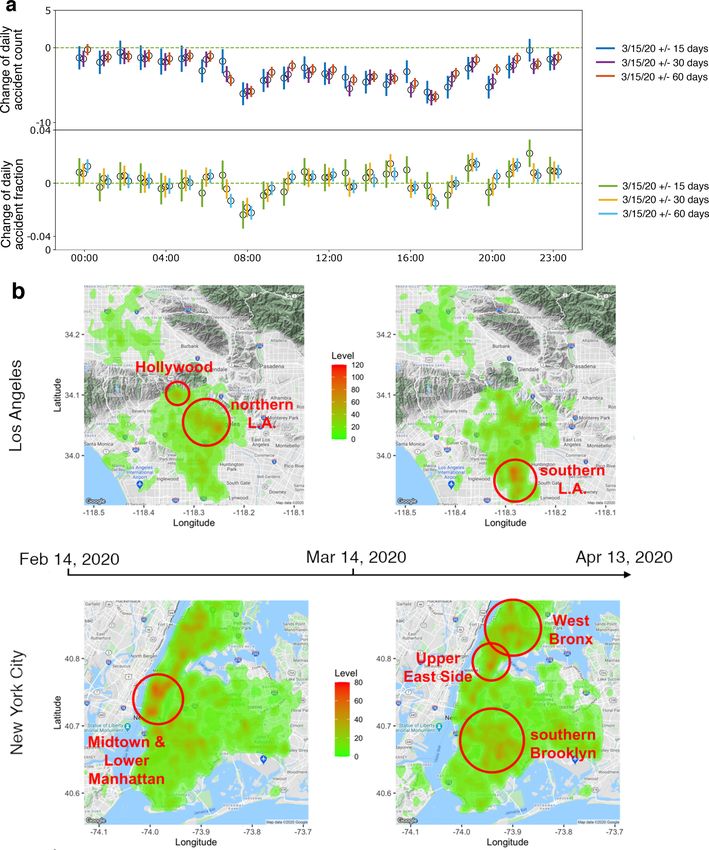
Irregularity. Figure 3a shows the change of accidents at different hours of a day. The hours between 06:00
and 22:00 have seen significant decreases in accident counts. Especially during the morning (08:00) and after-
noon (17:00) rush hours, not only the accident counts but also the shares of accidents decrease significantly. As
a result, the accidents are re-distributed throughout the day with a significant increase in share during 19:00,
demonstrating temporal irregularity.
To examine the spatial distribution of accidents during the pandemic, we perform a kernel density e stimation20
on the accident locations during the 30-day periods before and after the mobility change-point. Figure 3b shows
the heatmaps of the estimated kernel densities. There are two hot spots of traffic accidents in LA prior to the pan-
demic with as high as 80 accidents per month: one around Hollywood and the other around northern downtown
LA. After the mobility change, the hot spots have shifted to southern LA, with the number of traffic accidents
increased to more than 110 per month. In NYC, the accident hot spots are distributed around Midtown Manhat-
tan and Lower Manhattan prior to the pandemic; during the pandemic, the hot spots have shifted to Upper East
Side, West Bronx, and southern Brooklyn.
We also statistically compare the observed patterns with 2019 data to rule out any seasonal shift of accident
locations. We conduct global two-sample t ests20 on the kernel densities estimated from different time periods.
In LA, the estimated kernel density in 3/15–4/13 in 2020 is significantly different than those in the other three
periods ( p = 0.004 for 2/14–3/14 in 2020, p = 0.009 for 3/15–4/13 in 2019, and p = 0.002 for 2/13–3/14 in
2019), while the estimated kernel densities in 2/13–3/14 and 3/15–4/13 in 2019 are not statistically different
( p = 0.44). The pattern changes found in NYC are more significant: the estimated density in 3/15–4/13 in 2020
is significantly different from all the others with p-value< 0.001, and the estimated kernel densities in 2/13–3/14
and 3/15–4/13 in 2019 are not statistically different ( p = 0.11). Using both visual inspections and statistical
tests, we conclude that the shifts of accident hot spots during the pandemic are statistically significant and are
not caused by seasonal effects.
Severity. Figure 4 reports the changes in traffic accidents regarding severity levels. As severity levels are typi-
cally associated with transportation modes, we further divide the accidents into three types: (1) those not involv-
ing other transportation modes (single mode), (2) those involving pedestrians, and (3) those involving motor-
ists. We find insignificant changes in fatal accidents across all three types, while the counts of accidents with
and without injuries both drop significantly. What is notable is that the share of no-injury accidents increases
significantly after the mobility change, implying that the distribution of accidents shifts towards “light” accidents
without injuries. However, this shift appears to be reversing as we progress longer (60 days) into the pandemic.
Overall, the severity level of accidents decreases (reflected by the increase of the fraction of no-injury accidents)
during the pandemic.
Discussion
While it is as expected that the number of accidents decreases during the pandemic due to reduced mobility, we
find that this reduction occurs unequally among demographic groups. First, for groups older than 70, the changes
are insignificant, which may be due to that seniors in general travel less and hence are not impacted much by the
mobility change. Second, the shares of accidents actually increase in “Hispanic” and “Male” groups, while the
shares of other groups remain unchanged or decrease. We believe that understanding the causes of the inequality
is critical, which we defer to follow-up studies. Here we hypothesize social economic status (SES) being one of
Scientific Reports | (2021) 11:13147 | https://doi.org/10.1038/s41598-021-91392-z 3
Vol.:(0123456789)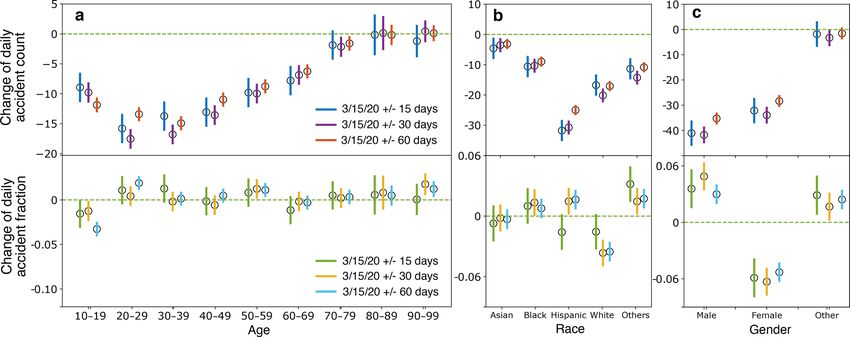
www.nature.com/scientificreports/

                                            Figure 3.  Temporal and spatial shifts of accident hot spots. (a) Change of daily accident counts (top) and
                                            fractions (bottom) grouped by different hours of a day in NYC. 95% confidence intervals are shown as vertical
                                            bars for each data point. Also shown are estimates from three time windows: 15 days (blue and green), 30 days
                                            (purple and orange), and 60 days (red and cyan) before and after the mobility change-point. (b) Heatmap of
                                            traffic accidents in LA (top) and NYC (bottom) between Feb. 14, 2020 and Apr. 13, 2020, using Mar. 15 2020 as
                                            the mobility change-point. The maps are produced by R package ggmap 3.0.0 (github.com/dkahle/ggmap) and
                                            Google Map service (cloud.google.com/maps-platform/).

          Scientific Reports |   (2021) 11:13147 |              https://doi.org/10.1038/s41598-021-91392-z                                                  4

Vol:.(1234567890)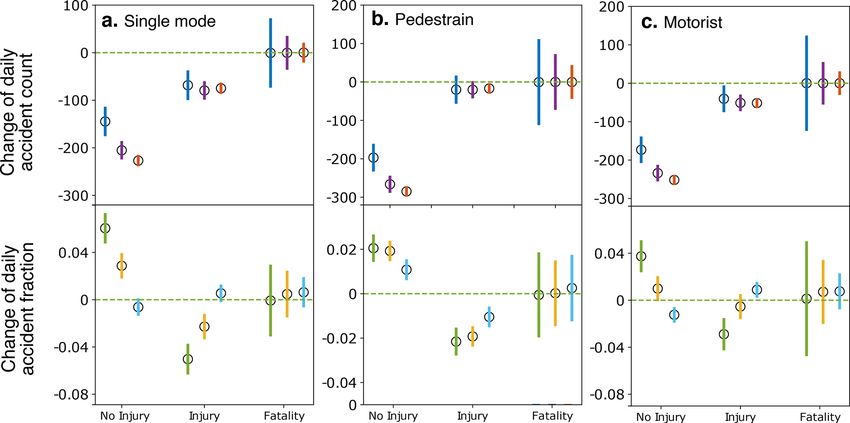
www.nature.com/scientificreports/
Figure 4. Change of daily accidents in NYC after the mobility change for different severity levels: no injury,
injury, and fatality. The accidents are divided into three types: (a) not involving other transportation modes, (b)
involving pedestrians, and (c) involving motorists. 95% confidence intervals are shown as vertical bars for each
data point. Also shown are estimates from three time windows: 15 days (blue and green), 30 days (purple and
orange), and 60 days (red and cyan) before and after the mobility change-point.
Figure 5. Median household income by tract in LA (Left) and NYC (Right). The income data is from American
Community Survey 2019, and the maps are produced by ArcGIS Online (www.arcgis.com).
the factors causing the inequality. For example, responses to social distancing are found to differ by income21.
Accordingly, different SES groups may experience different levels of mobility change. When we compare the
spatial distribution of accidents (Fig. 3b) with the map of income (Fig. 5), we find that the hot spots of accidents
have shifted from higher-income areas (e.g., Hollywood and Lower Manhattan) to lower-income areas (e.g.,
southern LA and southern Brooklyn). This may be due to that unprivileged SES groups are constrained by their
capacity to work from home, take time off of work, and live on savings22. Further studies are required to fully
understand the relationship between SES and road traffic safety.
In this study, we find that the mobility change happens a few days earlier than governments’ stay-at-home
orders at LA and NYC. This indicates public’s early response to the pandemic, agreeing with previous s tudies17,
while other studies have found a delay in the mobility adjustment2,23. This inconsistency highlights the necessity
of a data-driven approach to study road traffic safety and topics alike. Another related topic is analyzing risk and
Scientific Reports | (2021) 11:13147 | https://doi.org/10.1038/s41598-021-91392-z 5
Vol.:(0123456789)www.nature.com/scientificreports/
its relationship to disaster, vulnerability, and exposure. However, after scrutinizing many data sources, we cannot
find one covering necessary attributes for LA and NYC. So, such analysis is omitted.
Overall, our study sheds lights on many practical aspects of reducing economic and life losses due to traffic
accidents during critical conditions such as the pandemic. For example, given certain groups are experiencing
relatively more accidents, more mobility resources can be allocated to those groups. We believe our study can
provide some insights for social scientists to understand the found differences in the distribution of traffic acci-
dents and for city designers and planners to better plan land and road network uses.
Methods
Data. Multiple datasets are used in this study. The Google Community Mobility R eports19 are used to detect
mobility change-points. The dataset contains a daily mobility index that combines traffic at different regions
including retail, recreation, grocery, pharmacy, and parks. Two datasets on traffic accidents are used in examin-
ing the change of accidents before and after the mobility change: one from LA10 and the other from NYC11. Both
datasets record the time and location of accidents, which enable us to investigate the spatial-temporal patterns of
accidents. The dataset of LA also contains demographic attributes (i.e., age, race, and gender) of accident victims.
The dataset of NYC contains the severity level (i.e., no injury, injury, and fatality) and transportation modes (i.e.,
pedestrian, motorist, and no other modes) of accidents. All datasets are complete without missing data.
Mobility change point. The mobility change-point is the date when there is an abrupt, dramatic change
of the mobility flow of a large group of people (e.g., all residents in LA or NYC). There are two technical chal-
lenges in defining the mobility change-point. First, how to measure the mobility of a large group of people? And
second, how to assess the level of change since changes are perpetual? We address the first challenge using the
Google Mobility Index19. We address the second challenge using a widely-adopted technique for change-point
detection in time series18.
Formally, the problem is defined as follows: consider a non-stationary time series m = {mt }Tt=1, which may
have abrupt changes at K unknown time steps 1 < t1 < t2 < · · · < tK < T . The goal is to find these unknown
time steps via solving the following optimization program:
min V (τ ) + βK, (1)
τ
where β is the weighting factor; τ = {t1 , t2 , . . . , tK } represents the segmentation of the time series; V (τ ) is defined
as:
K
V (τ ) = c(mtk ..mtk+1 ), (2)
k=0
where c(·) is the cost function that measures the similarity of elements in a time series segment.
The mobility time series is chosen to be the Google Mobility I ndex19 and c(·) is chosen to be the radial basis
function with the default settings in the Python package ruptures18.
Difference‑in‑differences analysis. We take the difference-in-differences (DID) r egression24 to statisti-
cally test the change of traffic accidents. DID is a standard approach to control for seasonal effects when dealing
with long-term periods. For example, the difference in daily accident counts before and after March 15, 2020
could be attributed to the seasonal change from Winter to Spring. To rule out this possibility so that we can study
the effect of COVID-19 and lockdown, we compare accident data in 2019 and 2020 over the same time periods.
To be specific, each accident has two basic features: year and period. year is a categorical variable taking one
of the two values: 2019 or 2020; period is also a categorical variable taking of of the two values: before or after the
mobility change-point. As we are interested in the distribution of accidents across various demographic factors,
we consider the third feature which takes values such as age, gender, race, or severity level. We then aggregate
daily accidents for each combination of the three features and denote y the accident counts. Lastly, we construct
the following linear regression model to test the change of accidents (using gender as the third feature):
y ∼ year ∗ period ∗ gender, (3)
where ∗ denotes all possible interactions. year ∗ period ∗ gender contains not only individual variables but also their
two-way and three-way interactions, i.e., year + period + gender + year × period + · · · + year × period × gender.
Following the convention of categorical variable analysis, the independent variables are converted into dummy
variables.
The quantity of interest here is the coefficients of three-way interactions, which give the difference in daily
accident counts before and after the mobility change for different values of the third feature (e.g., gender). A
positive (negative) coefficient suggests an increase (decrease) of accidents with the value indicates the magnitude
of change. Confidence intervals are also calculated to show the statistical significance.
As the number of accidents is found to correlate with the amount of traffic and decrease after the mobility
change in general, we further investigate whether the number of accidents changes disproportionately across
all factors. This is done by replacing the dependent variable y in Eq. (3) with the daily fraction of accidents in a
group (e.g., Male). We then estimate the same regression model to get the change in accident fraction or share
of accidents for each group.
To assess the robustness of the results in time, we fit the regression models to three time windows (separately):
15 days, 30 days, and 60 days before and after the mobility change-point. This allows us to study the temporal
Scientific Reports | (2021) 11:13147 | https://doi.org/10.1038/s41598-021-91392-z 6
Vol:.(1234567890)www.nature.com/scientificreports/
evolution of the changes of accidents. For example, it is possible that the number of accidents decreases (of a
certain group) in the first 15 days after mobility change but recovers after 30 days.
Received: 18 February 2021; Accepted: 25 May 2021
References
1. Bonaccorsi, G. et al. Economic and social consequences of human mobility restrictions under covid-19. Proc. Natl. Acad. Sci. 117,
15530–15535 (2020).
2. Wang, S., Wei, K., Lin, L. & Li, W. Spatial-temporal analysis of covid-19’s impact on human mobility: The case of the United States
(2020). arXiv:2010.03707.
3. Transportation Research Board Webinar. Traffic trends and safety in a covid-19 world (2020). http://www.trb.org/ElectronicSessi
ons/Blurbs/180648.aspx. Accessed 28 Aug 2020.
4. Shilling, F. & Waetjen, D. Special report (update): Impact of covid19 mitigation on numbers and costs of California traffic crashes
(2020).
5. Brodeur, A., Cook, N. & Wright, T. On the effects of covid-19 safer-at-home policies on social distancing, car crashes and pollution
(2020).
6. National Safety Council. Motor vehicle fatality rates jump 14% in march despite quarantines (2020). https://www.nsc.org/in-the-
newsroom/motor-vehicle-fatality-rates-jump-14-in-march-despite-quarantines. Accessed 28 Aug 2020.
7. Vingilis, E. et al. Coronavirus disease 2019: What could be the effects on road safety?. Accid. Anal. Prev. 144, 105687 (2020).
8. Oguzoglu, U. Covid-19 lockdowns and decline in traffic related deaths and injuries (2020).
9. Barnes, S. R., Beland, L.-P., Huh, J. & Kim, D. The effect of covid-19 lockdown on mobility and traffic accidents: Evidence from
Louisiana. Technical Report, GLO Discussion Paper (2020).
10. Traffic collision data from 2010 to present. https://data.lacity.org/A-Safe-City/Traffi c-Collision-Data-from-2010-to-Present/d5tf-
ez2w (2020). Accessed 15 Aug 2020.
11. Motor vehicle collisions—crashes. https://data.cityofnewyork.us/Public-Safety/Motor-Vehicle-Collisions-Crashes/h9gi-nx95
(2020). Accessed 15 Aug 2020.
12. Blincoe, L., Miller, T. R., Zaloshnja, E. & Lawrence, B. A. The economic and societal impact of motor vehicle crashes, 2010 (revised).
Technical Report (2015).
13. Nižetić, S. Impact of coronavirus (covid-19) pandemic on air transport mobility, energy, and environment: A case study. Int. J.
Energy Res. 44, 10953–10961 (2020).
14. Tian, X., An, C., Chen, Z. & Tian, Z. Assessing the impact of covid-19 pandemic on urban transportation and air quality in Canada.
Sci. Total. Environ. 765, 144270 (2021).
15. Ho, S.-J., Xing, W., Wu, W. & Lee, C.-C. The impact of covid-19 on freight transport: Evidence from China. MethodsX 8, 101200
(2021).
16. Pinheiro, M. D. & Luís, N. C. Covid-19 could leverage a sustainable built environment. Sustainability 12, 5863 (2020).
17. Villas-Boas, S. B., Sears, J., Villas-Boas, M. & Villas-Boas, V. Are we# stayinghome to flatten the curve? (2020).
18. Truong, C., Oudre, L. & Vayatis, N. Selective review of offline change point detection methods. Signal Process. 167, 107299 (2020).
19. COVID-19-community mobility reports. https://www.google.com/covid19/mobility/ (2020). Accessed 15 Aug 2020.
20. Duong, T., Goud, B. & Schauer, K. Closed-form density-based framework for automatic detection of cellular morphology changes.
Proc. Natl. Acad. Sci. 109, 8382–8387 (2012).
21. Weill, J. A., Stigler, M., Deschenes, O. & Springborn, M. R. Social distancing responses to covid-19 emergency declarations strongly
differentiated by income. Proc. Natl. Acad. Sci. 117, 19658–19660. https://doi.org/10.1073/pnas.2009412117 (2020).
22. Orhun, A. Y. & Palazzolo, M. Frugality is hard to afford. J. Mark. Res. 56, 1–17. https://doi.org/10.1177/0022243718821660 (2019).
23. Ghader, S. et al. Observed mobility behavior data reveal social distancing inertia (2020) arXiv:2004.14748.
24. Mostly Harmless Econometrics (2009).
Author contributions
All authors contributed equally to this work. All authors reviewed the manuscript.
Competing interests
The authors declare no competing interests.
Additional information
Correspondence and requests for materials should be addressed to W.L.
Reprints and permissions information is available at www.nature.com/reprints.
Publisher’s note Springer Nature remains neutral with regard to jurisdictional claims in published maps and
institutional affiliations.
Open Access This article is licensed under a Creative Commons Attribution 4.0 International
License, which permits use, sharing, adaptation, distribution and reproduction in any medium or
format, as long as you give appropriate credit to the original author(s) and the source, provide a link to the
Creative Commons licence, and indicate if changes were made. The images or other third party material in this
article are included in the article’s Creative Commons licence, unless indicated otherwise in a credit line to the
material. If material is not included in the article’s Creative Commons licence and your intended use is not
permitted by statutory regulation or exceeds the permitted use, you will need to obtain permission directly from
the copyright holder. To view a copy of this licence, visit http://creativecommons.org/licenses/by/4.0/.
© The Author(s) 2021
Scientific Reports | (2021) 11:13147 | https://doi.org/10.1038/s41598-021-91392-z 7
Vol.:(0123456789)You can also read