Assessing the Early Impact of the Hardest Hit Fund on Foreclosures, Mortgage Delinquencies, and Homeownership A senior thesis presented by John ...
←
→
Page content transcription
If your browser does not render page correctly, please read the page content below
Assessing the Early Impact of the Hardest Hit Fund on

Foreclosures, Mortgage Delinquencies, and Homeownership

                A senior thesis presented by

                       John Macke

                             to

               The Department of Economics

                            and

             The Glynn Family Honors Program

                             at

               The University of Notre Dame

                   under advisement of

                 Professor James Sullivan
         .                                     .
Macke 2 Thanks to all those who supported me throughout this project. It would not have been possible without you, and I am very grateful. -JPM
Macke 3

                                           I. Introduction

       In 2007, the American housing market entered a severe crisis that saw steep declines in

house prices and skyrocketing mortgage delinquency and foreclosures rates. This crisis played a

key role in throwing the United States into a deep recession from which it is still recovering. In

response to this crisis, the Obama Administration launched the Hardest Hit Fund in 2010. The

fund would eventually provide 18 states and the District of Columbia with $7.6 billion to be

spent on foreclosure prevention programs targeted at unemployed homeowners and homeowners

that saw a large decrease in the value of their home. This program is unparalleled in US history

not only in amount spent, but also in method, as it is the only program introduced in response to

the housing crisis that includes payments to homeowners to avoid foreclosure, moving beyond

loan modifications and advisory assistance. This paper investigates the early impact of the

Hardest Hit Fund on foreclosure rates, mortgages delinquencies, and homeownership rates.

       In order to evaluate the Hardest Hit Fund, I exploit strict cutoffs in state eligibility that

resulted in hundreds of millions of dollars being given to some states while otherwise similar

states received nothing. States could qualify for the Hardest Hit Fund based on meeting any of

three criteria: a drop in house prices of over 20%, large concentrations of residents living in areas

with unemployment over 12%, and sustained unemployment above the national average. These

cutoffs were rigid: all else equal, a state with a 20.5% drop in house prices would qualify for

Hardest Hit, while a state with a 19.5% drop in house prices would not qualify and receive

nothing. 19 states qualified based on the criteria detailed above, receiving an average of

$400,000,000.

       I exploit this variation through the use of a difference-in-difference model, allowing me

to generate estimates of the impact of the Hardest Hit Fund on foreclosure rates, mortgage
Macke 4
delinquency rates, and homeownership rates. I find that the Hardest Hit Fund led to a
statistically significant 2.8 percentage point decrease in the subprime foreclosure rates in large
cities of Hardest Hit states when compared to similar non-Hardest Hit states from 2010 to 2012.
Compared to an average subprime foreclosure rate of about 22 percent nationally in 2012, this
estimate suggests that the Hardest Hit Fund decreased subprime foreclosure rates by over 10
percent over this time period. I also find suggestive evidence of a negative impact of Hardest Hit
on mortgage delinquencies over the same time period, but no evidence of any substantial effect
on homeownership.
II. Background
The housing crisis of 2007 and subsequent general financial crisis had severe and long-
lasting consequences that stretched across the global economy. While the proposed causes of the
crisis were widespread and have been widely debated, the rise in subprime lending certainly
played a central role. Subprime mortgages are those loans granted to individuals with poor credit
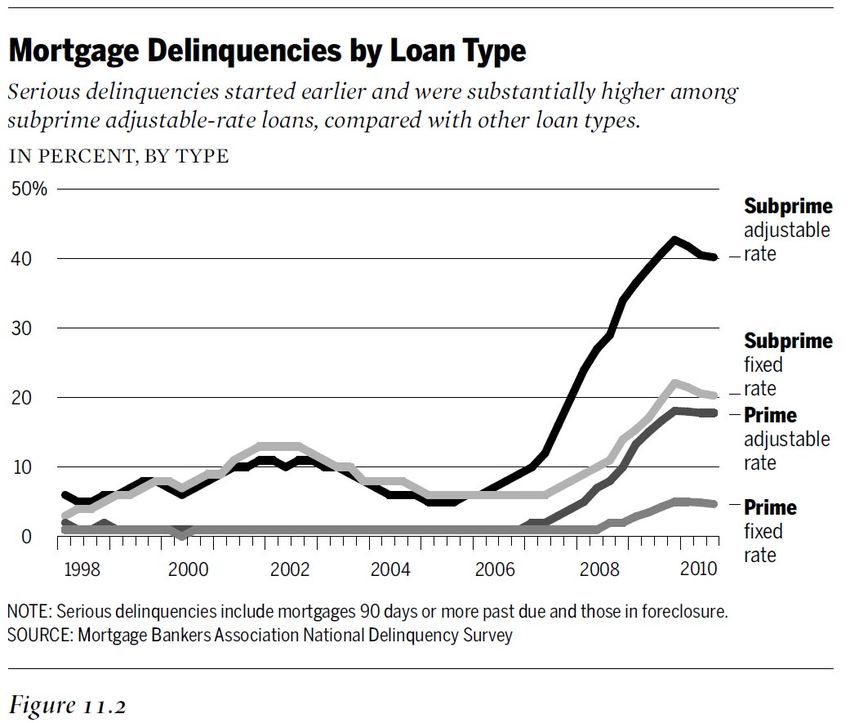
histories who would not be able to qualify for conventional mortgages. The share of mortgage
originations that were subprime rose from a historical average of approximately 8 percent form
1993 to 2003 to 20 percent from 2004 to 2006 (Joint Center for Housing Studies, 2007). As
many as 90 percent of these subprime loans were adjustable rate mortgages, or ARMs, that
started at a low interest rate and then increased to a higher rate after some number of years
(Zandi, 2010). These subprime mortgages were typically awarded to people with low credit.
They were able to afford the initial, lower interest payments, but as interest rates started to
increase, foreclosures and mortgage delinquencies skyrocketed (See Figure 1).Macke 5
Foreclosures have widespread negative effects on homeowners, lenders, and neighbors.
Homeowners lose their homes and are forced to find a new place to live. They also typically
have much lower credit than previously, which can lead to difficulty finding a job or purchasing
essential goods (Graves, 2012). Lenders also stand to lose large amounts of money if they are
forced to auction the house in a market with rapidly falling house prices, as was the case with the
most recent crisis. Beyond even these effects, however, Scheutz, Been, and Ellen (2008) show
the proximity to foreclosed homes decreases home value, even when controlling for baseline
price differentials across neighborhoods with different levels of foreclosure exposure. The
negative consequences of foreclosure to homeowners are especially dangerous for this last
reason, as foreclosures can lead to a downward spiral for entire neighborhoods leading to higher
levels of crime and instability (Stucky et al, 2012).Macke 6
Figure 1. Source: Federal Crisis Inquiry Report, page 217.
In response to rising delinquencies and foreclosures, the United States government has
enacted a variety of potential policy solutions. Most of these policy solutions offered different
methods of refinancing loans, with a focus on adjustable rate mortgages. One such program run
through the Federal Housing Administration (FHA) was the FHA-Secure program, which
allowed homeowners with non-FHA adjustable rate mortgages to refinance into an FHA
mortgage with lower interest rates. A similar refinancing plan was the “HOPE for Homeowners”
program that allowed homeowners to refinance into fixed rate mortgages, provided they agreed
to equity sharing. Another plan was the so-called “Teaser Freezer,” which locked in interestMacke 7
rates at their initial rates for a certain number of years, essentially refinancing adjustable rate
mortgages into fixed rate mortgages temporarily. There was also the FDIC “Mod in a Box” loan
modification program that set standards for loan modifications. The government also provided a
HOPE NOW support network to assist homeowners in navigating through their many options as
they faced foreclosure. For more information, see (Federal Housing Administration, 2014) and
(Federal Deposit Insurance Corporation, 2008).1
While the United States government clearly tried many approaches to address the housing
crisis, none went as far as the Hardest Hit Fund (HHF). HHF was implemented as part of the
Emergency Economic Stabilization Act of 2008 under the Troubled Asset Relief Program
(TARP), which set aside a total of $46 billion to help struggling families avoid foreclosure. First
announced in February 2010, the Hardest Hit Fund provides $7.6 billion to 18 “hardest hit”
states and the District of Columbia to “develop locally-tailored foreclosure prevention solutions”
(Department of the Treasury, 2014). The Treasury additionally notes that HHF targets families
in these areas that have been particularly affected by the crisis, and states that most HHF
programs seek to aid unemployed homeowners and homeowners with homes that are worth less
than the value of their mortgage.
The Hardest Hit Fund is so named because it targets homeowners in states hardest hit by
the housing crisis. This forms a crucial distinction between the Hardest Hit Fund and other
programs that were implement to address the housing crisis. HHF awards are given at the state
level, and they are only given to certain states, while other states receive no money. There were
3 rounds of awards for the Hardest Hit Fund, and eligibility was determined by a different
criteria each round. The first round saw 5 states declared eligible for funding on the basis of
1
Notably, each of these programs was administered to residents of all 50 states, so they do not
pose a threat to the variation I exploit in my difference-in-difference model.Macke 8
having experienced a drop in housing prices of over 20% from pre-crisis peak to trough, as
measured by the FHFA seasonally-adjusted house price index. The second round saw eligibility
extended to an additional 5 states for having a high concentration of residents living in counties
with unemployment above 12%. Finally, the third round resulted in eligibility being given to an
additional 9 states and the District of Columbia. Additionally in this third round, 8 states that
had already received money were eligible to apply for more funding. This final round of funding
was given to states that had suffered periods of sustained unemployment above the national
average in the 12 months from July 2009-June 2010. The states awarded funding in each round
are displayed in Table 1.
Table 1: States Awarded Funding in Each Round of HHF
Round 1 Round 2 Round 3
Michigan Rhode Island Michigan
Nevada South Carolina Nevada
California Oregon California
Florida North Carolina Florida
Arizona Ohio Rhode Island
South Carolina
Oregon
North Carolina
Ohio
Illinois
Kentucky
Indiana
Tennessee
Mississippi
Georgia
District of Columbia
Alabama
New Jersey
While the funding for Hardest Hit comes from the federal government, the programs to
be instituted with Hardest Hit money are designed and administered at the state level. UponMacke 9
being declared eligible based on one of the criteria above, states were required to submit
proposals for programs to address the foreclosure problems in their communities. While each
state’s programs differ slightly, they typically include mortgage payment assistance for the
unemployed, principal reduction, and payments to eliminate second lien loans. These programs
all offer ways to reduce the likelihood of foreclosure that offer direct payments to help
homeowners, unlike the previous refinancing programs that merely allowed homeowners to
change the terms of their loan.
Money disbursed through the Hardest Hit Fund was awarded to state Housing Finance
Agencies in October 2010 with the requirement that it be spent by the end of 2017. Table 2
details the amount of the funds disbursed, as well as the amount that was spent through the end
of 2011. While several states spent only a small portion of their allocations through this time
period, it is important to keep in mind that they may have guaranteed more money than had
actually been spent. For example, Nevada lists over $8,000,000 in funds “guaranteed” to
homeowners through the end of 2011.Thus, even though it had only awarded around $500,000,
Nevada had, in some sense, used over 15 times this amount. Since the Treasury does not collect
any uniform measure of how much money state guaranteed through a given time period,
however, the amount spent is the only measure available that can be compared across states.Macke 10
Table 2: Amount Allocated to and Spent by Each Hardest
Hit State through December 2011, in millions
Amount Spent
through
State Allocation December 2011
Alabama $162.52 $7.51
Arizona $267.77 $1.06
California $1,975.33 $38.63
Florida $1,057.84 $11.72
Georgia $339.26 $1.80
Illinois $445.60 $4.80
Indiana $221.69 $1.47
Kentucky $148.90 $7.00
Michigan $498.61 $5.59
Mississippi $101.89 $1.33
Nevada $194.03 $0.52
New Jersey $300.55 $0.22
North Carolina $482.78 $30.66
Ohio $570.40 $21.42
Oregon $220.04 $36.14
Rhode Island $79.35 $1.38
South Carolina $295.43 $2.46
Tennessee $217.32 $2.44
Washington, D.C. $20.70 $1.77
Total $7,600 $178
Source: State HFA reports to the US Department of the
TreasuryMacke 11
III. Literature Review
This paper fits into current strands of academic research on foreclosures and policy
solutions. Perhaps most relevantly, Gerardi and Li (2010) discuss the empirical effects of many
of the programs enacted before Hardest Hit: FHA-Secure, Mod in a Box, the “Teaser Freezer”,
the Hope Now Alliance, and HOPE for Homeowners. Looking at foreclosure rates before and
after the institution of the programs, as well as numbers of homeowners served by each program,
they conclude that these programs fell short of their stated goals and generally had fairly poor
results. This investigation was mainly descriptive, however, and lacked any comparison group to
estimate the impact of the program. In fact, there do not appear to be any rigorous evaluations of
the Hardest Hit Fund or the United States government’s previous responses to the housing crisis
of 2007.
There are, however, several relevant theoretical papers that have looked into foreclosure
solutions. Adelino, Gerardi, and Wilson (2009) offer a reason to be pessimistic about loan
modification programs. They note that lenders rarely renegotiate normally, and propose high
redefault risk as a potential reason. They argue that even after homeowners restructure their
mortgages, they may still default, leaving lenders in the same position as before they refinanced,
or perhaps an even more unfavorable position if the value of the home in question has dropped.
If redefault risk is high, then loan modification programs will only delay the inevitable.
Foote et al (2009) propose a constructive solution to foreclosures based on the
relationship between job loss and foreclosure. One common measure of mortgage affordability
is the ratio of monthly mortgage payment to gross income. They note that in markets where
unemployment is increasing rapidly, as was the case in 2008 and 2009, gross income is very
volatile. Mortgages that were once “affordable” are no longer so. Based on this observation,Macke 12
they suggest that the government “focus a program on the effects of income volatility…The
government could replace a portion of lost income for a period of 1 or 2 years.”
This investigation of the Hardest Hit Fund contributes to the existing academic literature
in several ways. It provides a first-of-its-kind evidence of the impact of a government program
to address foreclosures, using a difference-in-difference model to isolate the impact of Hardest
Hit funding on the effects of foreclosure. Moreover, it provides such an estimate for a $7.6
billion program unprecedented in magnitude and method. Additionally, since HHF programs
typically include mortgage payment assistance for the unemployed, principal reduction, and
payments to eliminate second lien loans, this investigation of HHF also tests empirically the
claims from the theoretical literature that a program that helps replace income of the unemployed
may be more effective than loan modifications.
IV. Data
I estimate several measures of the impact of the Hardest Hit Fund in this paper. In all
models, I use yearly data from the Federal Housing and Finance Administration on the state-
level FHFA seasonally adjusted House Price Index and yearly data from the Bureau of Labor
Statistics on state-level seasonally adjusted unemployment rates. In estimating the effect of the
Hardest Hit Fund on foreclosure rates and mortgage delinquency rates, the unit of observation is
a Metropolitan Statistical Area, using the 2000 Census-based PUMAs. I aggregate data from the
Urban Institute on quarterly foreclosure and delinquency rates to develop yearly foreclosure and
delinquency rates for each MSA. Unfortunately, the mortgage delinquency and foreclosure rates
are not available at the MSA-level before 2010, so the analysis is limited to years 2010-2012.Macke 13
In estimating the effect of the Hardest Hit Fund on homeownership rates, the unit of
observation is a household. To determine homeownership rates, I use data from the 2007-2012
One-Year American Community Survey (ACS), accessed via IPUMS. The one-year ACS is a
statistical survey administered by the Census Bureau of approximately 1% of the population of
the United States that serves as a yearly stand-in for the long form decennial census. I use the
“OWNERSHP” variable in ACS to determine homeownership. “OWNERSHP” refers to the
ownership of one’s dwelling. It takes the value 00 if the data is unavailable, 10 if the home is
owned or being bought by the head of household, 21 if the home is being rented without cash,
and 22 if the home is being rented with cash. In line with the official Census Bureau definition,
the homeownership rate is calculated as the number of households for which OWNERSHP=10
divided by the total number of households for which data is available.
Ideally, the ACS data could be used to provide additional controls when I estimate the
effect of Hardest Hit on foreclosure rates and mortgage delinquencies. The ability to do this
depends on the ability to link the MSAs from the Urban Institute’s foreclosure data with the
MSAs from the American Community Survey. Unfortunately, in 2012, the Census Bureau
began the transition over to new PUMAs based on the 2010 Census. While IPUMS is working
to harmonize the new MSA definitions with the old where possible, the MSA variable for the
2012 1-Year American Community Survey is currently unavailable, preventing city-level
analysis of the 2012 ACS data.
V. Methods
As described in Section II, the eligibility criteria for the Hardest Hit Fund are steep house
price drops above 20%, concentrated population in counties with unemployment above 12%, andMacke 14
sustained unemployment above the national average. These criteria provide sharp discontinuities
in funding amounts: states meet at least one of the criteria and receive funds, or states meet none
of the criteria and receive no funds. These sharp cutoffs in funding based on subtle changes in
state characteristics provide the basis for my analysis.
I estimate two difference-in-difference models to determine the impact of the Hardest Hit
Fund to this point. My main results come from estimating a model of the form
Yit = β1timet + β2 HHFi + β3 time * HHFit + β4 X it + ε it (1)
where i represents a Metropolitan Statistical Area, t represents a year (either 2010 or 2012), Yit
€
is an outcome related to foreclosures (subprime foreclosure rate, foreclosure rate, 90+ days
€
€ mortgage delinquency rate, serious delinquency rate) in city2 i and year t . timet is an
€ indicator
variable that takes the value 0 in 2010 and 1 in 2012, HHFi is an indicator variable that takes the
€ €€
value 0 if the city is in a state that did not receive Hardest Hit funds and 1 if it is in a state that
€ controls for the state FHFA seasonally-adjusted
did receive Hardest Hit funds, and the X it are
house price index and the state unemployment rate in year t and city i .
€ probability model that has essentially the same form:
I also estimate a linear
Z it = β1timet + β2 HHF€ €
i + β3 time * HHFit + β X it + ε it (2)
where the only changes are that i represents a household now, so HHFi is an indicator that takes
€
value 0 if the household is in a state that did not receive Hardest Hit funds and 1 if it is in a state
€ € takes on the value 1 if the household
that did receive Hardest Hit funds, and Z it is a dummy that
€
2
For the rest of the paper I use city and “Metropolitan Statistical Area” interchangeably. In
every case, I am referring to a Metropolitan Statistical Area as determined by the 2000 Census-
based PUMAs. Additionally, whenever I refer to “the Hardest Hit states,” Washington, D.C. is
included.Macke 15
lives in a home that the head of household owns (this includes anyone making regular mortgage
payments) and 0 otherwise.
Using cities and households from all 50 states in the sample would likely be problematic.
Since HHF states are chosen because they are thought to be the states “hardest hit” by the crisis,
it is likely that they would experience larger drops in homeownership and larger rises in
foreclosure and delinquency rates than other states in the absence of intervention. Thus, the
coefficient on β3 would be biased against showing a beneficial effect of the Hardest Hit Fund
(i.e. it would be biased positively when I estimate foreclosure and delinquency rates and
€
negatively when I estimate homeownership rates). To solve this problem, I create treatment and
comparison groups, exploiting the aforementioned sharp cutoff in funding.
In order to address this, I first sort all of the states in the US, as well as the District of
Columbia, by average unemployment rates over the period during which Hardest Hit eligibility
was determined. I form treatment and comparison groups by taking the 10 states receiving
Hardest Hit with the lowest unemployment in the July 2009 to June 2010 and the 10 states not
receiving Hardest Hit that have the highest unemployment (See Table 3). As shown in Table 1,
all of the states that received money through the Hardest Hit Fund (other than Arizona) received
funding at least partially due to “high sustained unemployment.” In fact, the 19 Hardest Hit
states were all in the top 20 states with the highest average unemployment over the period from
July 2009 to June 2010, so the states in the treatment group do have higher unemployment on
average, but it is close. I argue that the states are otherwise similar enough to form a good
comparison once the determinants of Hardest Hit selection (unemployment, house prices) are
controlled for.Macke 16
Some evidence of this comes from the similarities of the two groups with respect to
several descriptive characteristics related to housing. As Table 4 shows, heads of household in
treatment and comparison states are, on average, about the same age, nearly equally likely to be
married, have graduated high school, and have lived in the same house 1 year ago. Additionally,
they have about the same number of rooms in their house on average. There are someMacke 17 differences between the two groups with respect to descriptive characteristics as well, as racial composition and average household incomes differ somewhat, but in general the descriptive characteristics are similar.
Macke 18

       The strongest support for this model, however, comes from looking at trends in the

dependent variables before the introduction of Hardest Hit. In a difference-in-difference model,

the key trait of the two groups is not that they have similar levels of homeownership, foreclosure,

or mortgage delinquency before the Hardest Hit Fund is introduced, but that the trends in these

rates were similar. As Figure 2 shows, Hardest Hit states saw a larger drop in homeownership

rates from 2007 to 2010 than non-Hardest Hit states: while non-HHF states saw homeownership

rates drop 2.1 percentage points, HHF states saw homeownership rates drop 2.8 percentage

points, a 33% larger decrease. Once the sample is limited to the treatment and comparison states

I selected, however, the difference nearly completely disappears. Non-HHF states experience a

homeownership rate decrease of 2.3 percentage points, and HHF states have a homeownership

rate decrease of 2.4 percentage points (See Figure 3).
Macke 19
Ideally, a similar analysis could be done for foreclosure rates and mortgage delinquency
rates to identify if similar trends exist in treatment and comparison states before the introduction
of the Hardest Hit Fund. Unfortunately, as discussed in section IV, the data I use on mortgage
delinquencies and foreclosures is unavailable before 2010, Nonetheless, the similar descriptive
characteristics of the two groups and the similar trends in homeownership provide some support
for this difference-in-difference identification strategy.
One criticism of limiting the sample to this smaller set of states would be that it limits the
ability to determine the universal applicability of the results. Even if Hardest Hit were to be
successful, if the 20 states used in the model proved to be significantly different from the rest of
the country in some way, then the generalizability of these results would be limited. Fortunately,
this is not the case. As Appendix Table 1 shows, the states used in the model are quite similar to
the rest of the country with respect to a variety of descriptive characteristics, including food
stamp receipt, percentage of residents with a high school diploma, and household income.Macke 20
In my main estimates of the effect of Hardest Hit on subprime foreclosure rates,
foreclosure rates, 90+ days mortgage delinquency rates, and serious delinquency rates, I also
restrict the sample to large cities. As Figure 4 shows, people living in counties with higher
populations (i.e. above 250,000 or 500,000 people) are more likely to receive assistance through
the Hardest Hit Fund than people living in less populated cities. For this reason, I focus on
metropolitan statistical areas with populations of over 500,000 in my main specification. The
choice of 500,000 is somewhat arbitrary, but I settled on that number because it is large enough
to capture only substantial cities while small enough to not limit the sample excessively. I test
this restriction by examining the results of the same regression for all cities with population at
least 250,000 and all cities regardless of population.
One issue with using cities as a unit of observation in a state-level analysis is how to
handle cities that stretch across multiple states. I handle the problem in the following way. In the
main specification, I omit all cities that stretch across the border of multiple states. In aMacke 21
secondary specification, I include cities that stretch into any of the 10 treatment states as cities
with HHFi = 1. Cities that stretch into no treatment states but at least one of the 10 comparison
states are included with HHFi = 0 .
€
In addition to my main results, I also present estimates of the effect of the Hardest Hit
€
Fund on homeownership rates, using household-level data from the American Community
Survey. In generating these estimates, I cannot restrict the sample to large cities, due to the
absence of the MSA variable in 2012. I am able to limit the analysis to one subset of the
population that was more likely to benefit from Hardest Hit, however: low-income households.
Thus, I estimate equation (2) with 3 different restrictions on the sample: first with all households,
regardless of annual gross income, second limited to households with annual gross income under
$100,000, and third limited to households with annual gross income under $50,000.
VI. Results
A. Foreclosure and Delinquency Rates
The results for my estimates of the effect of Hardest Hit on subprime foreclosure rates,
foreclosure rates, 90+ days delinquency rates, and serious delinquency rates are shown in Table
3. As discussed in the methods section, these results come from estimating equation (1) with a
sample that includes cities from 10 treatment states and 10 comparison states, chosen for their
proximity to the eligibility threshold. Border cities are omitted and only cities with at least
500,000 people are included. Standard errors are clustered by state in all cases.
Row 1 of Table 5 shows the estimated impact of Hardest Hit assistance on subprime
foreclosure rates, foreclosure rates, 90+ day mortgage delinquency rates, and serious mortgage
delinquency rates. When the determinants of Hardest Hit selection are not included as controls,Macke 22
the receipt of Hardest Hit assistance shows up as having a significantly negative impact on
foreclosure and delinquency rates. That is, Hardest Hit assistance slowed the rise of foreclosure
and delinquency rates significantly. When controls are added to the model, the effect of Hardest
Hit decreases in magnitude across all foreclosure and delinquency rates. It is still negative in all
cases, however, and the effect on subprime foreclosure rates is significantly negative. The
coefficient on the interaction term suggests that the introduction of Hardest Hit Fund decreased
subprime foreclosure rates by 2.78 percentage points compared to what would have been
expected in absence of HHF. Compare to a national average subprime foreclosure rate of about
22 percent in 2012, this represents almost a 10 percent decrease. The coefficient on state level
unemployment is miniscule and magnitude and not significant, suggesting that state
unemployment rates have little impact on foreclosure and delinquency rates. The coefficient on
the house price index does enter significantly in several of the regressions, but its magnitude is
also very small—the model suggests a 10 point increase in house price index would lead only to
a .8 percentage point increase in the subprime foreclosure rate. The impact the other dependent
variables is even smaller.
In order to examine the robustness of this result, I also estimate a number of slightly
differently specified versions of the main model. The estimates of the interaction term ( β3 ) are
shown in Table 6. The first change in specification is tests the importance of the number of
states included in the treatment and control groups. First I remove 5 states on €
each side of the
eligibility cutoff, including only the 5 Hardest Hit states with the lowest unemployment and the 5
non-Hardest Hit states with the highest unemployment. When I do this, the magnitude on each
of the coefficients changes very little, but the standard errors increase due to the smaller sample
size, so the estimated effect on subprime foreclosures is no longer significantly different from 0,Macke 23
Macke 24

even though it moves to 3.1 percentage point decrease. Secondly, I add 5 states on each side,

including the 15 Hardest Hit states with the lowest unemployment and the 15 non-Hardest Hit

states with the highest unemployment. Upon this change, none of the estimated effects of the

Hardest Hit Fund are significantly different from 0, and three of them change sign. This is likely

due to the fact that the 5 states added on each side are quite different from each other; I add 5

high unemployment states on the treatment side and 5 low unemployment states on the

comparison side. Even controlling for unemployment and house prices, these states may be too

different. Specifically, the Hardest Hit states may have suffered more seriously the effects of the

crisis, leading to greater increases in foreclosure and delinquency rates and positively biasing the

coefficients on the interaction term.

       I then investigate the inclusion of smaller cities. As discussed in the section V, I initially

limit the sample to cities with over 500,000 residents. I do this because residents of more

heavily populated counties have been helped by the Hardest Hit Fund at higher rates than

residents of other counties. In order to examine the effect on a larger scale, I first include all

cities over 250,000 people. I then extend the sample to include cities of all populations. The

effects of the two expansions of the sample are similar. The magnitude of the coefficient on the

interaction term decreases slightly and is no longer significantly different than 0, although it

remains negative. This is likely due to the fact that the effect of Hardest Hit Fund receipt on

foreclosure and delinquency rates for many households outside of large cities is small—many

people are neither not in need of such assistance or not eligible (See Figure 4). When cities with

very few people receiving Hardest Hit are included, the effect is even more muted and hard to

detect. Finally, I estimate the model including border states in the sample, as discussed in

section V. The inclusion of border states has nearly no effect on the coefficients of interest.
Macke 25
B. Homeownership Rates
The results of the estimation of equation (2) are displayed in Table 7. I consider three
samples: all households, households with under $100,000 in gross yearly income, and
households with under $50,000 in gross yearly income. When controls for state house price
index and state unemployment are not included, interestingly, the coefficients are negative,
implying that Hardest Hit has negative effect on homeownership rates. The coefficients on the
interaction term are small, however, (under 1 percentage point), but significant due to the large
sample size and correspondingly small standard error. When controls are added, the magnitude
gets even smaller, and the effect is not significant for households with under $100,000 in income.
Given that changes in homeownership rates are a lagging effect of reductions or increases in
foreclosures, it is unsurprising that there would be no major effect of the Hardest Hit Fund on
homeownership rates at this stage in the disbursement of funds.
The lack of disbursement of funds through Hardest Hit is one limitation of analyzing its
success at this point. Since states have until 2017 to spend funds, many states had only spent a
small fraction of their total funds by the end of 2011. Because of this, the effects of Hardest Hit
are likely to be small at this point, making them somewhat hard to detect statistically. Another
limitation of this study is the lack of MSA-level data for 2012 due to the discrepancy in MSA
definitions described in section IV. This lack of data precludes the use of stronger MSA-level
demographic controls in the city-level model. Future research should address this, however,
because each of these problems will be solved in time; more funds are being dispersed each day,
and MSA-level data for the 2012 ACS will be available within the year. This model can easily
be adapted and improved by making these changes when possible.Macke 26
Macke 27
Macke 28

VII. Conclusion

       This paper addresses the early impact of the Hardest Hit Fund, a government program

that saw over $7.5 billion dollars allocated to 18 states and the District of Columbia in order to

prevent foreclosures. I estimate a difference-in-difference model controlling for the determinants

of selection and find that the fund decreased subprime foreclosure rates by 2.8 percentage points

from 2010 to 2012 in large cities of Hardest Hit states when compared to large cities in similar

non-Hardest Hit states. Additionally, I find some evidence that the Hardest Hit fund decreased

overall foreclosure rates, 90+ days mortgage delinquency rates, and serious delinquency rates,

although the estimated effects are not statistically significant when state house prices and

unemployment levels are controlled for. I do not find any evidence that the Hardest Hit fund has

increased homeownership rates; my estimates suggest that Hardest Hit had essentially no effect

on homeownership from 2010 to 2012.

       This paper is novel in approach in that it is the first paper to generate an estimate of the

true impact of the Hardest Hit Fund using a control group, and its findings suggest moderate

success thus far, in spite of slow implementation. It lays out a model for exploiting cutoffs in

funding eligibility that could easily be adapted to evaluate the Hardest Hit Fund 3, 5, or 7 years

down the road, when more funds have been spent. With the findings as they are now, this paper

provides suggestive evidence that the Hardest Hit Fund has achieved its state goal of decreasing

foreclosures, demonstrating that government interventions can have a significant impact in the

housing market, especially when they are on the scale of Hardest Hit.
Macke 29
References

Adelino, Manuel Kristopher Gerardi, and Paul S. Willen. “Why Don't Lenders Renegotiate

       More Home Mortgages? Redefaults, Self-Cures, and Securitization.” 2009. Public

       Policy Discussion Paper No. 09-4.

Department of the Treasury. “Hardest Hit Fund: Archived Program Information”

       http://www.treasury.gov/initiatives/financial-stability/TARP-

       Programs/housing/hhf/Pages/Archival-information.aspx?Program=Hardest+Hit+Fund.

       2014.

Federal Crisis Inquiry Report. 2011. Accessed at http://fcic-

       static.law.stanford.edu/cdn_media/fcic-reports/fcic_final_report_full.pdf

Federal Deposit Insurance Corporation. “FDIC Announces Availability of IndyMac Loan

       Modification”. http://www.fdic.gov/news/news/press/2008/pr08121.html. November 20,

       2008.

Federal Housing and Finance Administration. “FHA Secure Refinancing”.

       http://www.fha.com/fha_secure. 2008.

Foote, Christopher et al. “Reducing Foreclosures: No Easy Answers.” 2010. National Bureau

       of Economic Research.

Gerardi, Kristopher and Wenli Li. "Mortgage Foreclosure Prevention Efforts". 2010. FRB

       Atlanta Economic Review, 95(2).

Graves Jr, Earl. "Your Credit Score is Your GPA for Life." Black Enterprise, 43.3 (2012): 12.

Joint Center for Housing Studies. “The State of the Nation’s Housing: 2008”. Harvard

       University, 2008.
Macke 31
Schuetz, Jenny and Been, Vicki and Ellen, Ingrid Gould, Neighborhood Effects of Concentrated
Mortgage Foreclosures (September 18, 2008). NYU Law and Economics Research Paper
No. 08-41.
Stucky, Thomas, John Ottensmann, and Seth B. Payton. Indiana University-Purdue University
Indianapolis "The Effect of Foreclosures on Crime in Indianapolis, 2003-2008*." Social
Science Quarterly (Wiley-Blackwell), 93.3 (2012): 602-624.
Zandi, Mark. Financial Shock. FT Press, 2010.You can also read