Assessment of Far North New Zealand Coastal Marine Debris, Using the Sustainable Coastlines' Citizen Science, Beach Survey Protocol - Gabrielle Johns
←
→
Page content transcription
If your browser does not render page correctly, please read the page content below
Assessment of Far North New Zealand Coastal
    Marine Debris, Using the Sustainable
  Coastlines’ Citizen Science, Beach Survey
                   Protocol.

                     Gabrielle Johns

                                              Tapotupotu Beach

                        April 2019

                  University of Auckland

          DOC Summer Science Scholarship ID 1159

                                                                 1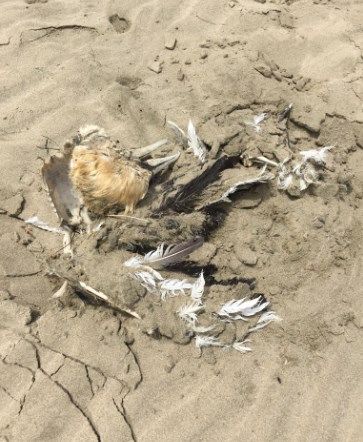
2
ABSTRACT

Marine debris is litter released either intentionally or unintentionally into marine environments by humans
(Araujo & Costa, 2019). The type and amount of debris varies between locations and is influenced by beach
morphology, local tidal regime, proximity to human population, local use and debris origin (Wessel et al.,
2019). Marine debris poses hazard to marine organisms via ingestion and entanglement (Panti et al., 2019).
Citizen science projects can help remove debris from beaches and contribute towards monitoring in an
inclusive, environmentally mindful, collaborative way, while providing data to assist in determining local to
global status of marine debris (Panti et al., 2019). This project assessed: (1) the type, colour, size, origin and
quantity of marine debris on Far North, New Zealand beaches; (2) the type of debris ingested by sea birds
compared to debris accumulated on the shoreline; and (3) the effectiveness of the Sustainable Coastlines
protocol and data sheet for debris data collection in fieldwork and analyses.

Debris was collected within 20 m x 100 m transects along beach high tide marks. Debris items were
categorised, counted and weighed; and inputted into the Sustainable Coastlines datasheet and app for
analysis. The Sustainable Seas protocol was easy to implement and patterns in debris were simple to interpret
and provide information that is applicable to scientists, government and general public alike. In total 730
debris pieces were collected, weighing 2,383 g. Of these items 80% of debris posed a risk to marine organisms
through entanglement or ingestion. Cigarette butts, which comprised 25% of marine debris collected over the
survey period, were the most common debris item. Blue coloured plastic debris was most common material
type; totalling 30% of all debris collected, posing the greatest ingestion risk to marine organisms. Significantly
more debris was collected after New Year’s Day; 4x more debris was collected on Taipa and Ahipara Beaches
after New Year’s than before New Year’s, while 2x more debris was collected on Matai Bay and Waipapakauri
Beaches after New Years. Although there was little difference in the type of debris accumulated between East
or West coast beaches; biotic effects such as visitors, and abiotic effects such as wind and ocean currents,
were likely to cause variability in the types of debris accumulated on different beaches. Beaches with more
debris had more visitors and more influential wind and ocean currents.

                                                                                                                     3
INTRODUCTION

The ocean is an interconnected expanse of water constituting up to 70% of the globe’s surface area. Effects
such as wind, ocean currents and human visitation which act on this environment make coastlines a common
collection point for marine debris (Araujo & Costa, 2019). Marine debris is anthropogenic litter released with
or without intent into marine environments (Araujo & Costa, 2019). This debris varies in type and weight
between locations due to variability in regional populations, wind and ocean currents (Wessel et al., 2019).
Marine debris poses risk to marine mammals, such as dolphins, whales and seals; and seabirds such as shags,
gannets, and gulls, through ingestion and entanglement (Panti et al., 2019). Entanglement may cause injury,
drowning or strangulation; while ingestion may result in poisoning, blocked digestive tracts, suffocation and
starvation (Araujo & Costa, 2019; Panti et al., 2019). Mitigation and reduction of marine debris relies upon
understanding marine environments and debris accumulation potential, to promote removal initiatives. For
this, Citizen Science initiatives are a candid solution.

Citizen science initiatives observe and obtain data about marine debris in an inclusive, thoughtful and
communicative way, thus incentivising positive marine behaviours (Panti et al., 2019). Tactile exposure to
debris raises awareness of the state of marine environments, while data collection assists in marine debris
quantification at local to global scales (Panti et al., 2019). Citizen science data may improve understanding of
types and densities of marine debris and its accumulation in relation to population densities, ocean currents
and wind patterns (Kataoka, Murray & Isobe, 2018). This type of data provides cost estimates and possible
solutions for marine debris reduction and mitigation, through improved understanding of marine debris
accumulation timescales and origins (Kataoka, Murray & Isobe, 2018).

The aims of this project were (1) to assess different aspects of the marine debris in the Far North of New
Zealand/Aoteroa in terms of type, colour, size, origin and quantity; (2) collect spectral data for later use in
assessment of whether debris in sea birds is proportionally similar to shoreline debris; and (3) determine if the
provided Sustainable Coastlines protocol and data sheet were effective in data collection, in the field and for
analysis.

METHOD

A standardised method was used for marine debris surveys to ensure the consistent collection of data. On first
arrival beach environments were observed for visible debris, with most recent high tide line located. Seven
beaches were surveyed. Each beach had one transect completed per visit (Appendix A). Over the summer
period Taipa Beach was visited nine times, Matai Bay was visited eight times, Waipapkauri Beach was visited
ten times and Ahipara Beach was visited nine times; Rarawa beach was surveyed once, while Spirits Bay and
Tapotupotu Beach were surveyed twice over two consecutive days.

Ahipara Beach is a West Coast, south west facing beach, with straight coastal geography and an estuary at the
middle of the beach. This beach has a small coastal community and frequent human visitation. Taipa Beach is
an East Coast, north facing beach; with cove shaped coastal geography and cliffs jutting into the bay at either
end. Taipa Beach has many access points by car and foot, with a road that runs parallel to the beach, and a
boat ramp located at the east end of the beach, where an estuary flows; providing frequent human visitation.
Waipapakauri Beach is a West Coast, west facing beach, with straight coastal geography. This beach
experiences frequent human exposure and is located 20 minutes from Kaitaia. Matai Bay Beach is an east
facing, East Coast, cove beach, at the end of Karikari peninsular. Matai Beach is 40 minutes from the main
highway and accessible by foot from the Matai Bay motor camp car park, thus this beach experiences less
human visitation. Rarawa Beach is an East Coast, north-east facing beach; with straight coastline and cliffs at
either end of the beach. An estuary flows to the sea at the middle of the beach. This beach is expected to be
less frequented by the public as it is 45 minutes from Kaitaia, and less famous and accessible than the
preferentially visited Ninety-mile beach. Spirits Bay Beach is an East Coast, north to north-east facing beach;
with a straight coastline and cliffs at either end. An estuary flows at the east end. Access to this beach is
possible by car, driving 20 km from State Highway 1, on a gravel road. Low frequency human visitation is
expected due to inaccessibility. Tapotupotu Beach is an East coast, north facing beach; with cove shaped
coastal geography. High frequency human exposure is likely due to its location 5 minutes from Cape Reinga.

                                                                                                                   4
Transects spanned 10 m either side of the high tide line and 100 m along the most recent high tide line.
Transect area was indicated with stakes, then traversed in an S shape from end to end until all marine debris
within the transects was manually collected and stored in containers; and re-walked to ensure all debris was
collected.
Debris items were sifted to remove items less than 5 mm and sorted into one of nine material classes, then
identified as one of 102 debris types. Debris types were sorted into white ice cream containers to record the
number and cumulative weight of items for each debris type. Hard unidentifiable plastic debris items were
then sorted into colours for colour spectrum analysis and counted to find which colours were most often
present on the shoreline. Remaining debris was discarded into rubbish bins. Data from each transect were
recorded using the Sustainable Coastlines’ Citizen Science Platform app (Appendix B), which may be found at
http://sustainablecoastlines.org/litterproject/; beginning with beach location, date, survey duration,
participants and site features. Colour spectrum analysis is not included in the Sustainable Coastlines App and
was recorded in Microsoft Excel.
Statistical data analysis was necessary to reveal patterns and relationships between data variables.
Comparisons were made between the total number of marine debris items collected and their weights.
ANOVAs with post hoc Tukey tests were used to test the relationship between marine debris items collected,
over time at Matai Bay, Taipa Beach, Waipapakauri Beach and Ahipara Beach; with further comparisons made
in individual beach debris collection trends over time. ANOVAs and Post hoc Tukey tests were used to assess
differing effects acting on beaches with different locations, and the number and weight of marine debris items
collected at four frequently surveyed beaches. A Chi squared goodness of fit test was used to indicate the
frequency of incidence of each plastic colour collected in all of the plastic marine debris collected. The top five
debris types collected at the four most surveyed beaches were analysed and pie charts created to indicate
variation in debris type and proportion on beaches experiencing different human visitation, wind and ocean
currents.
RESULTS
Over the period of December 2018 to February 2019, 41 beach surveys were conducted (Appendix B). In total,
46 debris types were found on beaches surveyed in the Far North of New Zealand/Aotearoa, totalling 730
individual items, with a combined weight of 2,383 grams (Figures 1 and 2). Sixty-three percent of marine debris
types, and 80% of individual marine debris pieces risk entanglement or ingestion to marine life (Figure 1).
5Figure 1. For each marine debris type, the number of items collected from 41 transects on Far North, New
Zealand/Aotearoa beaches, between December 2018 and February 2019; debris posing a risk to marine
organisms through ingestion or entanglement are indicated in red.
Figure 2. The combined weight for each of the 46 types of marine debris collected from 41 transects on Far
North beaches in New Zealand/Aotearoa between December 2018 and February 2019.
There was a significant difference between the number of debris items collected in transects on Waipapahauri
Beach and Matai Bay (total pieces: df=2, F = 4.697, p = 0.015). No significant difference in debris weight was
observed between Ahipara Beach, Waipapkauri Beach, Taipa Beach and Matai Bay Beach (df=2, F=0.069,
p=0.934). Post-hoc tests indicate that there was significantly more pieces of rubbish directly after New Years
than before (p = 0.038), but there was no difference in debris pieces collected before New Years and 2 weeks
after New Years (0.949) (Figure 3).
(a) (b)
(c) (d)
Figure 3. Marine debris collected per survey over December 2018 to February 2019 on (a) Ahipara Beach; (b)
Waipapakauri Beach; (c) Taipa Beach; (d) Matai Bay Beach. Red lines indicate New Year’s Day and the end of
the school holidays for primary schools.
6There was no difference in the debris counts at East, West, or North facing beaches (pieces: df=2, F = 2.654, p
= 0.84; weight df =2, F = 0.222, p = 0.802). There was significant difference in the number of pieces collected
between all transects on Ahipara Beach, Waipapakauri Beach, Taipa Beach and Matai Bay (df = 2, F =3.602, p =
0.01) with 4 times more debris items in Waipapkauri Beach transects than Matai Bay transects (p = 0.008)
(Figure 4).
(a) (b)
Figure 4. Average marine debris items collected per transect (a), and average weight (b) on Ahipara Beach,
Waipapakauri Beach, Taipa Beach and Matai Beach from December 2018 to February 2019.
A significant difference was observed in the prevalence of different colours of unidentifiable hard plastic debris
(Chi-squared test: df=10, chi-squ = 187.69, p < 0.05). Blue was the most common colour (31%), followed by
white (22%) and green plastic fragments (19%) (Figure 5).
Figure 5. The total number and colour of unidentifiable hard plastic pieces, collected on Far North New
Zealand/Aotearoa beaches over December 2018 to February 2019.
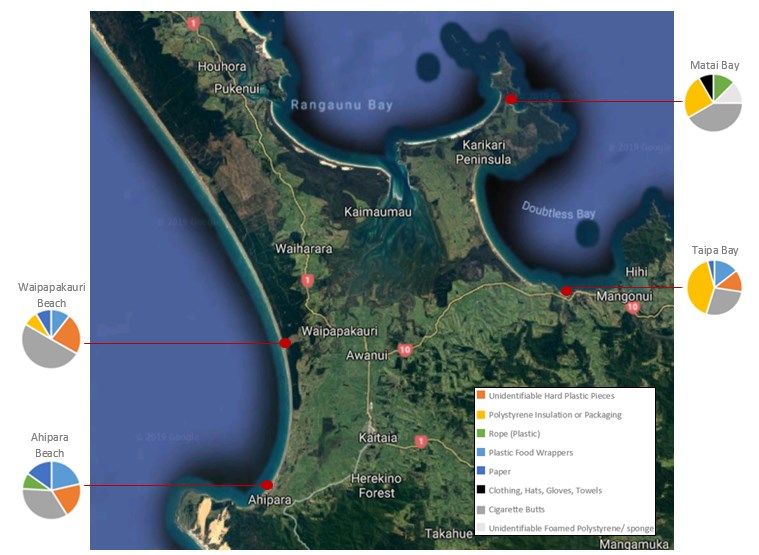
Common marine debris types, were similar across the four most frequently visited Far North beaches. The
greatest variation in debris types was observed between Matai Bay and Waipapakauri Beach (Figure 6).
7Figure 6. Far North beach marine debris transect locations and the proportion of the five most common marine
debris items collected per beach between December 2018 and February 2019.
DISCUSSION
MARINE DEBRIS TYPE AND QUANTITY
Similar debris items were present on all beaches, with plastic as the most prevalent material. The most
common debris items were cigarettes, unidentifiable hard plastic pieces and plastic food wrappers. Cigarette
butts accounted for 25% of the number of debris items collected; and 1% of total weight. The second and third
most common debris were unidentifiable hard plastic pieces and plastic food wrappers. Unidentifiable hard
plastic pieces accounted for 18% of the number of debris items collected and 9% of weight. Plastic food
wrappers accounted for 9% of the number of debris items collected and 3% of weight. Each of these debris
types were common in their negligible weight, allowing for easier transportation; and thus were more
widespread (Araujo & Costa, 2019; Panti et al., 2019). This result in debris collection is consistent with previous
research that has found cigarettes to be the most frequent debris item on beaches worldwide and plastic to be
the most documented marine debris material worldwide (Araujo & Costa, 2019; Wessel et al., 2019). Thus the
debris collected on the beaches of Far North, New Zealand/Aotearoa were comparable in marine debris
collections worldwide.
Anthropogenic debris is present in many marine locations, originating from a multitude of sources and cycling
through various pathways before deposition on beaches (Ryan, Moore, Franeker, & Moloney, 2009; Araujo &
Costa, 2019). Variations in effects acting on marine environments alters temporal and spatial distributions of
debris (Ryan et al., 2009; Araujo & Costa, 2019). Thus, establishing marine debris origins are challenging
(Williams et al., 2016; Panti et al., 2019). Marine debris is either left on beaches directly from human
recreation as primary source debris, or redeposited by wind and marine currents as secondary source debris
(Araujo & Costa, 2019).
8Primarily sourced debris density and distribution varies in response to local human population density
(Williams et al., 2016; Araujo & Costa, 2019). Far North marine debris density varied in response to changes in
local population, with more debris deposited between the New Year and the end of school holiday period. This
pattern is especially evident on Waipapakauri and Ahipara beach, which both feature increased debris
accumulation over this busier period. All beaches were observed to have substantially more marine debris
following New Year’s Day, suggesting a positive correlation between human visitation rates and marine debris
accumulation (i.e. debris released by humans on beaches or nearby during coastal activities). Secondarily
sourced debris are backwashed onto beaches with abiotic effects such as wind and ocean currents in
conjunction with coastal geography influencing their deposition rates (Williams et al., 2016; Kataoka, Murray &
Isobe, 2018; Panti et al., 2019); thus beaches with more similar marine debris types and weights are likely to
have similar coastal geographies, mimicking effects acting on debris.
A significant difference in accumulated marine debris was observed between Waipapkauri Beach and Matai
Bay. This was likely a result of differing landscape features and frequency of human exposure between
beaches, causing variation in debris type accumulation (Williams et al., 2016; Araujo & Costa, 2019).
Waipapkauri is frequented by the public and is easily accessible by car with a coast side community. Matai Bay
however is an isolated beach, accessible only by foot from a local camping ground. Thus primary debris source
deposition is less likely on Matai Beach than Waipapakauri Beach due to lower human visitation rates.
Waipapakauri beach is an open coastline. Similar to results from Williams et al. (2016) this beach, when
compared to others in this study, has high rates of debris deposition of mostly lightweight debris. Taipa and
Ahipara beaches have estuary outflows and asymmetrical cove like formations at one end. These beaches
reside in the mid-range for the number of marine debris items counted over the study period but have the
greatest cumulative weight. Williams et al. (2016), identified that locations such as Taipa and Ahipara beaches
had higher debris accumulation rates resulting from a combination of primary and secondary sourced debris
due to beach accessibility and coastal geography. Matai Bay collected the least but heaviest debris items.
Williams et al. (2016) identified that sheltered sites, such as Matai Bay, accumulate debris associated with
industrial and commercial uses. Industrial debris deposition relies on the presence of industry, however Matai
Bay has limited industrial exposure; explaining the low debris counts at this site.
Williams et al. (2016) found that, exposed beaches with open coastlines have more primary sourced debris;
sheltered bay locations with rivers or creeks have more waterborne, secondary sourced debris from industrial
sources. Heavier debris is more likely to have originated from the land and remains in situ, with a low transfer
potential, especially on sheltered beaches. Less sheltered locations typically have high rates of debris
transportation causing higher turnover rates of lightweight secondary sourced marine debris items, and thus
more debris collected over time. The features determining marine debris number and weight, identified by
Williams et al. (2016), are similar to debris accumulation patterns observed on Far North beaches of New
Zealand/Aotearoa.
BIRD ENTANGLEMENT AND INGESTION
Forty-six different types of marine debris were collected over the period between December and February of
2018/19 in Far North New Zealand. In total, 63% of these debris types were likely to harm marine organisms
via entanglement or ingestion, with 80% of the individual marine debris pieces collected over the survey
period contributing to this risk. Plastic is the most common marine debris and is the greatest concern to the
health and well-being of marine life, due to the high rates of entanglement and ingestion of this particular
material in wildlife (Panti et al., 2019).
Blue coloured plastic debris was most common in this study, followed by white and green. This result is
contrary to several worldwide studies in which white plastic is the most common debris present and ingested
by avifauna (Verlis et al., 2013; Lavers et al., 2014; Li et al., 2018). In Qinzhou Bay, China, white is the most
common debris colour encompassing 98% of marine debris, while blue debris is the least common (Li et al.,
2018). The variation in the most common colour of plastic marine debris suggests that the land use and
populations surrounding marine environments contribute to debris variation; this would be expected due to
different populations demanding the existence and eventual disposal of specific plastic products.
9Understanding the correlation between the origin, accumulation and risk of debris to marine environments
and organisms may facilitate mitigation and removal of debris to improve and conserve existing marine
ecosystems.
One deceased gannet was discovered, during a marine debris survey on Waipapakauri Beach, decomposed and
entangled in plastic fishing line (Appendix C). As a result, this bird could not be necropsied to determine
ingested plastic debris colours. On the Great Barrier Reef of Australia, the most commonly ingested plastic
fragments were white, followed by green, proving some degree of colour preference; however this study did
not measure the proportions of debris in the environment (Verlis et al., 2013); thus debris ingestion could not
be concluded to be a result of either organism selection by colour preference or random ingestion due to
presence in the environment. Plastic ingestion depends on encounter rate, whereby patterns of ingestion
could result from plastic presence rather than preference (Roman et al., 2019). Roman et al. (2019) suggest the
probability of marine debris ingestion was predictable by individual foraging strategy, where hard plastics were
consumed most often by those with crustacean dominant diets and least in those with fish diets.
SUSTAINABLE COASTLINES PROTOCOL
The Sustainable Coastlines protocol and data sheet were effective in the field and for analyses. In the field the
Sustainable Coastlines protocol was simple and easy to repeat across a range of beaches, providing
comparable data regardless of beach variability. Once familiar with the datasheet, debris categories were easy
to identify during beach surveys. Individuals that assisted in marine debris collection surveys carried out the
task with ease, simultaneously gaining the skills to carry out future surveys. Data analysis was simple, with
fixed categories on the Sustainable Coastlines datasheet replicated in the application software tool. Data
output from the Sustainable Coastlines App provided a list of prevalent debris types and weights from the
analysis of individual beaches.
The Sustainable Coastlines Protocol uses citizen science to clean beaches and collect data about the
environment for conservation. Participants inadvertently act to induce cultural change in regard to reduction
of marine debris deposition and clean up through gaining an education about debris patterns and sources
(Williams et al., 2016). Beach clean-up data from citizen science initiatives, such as the Sustainable Coastlines
Protocol, may provide insight into the correlation between human population, wind and ocean current effects
on marine debris accumulation rates, types, and their origins (Ryan et al., 2009, Kataoka, Murray & Isobe,
2018). Such data may contribute to greater understanding of local environments for conservation and more
effective methods for beach clean-ups in the future.
CONCLUSION
The Sustainable Coastlines protocol and data sheet were useful in the collection and quantification of marine
debris on Far North beaches. Often, common debris items were lightweight and thus the number of items
collected could not be compared to their weight in the total proportion of debris collected, using the
Sustainable Coastlines App, in transects over the summer of 2018. The most common marine debris collected
were made of plastics, and the top three most common single debris items were cigarette butts, unidentifiable
hard plastic pieces and plastic food wrappers. Of the marine debris collected, 80% was likely to cause harm to
marine life through either ingestion or entanglement. Debris origin was difficult to pinpoint via observation of
accumulation rates. However, through investigating the effects acting on marine environments, possible
causation for marine debris accumulation could be speculated, in terms of primary or secondary debris
sources. Beaches that had more debris items accumulated had higher human visitation rates and more
influential wind and ocean currents; while beaches with less accumulated debris had lower human visitation
rates and less influential wind and oceanic currents.
ACKNOWLEDGMENTS
I would like to thank everybody who supported me and thus allowed me the opportunity to take part in this
project over the summer. Acknowledgements go to the Department of Conservation (DOC) and the University
of Auckland for providing me with a DOC Summer Science Scholarship. Thank you to all correspondence, my
head supervisor Dr Anne Gaskett from the University of Auckland and my co-supervisors from DOC, Dr Amélie
10Augé and Dr Shane Geange, and advisors Shelley Butt and Camden Howitt of the Sustainable Coastlines for
providing a training workshop and for their app and data sheet they provided. Thank you Georgia who pushed
me to apply for this summer internship. Thank you to Skye, Darien, Lachlan, Irysah, my mother, Whitney,
Jolene, Vincent and Drew; all those who visited and cleaned beaches with me over summer. Thank you to my
Grandparents, Pauline, Gavin and Jolene who provided accommodation. Thank you Claire for taking the time
to read this report. Thank you to my father who supported me throughout this project.
Please feel free to contact me regarding this report at gabrielle_johns@hotmail.com
11REFERENCES
Araujo, M. & Costa, M. (2019). A critical review of the issue of cigarette butt pollution in coastal environments,
Environmental Research, 172, 137–149.
Kataoka, T., Murray, C. & Isobe, A. (2018). Quantification of marine macro-debris abundance around
Vancouver Island, Canada, based on archived aerial photographs processed by projective transformation,
Marine Pollution Bulletin, 132, 44-51.
Lavers, J., Bond, A. & Hutton, I. (2014). Plastic ingestion by Flesh-footed Shearwaters (Puffinus carneipes):
implications for fledgling body condition and the accumulation of plastic-derived chemicals, Environmental
Pollution, 187, 124-129.
Li, J., Zhang, H., Zhang, K,. Yang, R., Li, R. & Li, Y. (2018). Characterization, source, and retention of microplastic
in sandy beaches and mangrove wetlands of the Qinzhou Bay, China, Marine Pollution Bulletin, 136, 401-406.
Panti, C., Baini, M., Lusher, A., Hernandez-Milan, G., Rebolledo, E., Unger, B., … Fossi, M. (2019). Marine litter:
one of the major threats for marine mammals outcomes from the European Cetacean Society workshop,
Environmental Pollution, 247, 72-79.
Roman, L., Bell, E., Wilcox, C., Hardesty, B. & Hindell, M. (2019). Ecological drivers of marine debris ingestion in
Procellariiform Seabirds, Scientific Reports, 9(916), 1-8.
Ryan, P., Moore, C., Franeker, J. & Moloney, C. (2009). Monitoring the abundance of plastic debris in the
marine environment, Philosophical Transactions of the Royal Society B, 364, 1999-2012.
Verlis, K., Campbell, M. & Wilson, S. (2013). Ingestion of marine debris plastic by the wedge-tailed shearwater
Ardenna pacifica in the Great Barrier Reef, Australia, Marine Pollution Bulletin, 72(1), 244-249.
Wessel, C., Swanson, K., Weatherall, T. & Cebrian, J. (2019). Accumulation and distribution of marine debris on
barrier islands across the northern Gulf of Mexico, Marine Pollution Bulletin, 139, 14–22.
Williams, A., Randerson, P., Di Giacomo, C., Anfuso, G., Macias, A. & Perales, J. (2016). Distribution of beach
litter along the coastline of Cádiz, Spain, Marine Pollution Bulletin, 107(1), 77-87.
12Appendix A- Far North beach survey dates, transect locations, participants and duration.
Date Location GPS Start Transect GPS End Transect Participants Duration
(beach) (DD) (DD) (number) (h)
13.12.2018 Ahipara -35.156815, 173.156883 -35.155885, 173.157614 2 1
13.12.2018 Waipapakauri -35.040448, 173.168508 -35.041246, 173.168742 2 1
15.12.2018 Matai -34.824359, 173.406876 -34.823281, 173.407190 2 1
17.12.2018 Waipapakauri -35.040448, 173.168508 -35.041246, 173.168742 2 1
19.12.2018 Waipapakauri -35.040448, 173.168508 -35.041246, 173.168742 2 1
19.12.2018 Ahipara -35.156815, 173.156883 -35.155885, 173.157614 2 1
19.12.2018 Taipa -34.993014, 173.465456 -34.992803, 173.464019 2 1
27.12.2018 Rarawa -34.716823, 173.076862 -34.715755, 173.075686 2 1
28.12.2018 Matai -34.824359, 173.406876 -34.823281, 173.407190 1 0.5
28.12.2018 Taipa -34.993014, 173.465456 -34.992803, 173.464019 1 0.75
02.01.2019 Waipapakauri -35.040448, 173.168508 -35.041246, 173.168742 1 1
02.01.2019 Ahipara -35.156815, 173.156883 -35.155885, 173.157614 1 1
03.01.2019 Matai -34.824359, 173.406876 -34.823281, 173.407190 1 1
03.01.2019 Taipa -34.993014, 173.465456 -34.992803, 173.464019 1 1
05.01.2019 Ahipara -35.156815, 173.156883 -35.155885, 173.157614 1 1
06.01.2019 Waipapakauri -35.040448, 173.168508 -35.041246, 173.168742 1 1
06.01.2019 Matai -34.824359, 173.406876 -34.823281, 173.407190 1 1
09.01.2019 Waipapakauri -35.040448, 173.168508 -35.041246, 173.168742 1 1
09.01.2019 Taipa -34.993014, 173.465456 -34.992803, 173.464019 1 0.75
09.01.2019 Ahipara -35.156815, 173.156883 -35.155885, 173.157614 1 0.5
09.01.2019 Matai -34.824359, 173.406876 -34.823281, 173.407190 1 0.5
11.01.2019 Waipapakauri -35.040448, 173.168508 -35.041246, 173.168742 2 1
11.01.2019 Ahipara -35.156815, 173.156883 -35.155885, 173.157614 1 0.5
12.01.2019 Matai -34.824359, 173.406876 -34.823281, 173.407190 1 0.5
13.01.2019 Taipa -34.993014, 173.465456 -34.992803, 173.464019 1 0.75
14.01.2019 Ahipara -35.156815, 173.156883 -35.155885, 173.157614 2 0.5
15.01.2019 Waipapakauri -35.040448, 173.168508 -35.041246, 173.168742 2 0.5
16.01.2019 Matai -34.824359, 173.406876 -34.823281, 173.407190 2 0.5
16.01.2019 Taipa -34.993014, 173.465456 -34.992803, 173.464019 2 0.75
20.01.2019 Waipapakauri -35.040448, 173.168508 -35.041246, 173.168742 1 0.5
20.01.2019 Ahipara -35.156815, 173.156883 -35.155885, 173.157614 1 0.5
24.01.2019 Matai -34.824359, 173.406876 -34.823281, 173.407190 1 0.5
24.01.2019 Taipa -34.993014, 173.465456 -34.992803, 173.464019 2 0.5
28.01.2019 Taipa -34.993014, 173.465456 -34.992803, 173.464019 1 1
30.01.2019 Taipa -34.993014, 173.465456 -34.992803, 173.464019 1 1
31.01.2019 Ahipara -35.156815, 173.156883 -35.155885, 173.157614 1 1
31.01.2019 Waipapakauri -35.040448, 173.168508 -35.041246, 173.168742 1 0.5
05.02.2019 Spirits Bay -34.424677, 172.858506 -34.425557, 172.858113 2 0.5
06.02.2019 Tapotupotu -34.436413, 172.713437 -34.436548, 172.714728 2 1
06.02.2019 Spirits Bay -34.424677, 172.858506 -34.425557, 172.858113 1 0.5
07.02.2019 Tapotupotu -34.436413, 172.713437 -34.436548, 172.714728 5 1
13Appendix B- The Sustainable Coastlines Citizen Science Platform Survey Home Page.
14Appendix C- Deceased Gannet Morus serrator 13/12/2018 on Waipapakauri Beach.
15You can also read