Assessment of Melting Kinetics of Sugar-Reduced Silver Ear Mushroom Ice Cream under Various Additive Models
←
→
Page content transcription
If your browser does not render page correctly, please read the page content below
applied
           sciences
Article
Assessment of Melting Kinetics of Sugar-Reduced
Silver Ear Mushroom Ice Cream under Various
Additive Models
Shu-Yao Tsai 1, * , Gregory J. Tsay 2,3 , Chien-Yu Li 4 , Yu-Tzu Hung 1 and Chun-Ping Lin 1,5,6, *
 1    Department of Food Nutrition and Health Biotechnology, Asia University, 500, Lioufeng Rd., Wufeng,
      Taichung 41354, Taiwan; hytheyla@gmail.com
 2    Division of Immunology and Rheumatology, Department of Internal Medicine, China Medical University
      Hospital, Taichung 40447, Taiwan; jjtsay@mail.cmu.edu.tw
 3    Department of Internal Medicine, School of Medicine, China Medical University Hospital,
      China Medical University, Taichung 40447, Taiwan
 4    Department of Neurosurgery, Asia University Hospital, Taichung 41354, Taiwan;
      sbrain.lee@mail.cmu.edu.tw
 5    Office of Environmental Safety and Health, Asia University, 500, Lioufeng Rd., Wufeng,
      Taichung 41354, Taiwan
 6    Department of Medical Research, China Medical University Hospital, China Medical University, 91,
      Hsueh-Shih Rd., Taichung 40402, Taiwan
 *    Correspondence: sytsai@asia.edu.tw (S.-Y.T.); chunping927@gmail.com (C.-P.L.)

 Received: 18 February 2020; Accepted: 8 April 2020; Published: 12 April 2020

 Abstract: This study focuses on assessing the effects of various food processing silver ear
 (Tremella fuciformis) powders in sugar-reduced ice cream through melting kinetic simulation, sensory
 properties and functional ingredients. T. fuciformis, a natural anti-melting stabilizer in ice cream,
 has the advantage of functional ingredients. Using 100, 200, and 300 mesh of particle sizes, and
 then selecting a suitable particle size, those are added to the additive ratios of 0.4, 0.9, and 1.4%
 T. fuciformis powder to replace fresh T. fuciformis fruit body. Decreased particle size of T. fuciformis
 powder significantly increased ice cream stability. Comparisons of sensory evaluation and melting
 properties, in order to learn the differences of T. fuciformis ice cream under various stabilizer models,
 were evaluated and elucidated. Therefore, we obtained 300 mesh at 0.9% additive ratio of T. fuciformis
 powder, which is closest to the fresh fruit body/base ice cream. The enrichment of ice cream with
 T. fuciformis is to enhance the nutritional aspects and develop a functional food. Overall, the kinetic
 parameters of T. fuciformis ice cream melting can be provided as a reference for frozen dessert
 processing technology.

 Keywords: silver ear (Tremella fuciformis); anti-melting stabilizer; ice cream; functional ingredient;
 frozen dessert processing technology

1. Introduction
     Ice cream, the best-known dairy dessert, represents a complex frozen system containing air
bubbles, fat globules, and ice crystals dispersed in a freeze-concentrated dispersion [1,2]. With the
wide variety of ice creams, the formulation is highly dependent on the mixing ingredients. Ice cream
ingredients contain milk powder, emulsifiers, stabilizers, sweeteners, and flavoring agents, while fat
and sugar are the main compounds that provide the caloric content. Therefore, the aim was to reduce
or replace these important ingredients in ice cream formulations in order to develop healthy products
that meet consumer requirements. These ice cream products include fiber-enriched, prebiotic, low fat,

Appl. Sci. 2020, 10, 2664; doi:10.3390/app10082664                              www.mdpi.com/journal/applsci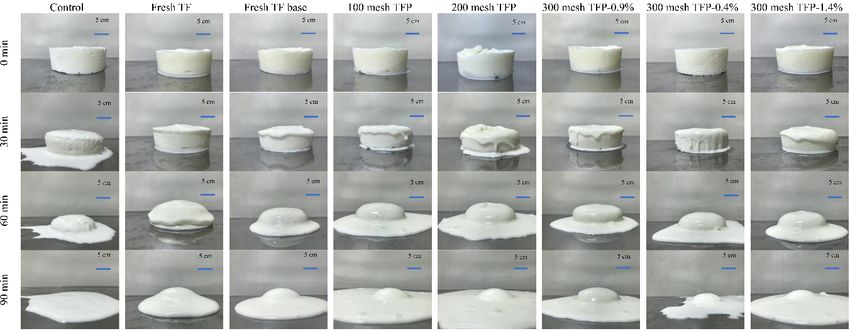
Appl. Sci. 2020, 10, 2664 2 of 14
and low sugar foods [3–8]. This is because the formulation affects ice cream quality characteristics,
such as sensory properties, freezing behavior, and melting properties [9–11]. The addition of stabilizers
primarily improves the smooth texture, decreases the melting rate of the mixture, and promotes the
formation of large ice and lactose crystals [12]. In addition to these traditional emulsifiers, numerous
scientists have striven to actively develop new stabilizers like gum for ice cream [13].
Heterobasidiae edible and medicinal mushrooms are a subclass of Basidiomycetes. Among
these, Tremella fuciformis is favorite artificially cultivated mushroom in Taiwan, known as silver ear or
white jelly fungus [14]. T. fuciformis is a popular food and herbal medicine ingredient due to having
low energy and lipid content, but it serves as a rich source of polysaccharides and dietary fiber; it
is widely used for nutritive and tonic actions in Asian countries [15]. T. fuciformis has been used
for medicinal purposes due to its possible bioactivity, which includes antioxidant properties [16],
anti-inflammatory functions [17], antineoplastic [18] and immunomodulatory effects [19], and
prevention of neurodegenerative disorders [20]. Fresh T. fuciformis supplies rapidly lose their general
quality due to fruit body autolysis and high respiration rate. Therefore, drying is a comparatively
effective method for the storage of mushrooms, and dehydrated mushrooms have been especially
appreciated by consumers [21]. As a food additive, T. fuciformis powders can supplement bread [22]
or can be used as meat substitutes [23] to improve their sensory and physicochemical properties.
Tsai et al. [14] found that small particle sizes of T. fuciformis powder had water holding capacity and
solubility that are well suited for the manufacture of instant foods.
We developed a special technical method melting kinetics simulation to learn the differences
between various natural stabilizer models of T. fuciformis to add in ice cream [24]. It is a novel idea
from the perspective of melting kinetics to learn the various additives that have minor physical change
differences in terms of melting characteristics by melting kinetic model simulation. So far, scientists
have agreed that melting or thawing is a complex physical change, but it is an interesting topic to
use simple and feasible methods to evaluate melting without involving chemical changes. Anyway,
the scientific theory needs to be actually combined. If you find an exceptionally suitable anti-melting
additive, it has a bad taste and is in vain. To convey the principle of natural deliciousness, the ice
cream must be savory, the advantage of slowing down the melting and increasing the rich taste at the
same time in this study.
Therefore, we used fresh T. fuciformis fruit bodies, substrates, various particle sizes of dry powders,
control of different additive ratios, then conducted ice cream sensory evaluation and melting rate
estimation to compare with the micro thermal analysis technology. The effects of various natural
stabilizers were evaluated on mouthfeel and melting reaction for T. fuciformis ice cream. According
to melting reaction kinetics, which are comprehended in the food processing industry to apply a
cross-domain approach for assessment of ice cream stabilizer effect. Previous studies by the authors
used kinetic simulation methods to ascertain the differences in moisture desorption and food drying
methods of mushrooms [14], but no attempt was made to explore the melting of ice cream. Worldwide,
scholars have also rarely engaged in similar research. This is a novel application research on food
processing innovation methods.
2. Materials and Methods
2.1. Ice Cream Mixture Formulation and Processing
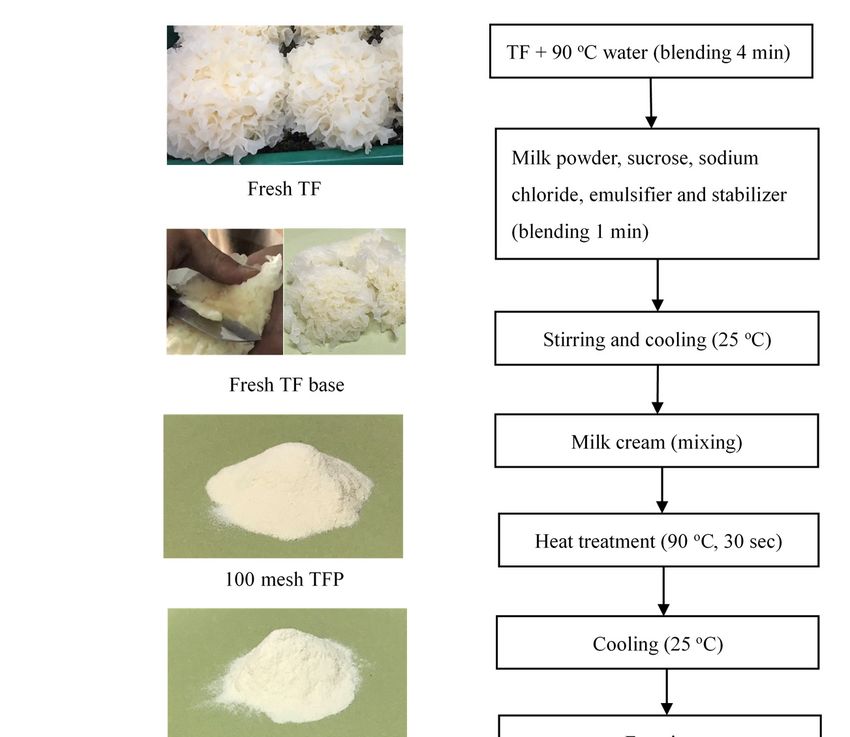
Fresh Tremella fuciformis (TF) was donated by Mid-Sum Biotechnology Co. Ltd. (Taichung, Taiwan,
ROC). At harvest, fresh mushrooms were removed from the jar and cut into fruit body (100–120 g fresh
weight/mushroom) and the base was sliced (10 g fresh mass/slice). The sliced bases were freeze-dried
and ground into a powder with a milling machine (Retsch Ultra Centrifugal Mill and sieving machine,
Haan, Germany), screened through 100, 200, and 300 mesh sieves, and then stored at 4 ◦ C until
use. Milk cream (Taiwan Branch of Singapore Business Pan-Asia Dragon PTE. Ltd., Taipei, Taiwan),
emulsifier (imported from First Chemical Co., Ltd., Taipei, Taiwan, manufactured by Shiohama Co.,
Appl. Sci. 2020, 10, 2664 3 of 14
Appl. Sci. 2020, 10, x FOR PEER REVIEW 3 of 14
Japan), sucrose (Taiwan Sugar Co. Ltd., Tainan, Taiwan), sodium chloride (Taiyen Biotech Co., Ltd.,
Da Kwan Trading
Tainan, Taiwan),Co. Ltd.,
sodium New Taipei, Taiwan,
carboxymethyl manufactured
cellulose (importedbybyNipponDa Kwan Paper Industries
Trading Co.,New
Co. Ltd., Ltd.,Taipei,
Tokyo, Japan),manufactured
Taiwan, and milk powder and maltodextrin
by Nippon (Sally Biotech
Paper Industries Co., Ltd.,Co.Tokyo,
Ltd., Changhua,
Japan), andTaiwan) were and
milk powder
purchased from a local market.
maltodextrin (Sally Biotech Co. Ltd., Changhua, Taiwan) were purchased from a local market.
Fresh Fresh
T. fuciformis fruit body,
T. fuciformis T. fuciformis
fruit body, slicedsliced
T. fuciformis base, base,
and 100,and200,
100,and
200,300
andmesh T. fuciformis
300 mesh T. fuciformis
powders
powders were used to make various ice creams, assigned as fresh fruit body (TF), fresh(TFB),
were used to make various ice creams, assigned as fresh fruit body (TF), fresh base base (TFB),
100, 200,
100, and
200, 300
andmesh
300 meshTremella fuciformis
Tremella powder
fuciformis (TFP)(TFP)
powder (Figure 1A). The
(Figure 1A). ice
Thecream production
ice cream production
method is summarized
method is summarized in Figure 1B. Experimental
in Figure 1B. Experimental ice creams werewere
ice creams formulated as reported
formulated in Table
as reported in Table 1.
1. TheThe
300 300
mesh T. fuciformis
mesh powder
T. fuciformis powderwas was
usedused
to create different
to create additive
different ratiosratios
additive in icein
cream, assigned
ice cream, assigned
as 300asmesh TFP low
300 mesh TFPratio
low (0.4%), 300 mesh
ratio (0.4%), TFP medium
300 mesh TFP medium ratio (0.9%), and 300
ratio (0.9%), andmesh TFP high
300 mesh TFP ratio
high ratio
(1.4%). Ice cream
(1.4%). mixesmixes
Ice cream werewere
prepared by using
prepared by usinga batch ice ice
a batch cream
cream maker
maker(2 (2
L capacity,
L capacity,Kaiser
KaiserKice-
Kice-2030,
2030, China)
China) for
for 6060 min.
min. Briefly,
Briefly,the
theTPTPsample
samplewas wasblended
blended(90 (90◦ C°C hot water, 4 min), and
hot water, 4 min), and then then milk
milk powder,
powder, sucrose,
sucrose, sodium
sodium chloride,
chloride, emulsifier,
emulsifier, andand stabilizer
stabilizer werewereaddedadded
and and the mix
the mix was was agitated
agitated for 1 min.
for 1 min. Afterward,
Afterward, liquefied
liquefied milkmilk
cream cream
waswas addedaddedandandthe the entire
entire mixture
mixture waswas blended
blended forfor 1 min
1 min using a
usingmixer.
a mixer. The mixture was heated using a batch heater (30 secs at 90 ◦°C).
The mixture was heated using a batch heater (30 secs at 90 C). Then, the ice creams were Then, the ice creams
were packed
packed in in 500
500 mL
mL paper
papercups
cupsandandstored
stored(−18
(−18◦°C,
C, 2424h)h)for
forhardening,
hardening,followed
followedbybystoring
storinginina afreezer
freezer (−18◦ C)
(−18 °C)prior
priortotoanalysis.
analysis.
Figure 1. Tremella fuciformis sample (A) and ice cream production flow chart (B).
Figure 1. Tremella fuciformis sample (A) and ice cream production flow chart (B).Appl. Sci. 2020, 10, 2664 4 of 14
Table 1. Tremella fuciformis ice cream formulation.
Fresh TF 100 Mesh 200 Mesh 300 Mesh 300 Mesh 300 Mesh
Ingredients/g Control Fresh TF
Base TFP TFP TFP-0.4% TFP-0.9% TFP-1.4%
Milk cream 180 180 180 180 180 180 180 180
Milk powder 9 9 9 9 9 9 9 9
Sucrose 40 50 50 40 40 40 40 40
Sodium chloride 0.5 0.5 0.5 0.5 0.5 0.5 0.5 0.5
Emulsifier 2 2 2 2 2 2 2 2
Sodium carboxymethyl
0.45 0.45 0.45 0.45 0.45 0.45 0.45 0.45
cellulose
Maltodextrin 0.45 0.45 0.45 0.45 0.45 0.45 0.45 0.45
Water 300 300 300 300 300 300 300 300
Silver ear - 54 54 4.83 4.83 2.13 4.85 7.6
Total 532.4 596.4 596.4 537.25 537.25 534.55 537.25 540.0
2.2. Consumer Sensory Evaluation
The ice cream samples stored at −18 ◦ C were tempered for 10 min at room temperature for sensory
evaluation at the Asia University campus, Taichung, Taiwan. A total of 50 untrained consumers from
ages 19 to 50 completed a questionnaire. Five sensory attributes (flavor, mouthfeel, texture, sweetness,
and overall acceptability) were measured for the ice cream samples. The values of 1, 3, and 5 on the
five-point hedonic scale represented “extremely dislike”, “neither like nor dislike”, and “extremely
like”, respectively [22].
2.3. Melting Behavior and Melting Rate Measurements
The behavior of ice cream to retain its shape during melting was evaluated through an image
analysis method. Roughly 100 g of cylindrical blocks of conditioned ice creams (−18 ◦ C, 24 h) was
placed on an iron plate at 24 ± 0.5 ◦ C. Photographs of the samples during the melting test were taken
with a phone camera (iPhone 7 Plus, Apple Inc., USA) in standard conditions at fixed time intervals
of 5 min, for a total time of 90 min. The melting characteristics, expressed as melting rate (g/min),
were evaluated as described by Balthazar et al. [4]. Briefly, 50 g of ice cream (−18 ◦ C) was placed on
a strainer and left to melt into a 200 mL beaker at room temperature (23 ± 2 ◦ C) until 100% of the
sample was melted. The mass of melted ice cream was recorded every 5 min with the aim of obtaining
a sigmoidal curve representing the kinetics of the melting process. From the linear region of the curve,
the most likely straight line was calculated, with its slope representing the melting rate (g/min).
2.4. DSC Measurements
Measurements of the melting properties of T. fuciformis ice cream were performed by differential
scanning calorimetry (DSC) (TA Q20) with a refrigerated cooling system (RCS 90) (TA Instruments,
Newcastle, DE, USA). DSC analysis was performed on samples sealed in 20 µL aluminum pans; the
test cell was sealed manually by a special tool equipped with the TA DSC. In all DSC studies, nitrogen
was the purge gas with a flow rate of 50 mL/min. ASTM E698 was used to obtain thermal curves for
analyzing the parameters. Aliquots (4.0 mg) of each sample were used for acquiring the experimental
data. Non-isothermal tests of the heating rate selected for the programmed temperature ramp included
2, 4, and 6 ◦ C/min for the range of temperature increase chosen from holding for 5 min at −60 ◦ C,
followed by heating from −60 to 30 ◦ C for each melting experiment [25]. The melting property analysis
also compared commercial ice cream and 10%, 30%, and 50% sucrose solutions in order to understand
the glass transition temperature (Tg ) characteristics of sucrose in ice cream and its melting effects
with respect to ice cream, which is also to preliminarily exclude the interference of sucrose on the
melting of ice cream. The DSC dynamic tests of the heating rate led to the selection of 6 ◦ C/min for theAppl. Sci. 2020, 10, 2664 5 of 14
conditions of holding for 5 min at −60 ◦ C and then heating from −60 to 30 ◦ C for each glass transition
temperature experiment.
2.5. Melting Kinetic Simulation
Comparisons of Avrami Erofeev’s kinetic and the proto-kinetic equations were applied to evaluate
the ice cream melting properties for the melting reaction, as follows [26]:
Ea
ri = ke− RT (1 − α)[− ln(1 − α)]n0 Avrami Erofeev0 s kinetic equation (1)
Ea
ri = ke− RT αn1 [1 − α]n2 Proto-kinetic equation (2)
where ri is the reaction rate, Ea is the apparent activation energy of melting, k is the pre-exponential
factor of the reaction, R is the ideal gas constant, α is the degree of conversion of a reaction or stage, and
ni is the reaction order of melting (i = 0, 1, and 2). We developed a melting reaction for T. fuciformis ice
cream that includes the melting characteristics, such as the reaction order (ni ), enthalpy of the melting
reaction (∆H), and the apparent activation energy of melting (Ea ), which could be applied in the design
of processing conditions for ice cream.
2.6. Determination of Physical Characteristic
Physical characteristic analyses were performed on hardened ice cream sample on day 1. The pH
values of the ice cream sample were measured using an S20 pH Meter (Mettler Toledo International, Inc.
Greifensee, Switzerland). The ice cream samples were subjected to color measurement using an S80
color measuring system (BYK Additives & Instruments, Columbia, MD, USA). The color of the samples
was expressed as L-value (lightness), a-value (redness/greenness) and b-value (yellowness/blueness).
The whiteness index (WI) was calculated based on the following equation [22]:
q
WI = 100 − (100 − L)2 + a2 + b2 (3)
The hardness values of ice cream were determined by texture profile analysis (EZ Test/CE,
Shimadzu Model, Japan). For each sample, three measurements with three replicates were performed
using a cylindrical probe (5 mm diameter). The hardness was expressed as the peak pressure force
(N/mm2 ) during penetration. The apparent viscosity of the sample was determined using a sine wave
Vibro-viscometer A&D SV-10 (A&D Company, Limited, Tokyo, Japan), that was at constant frequency
30 Hz and amplitude less than 1 mm [14].
2.7. Determination of Chemical Characteristics
The ice cream samples were freeze-dried and ground into powder by using a milling machine
(Retsch ultracentrifugal mill and sieving machine, Haan, Germany) and stored at 4 ◦ C until used. Dry
matter, ash, fat and protein were determined in ice cream samples according the AOAC (2000) methods.
The moisture content of the ice cream samples was measured by an MB45 moisture analyzer (Ohaus
Corporation, NJ, USA) at 105 ◦ C. The ash content was analyzed by using gravimetric methods at
550 ◦ C. The fat content of the ice cream was determined using the Soxhlet method. The protein content
was assayed according to Kjeldahl method. Water-insoluble and water-soluble dietary fibers were
analyzed following the AOAC 991.43 enzymatic-gravimetric method using a dietary fibers assay kit
(Megazyme International Ireland Ltd., Wicklow, Ireland). The polysaccharide content was determined
by phenol–sulfuric acid [14]. Ice cream sample was extracted with water in a 1: 30 (w/w) ratio at
121 ◦ C and 15 min. The mixture was cooled to room temperature and filtered through Whatman No. 4
filter paper. The combined filtrate was dialyzed by using a Cellu Sep T2 tubular membrane (MWCO:
6000–8000, Membrane Filtration Products, Inc., Seguin, TX, USA) for 24 h, resulting in a water-soluble
polysaccharide sample.Appl. Sci. 2020, 10, 2664 6 of 14
2.8. Statistical Analyses
The experimental data obtained were expressed as mean ± standard error and subjected to an
analysis of variance for a completely random design using an SAS 9.4 Software (SAS Institute, Inc.,
Appl. Sci. 2020, 10, x FOR PEER REVIEW 6 of 14
Cary, NC, USA). The difference among means was determined using Duncan’s multiple range tests at
the levelCary, = 0.05.
of α NC, USA). The difference among means was determined using Duncan’s multiple range tests
at the level of α = 0.05.
3. Results and Discussion
3. Results and Discussion
3.1. Sensory Quality Characteristics of T. fuciformis Ice Cream
3.1. Sensory Quality Characteristics of T. fuciformis Ice Cream
The taste should remain unchanged, with the adjustments being the different additives of
T. fuciformis, The
suchtaste should
as fresh remain
fruit body,unchanged, with theparticle
substrate, various adjustments
sizes,being the different
and addition additives
ratio. of T.
Then sensory
evaluationfuciformis, such as rate
and melting freshanalyses
fruit body, substrate,
were variousThe
conducted. particle sizes,
results ofand addition
sensory ratio. characteristics
quality Then sensory
are shown evaluation
in Figure and2.melting rate analyses
The flavor, were conducted.
mouthfeel, and texture The resultswere
scores of sensory quality in
determined characteristics
the range of
are shown in Figure 2. The flavor, mouthfeel, and texture scores were determined in the range of
3.41–4.01 points of all ice cream samples. The highest score of all samples was found to be 4.05 in
3.41–4.01 points of all ice cream samples. The highest score of all samples was found to be 4.05 in the
the TF base. The fresh TF base exhibited the best taste for all ice creams, next was the Fresh TF ice
TF base. The fresh TF base exhibited the best taste for all ice creams, next was the Fresh TF ice cream,
cream, andand these werefollowed
these were followed by by
the the 300 mesh
300 mesh TFPwas
TFP that that was to
added added to a proportion
a proportion of 0.9%
of 0.9% in the in the
ice cream.
ice cream. Meanwhile, we also compared the 100, 200, and 300 mesh T. fuciformis
Meanwhile, we also compared the 100, 200, and 300 mesh T. fuciformis powders as natural stabilizers powders as natural
stabilizers toadded
to be be added into
into ice ice cream.
cream. Each additive
Each additive amount was amount wasthe
0.9%, and 0.9%, and powder
300 mesh the 300 icemeshcreampowder
was
ice cream was determined
determined to taste theto best.
tasteThe
the sensory
best. The sensoryofevaluation
evaluation of additive
additive ratio was carriedratio
outwas
withcarried
300 mesh out
with 300powder in the ratios
mesh powder in theof 0.4, 0.9, of
ratios and 1.4%.
0.4, 0.9,The
and0.9% T. fuciformis
1.4%. The 0.9%powder addition
T. fuciformis was selected
powder additionas the
was
selected most
as thebeneficial conditioncondition
most beneficial by sensory byevaluation. The resulting
sensory evaluation. iceresulting
The cream was icesweet
cream but
wasnotsweet
greasy,but
with nice flavor and texture, and this nutritious, novel, and healthy product
not greasy, with nice flavor and texture, and this nutritious, novel, and healthy product with a smooth with a smooth taste was
the most popular formula. It is exceptionally interesting that the control ice cream (i.e., milk ice cream)
taste was the most popular formula. It is exceptionally interesting that the control ice cream (i.e., milk
without any added T. fuciformis was also extraordinarily popular among all of the subjects. It is no
ice cream) without any added T. fuciformis was also extraordinarily popular among all of the subjects.
wonder that milk ice cream is always one of the main commercial ice cream products, but it does not
It is no wonder
offer the that milk ice
functional cream of
nutrients is always one of the
the T. fuciformis ice main
creamcommercial ice cream
such as protein, products, and
polysaccharides, but it
does notdietary
offer the functional
fiber. nutrients of the T. fuciformis ice cream such as protein, polysaccharides,
and dietary fiber.
Mouthfeel
Control
Fresh TF
Fresh TF base
100 Mesh TFP
200 Mesh TFP
Sweetness 300 Mesh TFP-0.9%
300 Mesh TFP-0.4%
300 Mesh TFP-1.4%
Flavor
3.4 3.5 3.6 3.7 3.8 3.9 4.0 4.1 4.2
Texture
Overall
FigureFigure 2. Sensory
2. Sensory scores
scores offuciformis
of T. T. fuciformis
iceicecreams.
creams.
3.2. Melting Behavior
3.2. Melting and Melting
Behavior Rate Rate
and Melting of T. offuciformis Ice Ice
T. fuciformis Cream
Cream
Figure 3Figure 3 exhibits
exhibits 100 g 100 g ofcream
of ice ice cream
whichwhich
waswas placed
placed ononananiron
ironplate
plate at
at 24
24 ±
± 0.5
0.5°C◦ Cfor
fortotal
total
testing
testing time oftime of 90 min.
90 min. AfterAfter 60 min,
60 min, as as longasasthe
long the ice
ice cream
creamwas
wassupplemented
supplemented withwith
T. fuciformis, the
T. fuciformis,
ice cream
the ice cream waswas superior
superior toto thecontrol
the controliceice cream.
cream. WeWeobserved
observedthat thethe
that fresh TF, fresh
fresh TF base,
TF, fresh and the
TF base, and
0.9% TFP enabled better integrity for all of the ice creams after 90 min in this study compared to the
control sample. The particle size of the T. fuciformis powder and the proportions of the added amountsAppl. Sci. 2020, 10, 2664 7 of 14
Appl. Sci. 2020, 10, x FOR PEER REVIEW 7 of 14
are not extraordinarily clear. From Figure 4, we obtained lower values of 0.37 and 0.39 g/min,
the 0.9% TFP enabled better integrity for all of the ice creams after 90 min in this study compared
respectively, for the fresh TF and fresh TF base among the ice creams. The slower the melting rate,
to Appl.
the control sample.
Sci. 2020, 10, particle size of the T. fuciformis powder and the proportions of the7 added
TheREVIEW
x FOR PEER of 14
the more resistant to melting the T. fuciformis ice cream became due to the fresh base; the fruiting
amounts are not extraordinarily clear. From Figure 4, we obtained lower values of 0.37 and 0.39 g/min,
body
are not andextraordinarily
the T. fuciformis powder Figure
clear. ice creamwe exhibited anti-melting properties, but0.39melting was
respectively, for the fresh TF andFromfresh TF base4,among obtained lower values
the ice creams. of 0.37the
The slower andmelting g/min,
rate, the
extremely
respectively, fast for the
formelting control
the fresh ice cream. The resistance to melting is an important factor in the eating
more resistant to theTFT. and fresh TF
fuciformis ice base
cream among
becamethedueice to
creams. Thebase;
the fresh slower
thethe melting
fruiting bodyrate,and
oftheicemore
cream. The addition
resistant to melting oftheT. fuciformis
T. had
fuciformis ice the effect
cream of slowing
became due to the
the melting
fresh base;of the
thefruiting
ice cream.
the T. fuciformis powder ice cream exhibited anti-melting properties, but melting was extremely fast
Comparisons
body and theofT.Figures 3 and
fuciformis 4 areice
powder unable
creamto exhibited
subdivideanti-melting
the exact anti-melting
properties, buteffects of adding
melting was T.
for the control ice cream. The resistance to melting is an important factor in the eating of ice cream.
fuciformis
extremelypowder fast for to
thethe ice cream.
control ice cream.As shown in Figure
The resistance to4,melting
the fresh TFimportant
is an and freshfactor
TF base were
in the indeed
eating
The addition of T. fuciformis had the effect of slowing the melting of the ice cream. Comparisons of
of ice cream. The addition of T. fuciformis had the effect of slowing the melting
the best; however, from Figure 3, the ice creams with fresh TF, fresh TF base and 300 mesh T. fuciformis of the ice cream.
Figures 3 and 4 are unable to subdivide the exact anti-melting effects of adding T. fuciformis powder to
Comparisons
powder addedoftoFigures 3 and
0.9% still 4 are unable
maintained to subdivide
a certain shape theafterexact anti-melting
90 min, whereaseffects of adding
the other T.
ice creams
the ice cream. As shown in Figure 4, the fresh TF and fresh TF base were indeed the best; however,
fuciformis
were almost powder to theItice
liquefied. cream. As shown
is impossible in Figure
to precisely 4, the fresh
ascertain TF and fresh
the melting TF baseand
properties were indeedrate
melting
from Figure
the best; This
3, the ice
however,
creams with fresh TF, freshwith
TF fresh
base and 300 mesh T. and
fuciformis powder added to
features. studyfrommustFigure
employ 3, the ice creams
micro kinetics analysis TF,
forfresh TF base
further detailed 300 mesh T. fuciformis
analysis.
0.9% still maintained a certain shape after 90 min, whereas the
powder added to 0.9% still maintained a certain shape after 90 min, whereas the other other ice creams were almost liquefied.
ice creams
It is impossible to precisely ascertain the melting properties and melting rate
were almost liquefied. It is impossible to precisely ascertain the melting properties and melting rate features. This study must
employ
features.microThiskinetics
study mustanalysis
employ for micro
furtherkinetics
detailed analysis.
analysis for further detailed analysis.
Figure 3. Photographs taken during melting behavior of ice creams produced with control, fresh TF,
fresh TF base, 100 mesh TFP, 200 mesh TFP, 300 mesh TFP-0.9%, 300 mesh TFP-0.4% and 300 mesh
Figure
Figure3. 3.Photographs
TFP-1.4%. They were taken
Photographs takenduring
during
at melting behavior
melting behavior
the beginning ofofice
of the test icecreams
(0 creams
min), produced
produced
and with
with
after 30, control,
60 control,
and fresh
fresh
90 min atTF, TF,
room
fresh
fresh TF base, 100 mesh TFP, 200 mesh TFP, 300 mesh TFP-0.9%, 300 mesh TFP-0.4%
TF base, 100 mesh TFP, 200 mesh TFP, 300 mesh TFP-0.9%, 300 mesh TFP-0.4% and 300 mesh
temperature. and 300 mesh
TFP-1.4%.They
TFP-1.4%. They were
were taken
takenatatthe
thebeginning of the
beginning test test
of the (0 min), and after
(0 min), and 30, 60 and
after 90 and
30, 60 min at 90room
min at
temperature.
room temperature.
0.8
0.8
0.6
(g/min)
0.6
(g/min)
raterate
0.4
Melting
0.4
Melting
0.2
0.2
0.0
ol dy
0.0
o ntr l it b od y Bas e 0.9% 0.9% 0.9% 0.4% 1.4%
C ntroF ru b o s e M 9% M 9% 0 M % M % M%
Co t Ba 100M 0. 200M 0. 30M 0.9 300 0.4 300 1.4
F rui M M
100 200 300 300 300
Figure 4. Melting rate of T. fuciformis ice creams.
Figure 4. Melting rate of T. fuciformis ice creams.
Figure 4. Melting rate of T. fuciformis ice creams.Appl. Sci. 2020, 10, 2664 8 of 14
3.3. Melting Properties of T. Fuciformis Ice Cream by DSC Analysis
First, in the study of T. fuciformis ice cream, we attempted to analyze the melting characteristics of
commercial ice cream. Commercial ice cream was labeled with a composition ratio of 18% sucrose.
From Table 2, the sucrose content ratios in this study ranged from 7.4 to 8.4%; due to the fresh base
and the fruiting body of T. fuciformis, a water content of up to 90% existed, requiring an additional
10 g of sugar per process in response to the actual taste. Table 2 shows the control ice cream, which
contained the lowest sucrose content of 7.5%, for which the glass transition temperature was unable to
be detected by DSC analysis; however, this sample exhibited the highest melting onset temperature
(Tg) of −2.88 ◦ C, melting peak temperature (mT0 ) of −0.37 ◦ C, and enthalpy of the melting reaction
(m∆H) of 196.20 kJ/kg. When sucrose content exceeded 10%, the glass transition temperature occurred
at approximately −33 ◦ C. The highest additional ratio, 50% sucrose, exhibited the lowest melting
enthalpy of 75.65 kJ/kg, the glass transition temperature of −34.79 ◦ C, melting onset temperature of
−13.92 ◦ C and a peak temperature of −6.95 ◦ C in this study. DSC result shows that an increase in the
proportion of sucrose added was detrimental to the stability of the frozen dessert. The higher the
additional sucrose ratio of the cold dessert, the faster the ice melting. It is no wonder that gelato has
added glucose or fructose to replace a fraction of the sucrose for increasing the rich taste, but that can
also reduce the melting rate.
Table 2. Results of control ice cream, commercial ice cream, sugar solution of at 10, 30, and 50% sucrose
by DSC analyses for heating from −60 to 30 ◦ C with the heating rate 6/◦ C min.
Sample Tg (◦ C) mTo (◦ C) mTp (◦ C) m∆H (kJ/kg)
7.5% sucrose control ice cream N/A −2.88 −0.37 196.20
18% sucrose commercial ice cream −33.65 −5.84 −2.15 137.50
10% sucrose solution −32.93 −4.72 −0.59 176.90
30% sucrose solution −32.50 −8.66 −3.29 122.80
50% sucrose solution −34.79 −13.92 −6.95 75.65
Legend: Tg, glass transition temperature; mTo, melting reaction onset temperature; mTp, Melting reaction peak
temperature; m∆H, endothermic enthalpy of the melting; N/A, not applicable.
Regarding the determination of T. fuciformis ice cream melting properties by DSC analysis, which
conducted dynamic tests of 2, 4, and 6 ◦ C/min, the heating rates across the range of temperature
increased after holding for 5 min at −60 ◦ C and then increased to 30 ◦ C for each melting experiment.
The DSC analysis results could not determine whether the added proportion of Tremella fungus would
affect the stability of ice cream (Table 3). It is not only a lack of functionality, but also the quantitative
analysis results from the DSC curve that could be insufficient in providing the detailed differences
between stabilizers added into the ice cream. Thus, Table 3 displays that T. fuciformis ice creams exhibit
nearly identical results of melting onset temperature, melting peak temperature, and enthalpy of
melting reaction by DSC preliminary analysis.
Table 3. Results of DSC tests of ice cream with heating rates of 2, 4, and 6 ◦ C/min over the range of
temperatures from −60 to 30 ◦ C.
Heating Rate (◦ C/min) mTo (◦ C) mTp (◦ C) m∆H (kJ/kg)
2 −2.91 −0.96 202.50
Control 4 −3.20 −0.70 199.30
6 −2.88 −0.37 196.20
2 −3.11 −0.96 202.00
Fresh TF 4 −3.09 −0.47 209.10
6 −3.34 −0.26 206.60
2 −3.36 −1.11 198.30
Fresh TF base 4 −3.26 −0.63 201.70
6 −3.18 −0.25 203.50Appl. Sci. 2020, 10, 2664 9 of 14
Table 3. Cont.
Heating Rate (◦ C/min) mTo (◦ C) mTp (◦ C) m∆H (kJ/kg)
2 −3.03 −0.90 203.10
100 mesh TFP 4 −3.25 −0.70 203.90
6 −3.30 −0.43 203.40
2 −2.89 −0.86 197.60
200 mesh TFP 4 −3.09 −0.62 201.40
6 −3.16 −0.32 201.40
2 −2.97 −0.95 201.00
300 mesh
4 −3.03 −0.64 200.10
TFP-0.9%
6 −3.11 −0.26 211.90
2 −2.72 −0.79 209.00
300 mesh
4 −2.85 −0.45 212.90
TFP-0.4%
6 −2.79 −0.19 215.30
2 −2.99 −0.95 196.40
300 mesh
4 −3.33 −0.66 202.50
TFP-1.4%
6 −3.24 −0.19 209.60
Legend: mTo, melting reaction onset temperature; mTp, Melting reaction peak temperature; m∆H, endothermic
enthalpy of the melting; N/A, not applicable.
3.4. Ice Cream Melting Kinetic Simulation
The melting reaction of T. fuciformis ice cream has not been addressed by much applicable literature
to inform or assist this study. According to the authors’ previous research experience, the nonchemical
reaction kinetic was selected, which was performed by Avrami Erofeev’s kinetic and the proto-kinetic
equations simulation analyses of the phase transfer, melting, and endothermic reaction, of the physical
properties. Here, we used DSC analysis with various heating rates to compute the melting kinetics of
ice cream by conducting Avrami Erofeev’s kinetic and proto-kinetic simulations, to glean all kinetic
model simulation results and then to select and compare the more suitable kinetic model for the
application of ice cream melting characteristics. Furthermore, we finished all of the ice cream melting
reaction kinetic calculations, which included the melting property parameters, such as the natural
logarithm of the pre-exponential factor, the apparent activation energy of the melting reaction, and the
reaction order. The detailed T. fuciformis ice cream melting reaction parameters are in Table 4.
Table 4 shows the Avrami Erofeev kinetic equation simulation, which exhibits poorly consistent
results. In addition, Figure 5 also displays the results of the proto-kinetic model simulation; all of
the simulation results coincide with the experimental data, but using Avrami Erofeev’s kinetic model
results in poor overall consistency. Furthermore, the results of the proto-kinetic model simulation were
applied to compare the differences of melting characteristics of T. fuciformis ice creams in this study.
From Table 4, we obtained the fresh TF and fresh TF base T. fuciformis ice creams with almost identical
kinetic parameters. For the result of adding T. fuciformis powder as an ice cream stabilizer, compared
with the melting parameters of various particle sizes (100, 200, and 300 mesh), the 300 mesh displayed
a more stabilized effect. From the results of the kinetic analysis, the controlled ice cream exhibited the
worst resistance to melting.Appl. Sci. 2020, 10, 2664 10 of 14
Table 4. Melting kinetic simulation results of DSC analyses for T. fuciformis ice creams from −60 to
30 ◦ C at heating rates of 2, 4, and 6 ◦ C/min.
Heating Rate 2 4 6
Ice Cream Avrami Avrami Avrami
Parameter Proto Proto Proto
Erofeev’s Erofeev’s Erofeev’s
ln(k0 ) 1.000E-06 3.0478 30.4182 3.3370 12.2110 3.6327
Ea 18.2713 16.3207 76.0868 15.8026 36.0000 15.8015
Control n/n1 0.3944 1.0082 0.8008 0.9998 0.7618 0.9987
n2 N/A 0.0909 N/A 0.3000 N/A 0.3278
∆H 205.8837 204.2369 200.0942 201.9552 200.2802 200.4360
ln(k0 ) 43.5299 23.3498 19.8606 24.3940 47.0421 24.1891
Ea 106.2144 62.6209 54.2131 62.4601 116.3713 61.3940
Fresh TF n/n1 0.8283 0.7573 0.6491 0.8687 0.1507 0.8505
n2 N/A 0.2359 N/A 0.4905 N/A 0.6690
∆H 200.7589 201.4170 209.7087 209.0389 204.5348 203.0871
ln(k0 ) 8.3507 23.9527 23.8063 24.4070 47.4876 23.9588
Ea 27.0063 62.5884 61.0614 62.7213 114.0540 62.3057
Fresh TF
n/n1 0.9569 0.8875 0.8451 0.8391 0.7214 0.6975
base
n2 N/A 0.3678 N/A 0.5185 N/A 0.4523
∆H 194.3651 196.5890 199.2232 199.6637 201.3932 204.5091
ln(k0 ) 10.2859 10.4017 7.9790 10.6846 32.4467 11.0755
Ea 31.3031 31.9875 28.2942 31.9423 79.8970 31.3979
100 mesh
n/n1 0.9525 0.9872 0.7214 0.9323 0.7972 0.9828
TFP
n2 N/A 0.4203 N/A 0.4366 N/A 0.5828
∆H 204.9092 203.7050 204.6270 204.6387 203.7039 203.3011
ln(k0 ) 28.3391 19.6084 36.7518 19.2370 11.6076 19.8417
Ea 71.8479 52.5000 90.7832 52.3321 35.2615 51.1932
200 mesh
n/n1 0.8875 0.9407 0.7486 0.7454 0.6929 0.9170
TFP
n2 N/A 0.3689 N/A 0.1915 N/A 0.6586
∆H 195.3120 195.6301 201.8613 203.1085 204.6257 203.7534
ln(k0 ) 40.9786 25.0972 14.8281 25.0105 15.8715 27.8490
Ea 100.4681 65.4591 42.6276 64.1818 43.3537 69.4753
300 mesh
n/n1 0.8353 0.8577 0.7291 0.8086 0.8278 0.8497
TFP-0.9%
n2 N/A 0.3644 N/A 0.8310 N/A 0.6155
∆H 200.5455 200.7974 199.3297 200.1815 212.2757 210.7239
ln(k0 ) 29.5765 14.7524 17.2494 14.8923 29.9857 14.3501
Ea 74.6918 41.1389 48.1955 41.2655 74.5872 38.7238
300 mesh
n/n1 0.8821 1.0046 0.6937 0.9120 0.8006 0.9589
TFP-0.4%
n2 N/A 0.4052 N/A 0.6784 N/A 0.6391
∆H 208.6359 208.4884 216.9507 211.5991 207.9163 214.1946
ln(k0 ) 12.2034 25.2985 11.8881 26.1150 29.1130 26.3340
Ea 38.4980 66.4692 36.1361 66.3921 72.7000 66.3508
300 mesh
n/n1 0.7198 0.7998 0.7568 0.8430 0.7894 0.8206
TFP-1.4%
n2 N/A 0.2044 N/A 0.5349 N/A 0.6323
∆H 197.3906 196.7799 200.5685 204.5810 208.5698 208.6545
ln(k0 ), natural logarithm for the pre-exponential factor of reaction(ln1/s); Ea , activation energy of the melting reaction
(kJ/mol); n/n1 , reaction order n1 of the melting reaction; n2 , reaction order n2 of the melting reaction. Enthalpy of the
melting reaction by simulation (kJ/kg); ∆H, enthalpy of the melting reaction by simulation (kJ/kg); Avrami Erofeev’s,
Avrami Erofeev’s kinetic equation; Proto, Proto-kinetic equation.
The above results match well with the actual melting rate measurement results. In addition,
comparing the various exceptional addition ratios of 300 mesh T. fuciformis powder (0.4, 0.9, and
1.4%), it is shown that the higher the amount of 1.4% addition, the better the stability. Even when
the addition amount is high, the anti-melting property is good, but this study had to consider the
results of the sensory evaluation. Moreover, from Table 4, we selected the results of the proto-kinetic
model simulation comparison, which indicated the fresh TF, fresh TF base and the 0.9% T. fuciformis
powder; there were exceptionally similar melting kinetic parameters. From the comparison of sensorysimulation results coincide with the experimental data, but using Avrami Erofeev’s kinetic model
results in poor overall consistency. Furthermore, the results of the proto-kinetic model simulation
were applied to compare the differences of melting characteristics of T. fuciformis ice creams in this
study. From Table 4, we obtained the fresh TF and fresh TF base T. fuciformis ice creams with almost
Appl. Sci. 2020,
identical 10, 2664
kinetic parameters. For the result of adding T. fuciformis powder as an ice cream stabilizer, 11 of 14
compared with the melting parameters of various particle sizes (100, 200, and 300 mesh), the 300
mesh displayed
evaluation and amelting
more stabilized effect. results,
kinetic analysis From the results
it can of the kinetic that
be demonstrated analysis, theaddition
the best controlled iceof
ratio
cream exhibited the worst resistance to melting.
T. fuciformis powder was 0.9% and that the overall properties were the most suitable with the fresh
base and the fruiting body ice cream in this study.
25
(a) Avrami-Erofeev's kinetic equation
0
2 oC/min-experimental
-25
2 oC/min-simulation
Heat production (kJ/kg)
-50
-75
-100
-125
-150
-175
-200
6 oC/min-experimental 4 oC/min-experimental
-225
Appl. Sci. 2020, 10, x FOR PEER REVIEW
6 oC/min-simulation 4 oC/min-simulation 11 of 14
-250
0 5 10 15 20 25 30 35 40 45 50 55 60
Time (min)
25
2 oC/min-experimental
(b) Proto-kinetic equation
2 oC/min-simulation
0
-25
Heat production (kJ/kg)
-50
-75
-100
-125
-150
-175
-200
-225 6 oC/min-experimental 4 oC/min-experimental
6 oC/min-simulation 4 oC/min-simulation
-250
0 5 10 15 20 25 30 35 40 45 50 55 60
Time (min)
Figure 5. Selected fresh TF ice cream heat production versus time curves with DSC various heating rates
of 2, 4, and 6 ◦ C/min by comparing (a) Avrami-Erofeev’s kinetic and (b) Proto-kinetic model simulation.
Figure 5. Selected fresh TF ice cream heat production versus time curves with DSC various heating
rates of 2, 4, and
3.5. Physicochemical 6 °C/min
Qualities byFuciformis
of T. comparingIce
(a)Cream
Avrami-Erofeev’s kinetic and (b) Proto-kinetic model
simulation.
Physical characteristics and chemical composition of T. fuciformis ice cream are listed in Table 5.
There Theare no significant
above results differences
match wellinwith pH, the
L value,
actuala melting
value, WI value,
rate ash, fat and
measurement water-insoluble
results. In addition,
dietary
comparing the various exceptional addition ratios of 300 mesh T. fuciformis powder (0.4, results,
fiber between the two fresh TF base and 300 mesh TFP-0.9% ice creams. In all analysis 0.9, and
the WI value
1.4%), is an that
it is shown important quality
the higher characteristic
the amount of 1.4%ofaddition,
productsthethat influences
better the food
the stability. Evenchoices
whenof the
consumers.
addition amountIt was very sure,
is high, thethat
anti-melting various T.isfuciformis
mixing in property good, butpowder did had
this study not affect the appearance
to consider the results
ofofice
thecream
sensory in this study. Moreover, from
evaluation. adding T. fuciformis
Table will increase
4, we selected the resultstheofviscosity and decrease
the proto-kinetic model
the hardnesscomparison,
simulation of ice cream.which T. fuciformis
Here,indicated powder
the fresh TF,and
freshwater have
TF base andanthe
affinity
0.9% T.with each other
fuciformis to
powder;
inhibit
there thewereformation of largesimilar
exceptionally ice crystals whichkinetic
melting affects parameters.
the texture state
From andthe
alsocomparison
enhances the ofmelting
sensory
resistance
evaluation of and
ice cream
melting [1]. T. fuciformis
kinetic analysisisresults,
rich initpolysaccharides;
can be demonstrated the viscosity will addition
that the best increase when
ratio of
added to ice cream
T. fuciformis powder[26].was 0.9% T.
Because andfuciformis
that theisoverall
rich in polysaccharides,
properties were when
the mostit issuitable
added into icethe
with cream,
fresh
the viscosity of ice cream can be increased.
base and the fruiting body ice cream in this study. However, the protein, water-soluble dietary fiber, and
polysaccharide of the fresh TF base and 300 mesh TFP ice cream are higher content than the control ice
3.5. Physicochemical Qualities of T. Fuciformis Ice Cream
Physical characteristics and chemical composition of T. fuciformis ice cream are listed in Table 5.
There are no significant differences in pH, L value, a value, WI value, ash, fat and water-insoluble
dietary fiber between the two fresh TF base and 300 mesh TFP-0.9% ice creams. In all analysis results,
the WI value is an important quality characteristic of products that influences the food choices ofAppl. Sci. 2020, 10, 2664 12 of 14
cream due to the addition T. fuciformis. The components such as T. fuciformis were added to the ice
cream to increase the functionality and improve the nutritional value.
Table 5. Physical characteristics and chemical composition of T. fuciformis ice creams.
Control Fresh TF Base 300 Mesh TFP-0.9%
Physical characteristics
pH 6.91 ± 0.03a 6.69 ± 0.05b 6.80 ± 0.12ab
Color coordinate L 82.36 ± 2.77a 81.98 ± 0.76a 79.54 ± 0.42a
a 3.01 ± 0.29a 3.38 ± 0.18a 3.37 ± 0.02a
b 8.66 ± 0.48b 10.89 ± 1.08a 10.38 ± 0.91ab
WI 82.84 ± 1.27a 82.77 ± 2.74a 80.29 ± 0.88a
Hardness (N/mm2 ) 3.44 ± 0.53a 1.67 ± 0.49b 2.33 ± 0.48b
Viscosity (cp) 35.40 ± 0.11c 558.05 ± 10.25a 410.10 ± 17.98b
Chemical composition
Dry matter (%) 26.08 ± 1.01c 43.88 ± 1.87a 39.95 ± 1.68b
Ash (DM, %) 0.51 ± 0.01a 0.50 ± 0.01a 0.50 ± 0.02a
Fat (DM, %) 55.02 ± 3.31a 53.67 ± 2.66a 54.99 ± 3.03a
Protein (DM, %) 16.13 ± 0.38c 17.84 ± 0.15a 17.24 ± 0.25b
Water-soluble dietary fiber (DM, %) 0.09 ± 0.02b 0.19 ± 0.02a 0.16 ± 0.01a
Water-insoluble dietary fiber (DM, %) 0.23 ± 0.06a 0.27 ± 0.04a 0.24 ± 0.04a
Polysaccharide (DM, mg/g) 113.40 ± 2.38c 200.50 ± 1.31b 281.01 ± 5.48a
L, lightness, a, greenness/redness, b, blueness/yellowness, WI, whiteness index; DM, dry matter. 1 replicate of each
of 3 independently treated samples and each value is expressed as mean ± SD. Means with different letters within a
column differ significantly (P < 0.05).
4. Conclusions
A sensory evaluation was performed among ice creams with fresh fruit body, fresh base, and
300 mesh powder of T. fuciformis as a stabilizer, to determine which generated a better taste. The addition
of T. fuciformis powders of various particle sizes was compared to the sensory evaluation of ice cream and
anti-melting characteristics, and the addition of 300 mesh powder yielded a better taste. Furthermore,
we compared the amount of 300 mesh powder suitable for the addition and the addition ratio at
0.9% produced a better mouthfeel. From the results of the melting kinetic analysis, it was again
proven that the fresh fruit body, the fresh base, and the 0.9% additive ratio of 300 mesh powder of
T. fuciformis ice cream presented exceptionally similar melting kinetic parameters. Meanwhile, the
higher the amount of sucrose added, the worse the anti-melting stability of the ice cream; when the
addition was 10% or more, the ice product could be measured ca. −33 ◦ C, and the glass transition
phenomenon appeared. This can be applied to the processing of ice dessert with respect to the addition
of sucrose and the anti-melting relation. Overall, we used Avrami–Erofeev’s kinetic and Proto-kinetic
model simulations to successfully determine the differences in the kinetic parameters of ice cream
melting with the addition of various T. fuciformis stabilizers. This information can be provided to food
processing industries for the improvement and development of frozen dessert processing technology.
Author Contributions: Data curation, G.J.T. and C.-Y.L.; Conceptualization, S.-Y.T.; Methodology, C.-P.L.; Y.-T.H.;
Writing—original draft preparation, C.-P.L.; Writing—review and editing, S.-Y.T. All authors have read and agreed
to the published version of the manuscript.
Funding: The authors are grateful to the Ministry of Science and Technology (MOST) and Asia University (ASIA)
under the contract No.: MOST 106-2221-E-468-013-, 107-2221-E-468-007-MY2 and ASIA-108-CMUH-02.
Acknowledgments: We are grateful to Mid-Sum Biotechnology Co. Ltd. for providing the Tremella fuciformis.
Conflicts of Interest: The authors declare no conflict of interest.Appl. Sci. 2020, 10, 2664 13 of 14
References
1. Kurt, A.; Atalar, I. Effects of quince seed on the rheological, structural and sensory characteristics of ice
cream. Food Hydrocoll. 2018, 82, 186–195. [CrossRef]
2. Calligaris, S.; Marino, M.; Maifreni, M.; Innocente, N. Potential application of monoglyceride structured
emulsions as delivery systems of probiotic bacteria in reduced saturated fat ice cream. LWT-Food Sci Technol.
2018, 96, 329–334. [CrossRef]
3. Öztürk, H.İ.; Demirci, T.; Akın, N. Production of functional probiotic ice creams with white and dark blue
fruits of Myrtus communis: The comparison of the prebiotic potentials on Lactobacillus casei 431 and functional
characteristics. LWT-Food Sci. Technol. 2018, 90, 339–345.
4. Balthazar, C.F.; Silva, H.L.A.; Esmerino, E.A.; Rocha, R.S.; Moraes, J.; Carmo, M.A.V.; Azevedo, L.;
Camps, I.K.D.; Abud, Y.; Sant’Anna, C.; et al. The addition of inulin and Lactobacillus casei 01 in sheep milk
ice cream. Food Chem. 2018, 246, 464–472. [CrossRef] [PubMed]
5. Pintor-Jardines, A.; Arjona-Román, J.L.; Totosaus-Sánchez, A.; Severiano-Pérez, P.; González-González, L.R.;
Escalona-Buendia, H.B. The influence of agave fructans on thermal properties of low-fat, and low-fat and
sugar ice cream. LWT-Food Sci. Technol. 2018, 93, 679–685. [CrossRef]
6. Kataria, A.; Achi, S.C.; Halami, P.M. Effect of encapsulation on viability of Bifidobacterium longum CFR815j
and physiochemical properties of ice cream. Indian J. Microbiol. 2018, 58, 248–251. [CrossRef] [PubMed]
7. Cheng, J.; Cui, J.; Ma, Y.; Yan, T.; Wang, L.; Li, H.; Li, X. Effects of soy-to-milk protein ratio and sucrose fatty
acid ester addition on the stability of ice cream emulsions. Food Hydrocoll. 2016, 60, 425–436. [CrossRef]
8. Moriano, M.E.; Alamprese, C. Organogels as novel ingredients for low saturated fat ice creams. LWT-Food
Sci. Technol. 2017, 86, 371–376. [CrossRef]
9. Moriano, M.E.; Alamprese, C. Honey, trehalose and erythritol as sucrose-alternative sweeteners for artisanal
ice cream. A pilot study. LWT-Food Sci. Technol. 2017, 75, 329–334. [CrossRef]
10. Hiranrangsee, L.; Kumaree, K.K.; Sadiq, M.B.; Anal, A.K. Extraction of anthocyanins from pericarp and lipids
from seeds of mangosteen (Garcinia mangostana L.) by ultrasound-assisted extraction (UAE) and evaluation
of pericarp extract enriched functional ice-cream. J. Food Sci. Technol. 2016, 53, 3806–3813. [CrossRef]
11. Azari-Anpar, M.; Khomeiri, M.; Ghafouri-Oskuei, H.; Aghajani, N. Response surface optimization of low-fat
ice cream production by using resistant starch and maltodextrin as a fat replacing agent. J. Food Sci. Technol.
2017, 54, 1175–1183. [CrossRef] [PubMed]
12. Azari-Anpar, M.; Tehrani, N.S.; Aghajani, N.; Khomeiri, M. Optimization of the new formulation of ice
cream with native Iranian seed gums (Lepidium perfoliatum and Lepidium sativum) using response surface
methodology (RSM). J. Food Sci. Technol. 2017, 54, 196–208. [CrossRef] [PubMed]
13. Kurt, A.; Cengiz, A.; Kahyaoglu, T. The effect of gum tragacanth on the rheological properties of salep based
ice cream mix. Carbohydr. Polym. 2016, 143, 116–123. [CrossRef] [PubMed]
14. Tsai, S.Y.; Huang, F.K.; Juan, H.W.; Lin, C.P. Evaluation of food-processing conditions of various particle
sizes of Tremella fuciformis powder via DSC and TG analyses. J. Therm. Anal. Calorim. 2018, 134, 857–864.
[CrossRef]
15. Cheung, P.C. Mini-review on edible mushrooms as source of dietary fiber: Preparation and health benefits.
Food Sci. Hum. Wellness 2013, 2, 162–166. [CrossRef]
16. Zhang, N.; Chen, H.; Zhang, Y.; Xing, L.; Li, S.; Wang, X.; Sun, Z. Chemical composition and antioxidant
properties of five edible Hymenomycetes mushrooms. Int. J. Food Sci. Technol. 2015, 50, 465–471. [CrossRef]
17. Li, H.; Lee, H.S.; Kim, S.H.; Moon, B.; Lee, C. Antioxidant and antiinflamatory activities of methanol extracts
of Tremella fuciformis and its major phenolic acids. J. Food Sci. 2014, 79, 460–468. [CrossRef]
18. Wu, Y.J.; Wei, Z.X.; Zhang, F.M.; Linhardt, R.J.; Sun, P.L.; Zhang, A.Q. Structure, bioactivities and applications
of the polysaccharides from Tremella fuciformis mushroom: A review. Int. J. Biol. Macromol. 2019, 121,
1005–1010. [CrossRef]
19. Han, C.K.; Chiang, H.C.; Lin, C.Y.; Tang, C.H.; Lee, H.; Huang, D.D.; Zeng, Y.R.; Chuang, T.N.; Huang, Y.L.
Comparison of immunomodulatory and anticancer activities in different strains of Tremella fuciformis Berk.
Am. J. Chin. Med. 2015, 43, 1637–1655. [CrossRef]
20. Ban, S.; Lee, S.L.; Jeong, H.S.; Lim, S.M.; Park, S.; Hong, Y.S.; Kim, J.E. Efficacy and safety of Tremella fuciformis
in individuals with subjective cognitive impairment: A randomized controlled trial. J. Med. Food. 2018, 21,
400–407. [CrossRef]Appl. Sci. 2020, 10, 2664 14 of 14
21. Politowicz, J.; Lech, K.; Lipan, L.; Figiel, A.; Carbonell-Barrachina, Á.A. Volatile composition and sensory
profile of shiitake mushrooms as affected by drying method. J. Sci. Food Agric. 2018, 98, 1511–1521. [CrossRef]
[PubMed]
22. Tsai, S.Y.; Yang, J.H.; Tseng, Y.H.; Lee, C.E.; Mau, J.L. Quality of silver ear steamed bun. J. Food Process.
Preserv. 2010, 34, 649–663. [CrossRef]
23. Cha, M.H.; Heo, J.Y.; Lee, C.; Lo, Y.M.; Moon, B. Quality and sensory characterization of white jelly mushroom
(Tremella fuciformis) as a meat substitute in pork patty formulation. J. Food Process. Preserv. 2014, 38, 2014–2019.
[CrossRef]
24. Lin, C.P.; Tsai, S.Y. Differences in the moisture capacity and thermal stability of Tremella fuciformis
polysaccharides obtained by various drying processes. Molecules 2019, 24, 2856. [CrossRef] [PubMed]
25. Tsai, S.Y.; Lin, H.Y.; Hong, W.P.; Lin, C.P. Evaluation of preliminary causes for vitamin D series degradation
via DSC and HPLC analyses. J. Therm. Anal. Calorim. 2017, 130, 1357–1369. [CrossRef]
26. Tsai, S.Y.; Hwang, B.F.; Wang, Y.H.; Lin, C.P. Moisture desorption and thermal properties of polysaccharide
from pulsed light irradiated Flammulina velutipes. J. Therm. Anal. Calorim. 2017, 127, 469–481. [CrossRef]
© 2020 by the authors. Licensee MDPI, Basel, Switzerland. This article is an open access
article distributed under the terms and conditions of the Creative Commons Attribution
(CC BY) license (http://creativecommons.org/licenses/by/4.0/).You can also read