Astro2020 Science White Paper Insights Into the Epoch of Reionization with the Highly-Redshifted 21-cm Line - arXiv
←
→
Page content transcription
If your browser does not render page correctly, please read the page content below
Astro2020 Science White Paper

Insights Into the Epoch of Reionization with the
Highly-Redshifted 21-cm Line
Thematic Areas:               ☐ Planetary Systems    ☐ Star and Planet Formation
 ☐Formation and Evolution of Compact Objects          ☒ Cosmology and Fundamental Physics
 ☐Stars and Stellar Evolution ☐Resolved Stellar Populations and their Environments
 ☒Galaxy Evolution            ☐Multi-Messenger Astronomy and Astrophysics

Principal Author:
Name: Steven Furlanetto
Institution: University of California, Los Angeles
Email: sfurlane@astro.ucla.edu
Phone: (310) 206-4127

Co-authors:
Chris L. Carilli (Cavendish Laboratory, NRAO), Jordan Mirocha (McGill University), James
Aguirre (University of Pennsylvania), Yacine Ali-Haimoud (New York University), Marcelo
Alvarez(University of California Berkeley), Adam Beardsley (Arizona State University),
George Becker (University of California Riverside), Judd D. Bowman (Arizona State
University), Patrick Breysse (CITA), Volker Bromm (University of Texas at Austin), Philip
Bull (Queen Mary University of London), Jack Burns (University of Colorado Boulder),
Isabella P. Carucci (University College London), Tzu-Ching Chang (JPL), Xuelei Chen
(National Astronomical Observatory of China), Hsin Chiang (McGill University), Joanne
Cohn (University of California Berkeley), Frederick Davies (University of California Santa
Barbara), David DeBoer (University of California Berkeley), Joshua Dillon (University of
California Berkeley), Olivier Doré (JPL, California Institute of Technology), Cora Dvorkin
(Harvard University), Anastasia Fialkov (University of Sussex), Nick Gnedin (Fermilab),
Bryna Hazelton (University of Washington), Daniel Jacobs (Arizona State University), Kirit
Karkare (University of Chicago/KICP), Saul Kohn (The Vanguard Group), Leon Koopmans
(Kapteyn Astronomical Institute), Ely Kovetz (Ben-Gurion University), Paul La Plante
(University of Pennsylvania), Adam Lidz (University of Pennsylvania), Adrian Liu (McGill
University), Yin-Zhe Ma (University of KwaZulu-Natal), Yi Mao (Tsinghua University),
Kiyoshi Masui (MIT Kavli Institute for Astrophysics and Space Research), Matthew
McQuinn (University of Washington), Andrei Mesinger (Scuola Normale Superiore),
Julian Munoz (Harvard University), Steven Murray (Arizona State University), Aaron
Parsons (University of California Berkeley), Jonathan Pober (Brown University),
Benjamin Saliwanchik (Yale University), Jonathan Sievers (McGill University), Eric Switzer
(NASA Goddard Space Flight Center), Nithyanandan Thyagarajan (NRAO), Hy Trac
(Carnegie Mellon University), Eli Visbal (Flatiron Institute), Matias Zaldarriaga (Institute
for Advanced Study)

Abstract: The epoch of reionization, when photons from early galaxies ionized the
intergalactic medium about a billion years after the Big Bang, is the last major
phase transition in the Universe’s history. Measuring the characteristics of the
transition is important for understanding early galaxies and the cosmic web and
for modeling dwarf galaxies in the later Universe. But such measurements require
probes of the intergalactic medium itself. Here we describe how the 21-cm line of
neutral hydrogen provides a powerful probe of the reionization process and
therefore important constraints on both the galaxies and intergalactic absorbers
at that time. While existing experiments will make precise statistical
measurements over the next decade, we argue that improved 21-cm analysis
techniques – allowing imaging of the neutral gas itself – as well as improved
theoretical models, are crucial for testing our understanding of this important era.
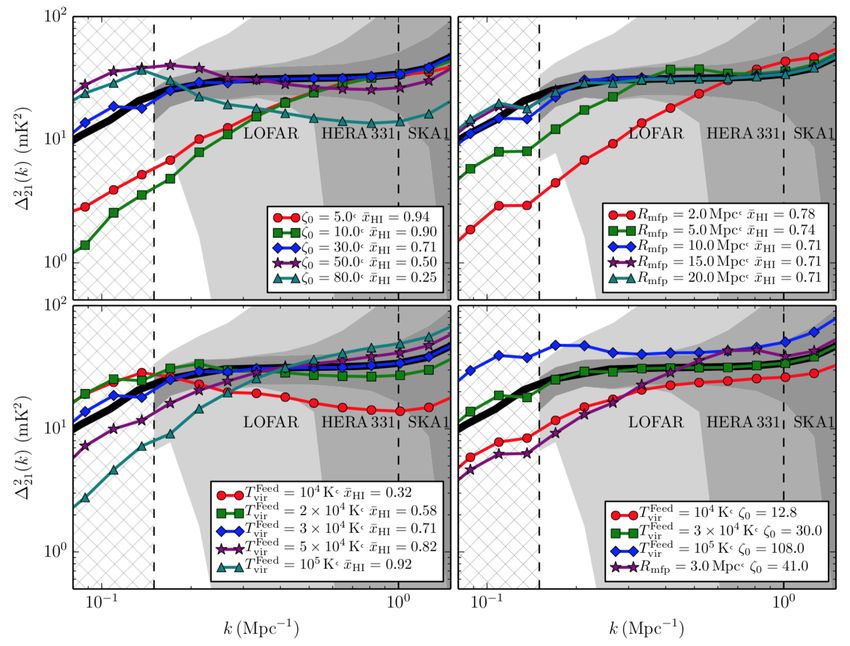
Fig. 1: The 21-cm line provides a detailed history of reionization. These slices through a semi-
numeric simulation show the 21-cm signal expected at four different points during reionization
(at ionized fractions xi = 0.86, 0.65, 0.38, and 0.20 from left to right). Black regions are ionized;
the colorscale shows 21-cm intensity. This slice is 143 Mpc across. Courtesy A. Mesinger.

   I.      INTRODUCTION

Reionization, when early generations of stars and (possibly) quasars ionized the intergalactic
medium (IGM) about one billion years after the Big Bang, is one of the landmark events in the
cosmic timeline. It is the most recent global phase transition in the Universe’s history – the
moment when galaxy formation affected every baryon in the Universe. It is accompanied by
substantial photoheating that affects later generations of galaxies – including dwarf galaxies near
the Milky Way. It reflects the early growth of the metagalactic radiation background, whose
properties are important for the IGM to the present day. And, most importantly, it is the hallmark
event of the first generations of galaxies, when those early sources transformed the Universe
into the state we find it today. It is a sensitive probe of their properties and especially of their
interactions with the IGM.
       Observations are beginning to probe the reionization era, a massive improvement from a
decade ago – though there are still few quantitative constraints. Scattering of the cosmic
microwave background by electrons after reionization provides an integrated constraint on the
reionization history that indicates it ended relatively late (z~6) [1]. A decline in the apparent
abundance of Ly-α emitting galaxies at z~7 may indicate that the Universe had a large neutral
fraction at that point (e.g., [2-5]). Observations of Ly-α absorption toward high-redshift quasars
also appear to indicate substantial reservoirs of neutral gas at z~7 (e.g., [6-7]).
       Though these observations paint a consistent picture, they do not yet provide a complete
timeline of reionization. Because reionization depends on the integrated galaxy population, even
its earliest stages are important probes of galaxy evolution. Moreover, the reionization process –
its progress and morphology – is a sensitive probe of the interaction of those sources with the
IGM. Ideally, we would like to watch the process unfold. The best way to do this is with the 21-
cm line of neutral hydrogen, which could allow us to map the IGM throughout reionization, as
illustrated in Fig. 1 (e.g., [8-10]).
       Such measurements have important implications for a wide range of astrophysical
phenomena. The reionization history accessible via the 21-cm line will improve our interpretation
of galaxy evolution (for example, in understanding the lack of recent star formation in many
dwarf galaxies near the Milky Way as well as the properties of Lyman-α emitters at z>5), as a

                                                 3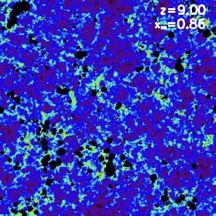
baseline for understanding IGM physics at later times (in particular the thermal history and
ionizing background), and cosmology (for which the ionization history is a “nuisance” parameter
in CMB measurements; [11]).
      In this white paper, we argue that measurements of the reionization history through the
21-cm line will open a new window onto the early Universe. Here we focus on measurements of
the reionization process here; companion white papers by Furlanetto et al. and La Plante et al.
place this signal in the context of other high-redshift probes, while Mirocha et al. describe how
21-cm measurements will shed light on the earliest luminous sources in the Universe.

Fig. 2: The 21-cm power spectrum is sensitive to the unknown properties of high-redshift
sources. In each panel, the curves show the power spectrum for different models of
reionization. In all cases, the black curve is a fiducial model with xHI=0.74 at z=9. Each panel
varies different parameters: the ionizing efficiency (upper left), amount of IGM absorption
(upper right), the minimum virial temperature of galaxies (lower left), and a variety of
parameter choices that all produce xHI=0.74. From [12].

   II.     OPPORTUNITIES FOR THE NEXT DECADE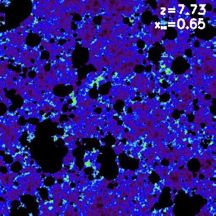
Low-frequency radio observatories are now finally reaching the stage where they can make these
measurements. [13] reported the first detection of the sky-averaged 21-cm signal with the EDGES
instrument. If confirmed, the detection requires substantial revision to our understanding of the
Cosmic Dawn (e.g., [14-16]), but the implications of the measurement also point to the insights
to be gained from 21-cm measurements. A number of other observatories are now operating
(such as LOFAR [17]), under construction (such as the Hydrogen Epoch of Reionization Array, or
HERA; [18]), or in the planning stages (such as SKA-Low).
       The first generations of 21-cm observatories will attempt to measure the statistical
properties of the 21-cm background – specifically, its power spectrum. Fig. 2 shows an example
of the effectiveness of this probe [12]. It uses a simple “semi-numerical” model of the reionization
process, with only three free astrophysical parameters, to demonstrate the sensitivity of the
power spectrum to the underlying astrophysics. The upper left panel shows how the power
spectrum changes with the overall ionizing efficiency of galaxies; the dashed lines demarcate the
region accessible to near-future experiments, while the grey bands show projected errors. The
power spectrum measures the overall ionization state of the Universe and can therefore trace
the reionization history. This history is a crucial component of understanding the early Universe,
and its measurement is the primary near-term goal of 21-cm telescopes like HERA.
       The other panels in Fig. 2 show that the power spectrum contains even more information:
the upper right panel shows how IGM absorption affects the power spectrum, while the lower
left shows how the minimum size of galaxies affects it in this model. The lower right panel shows
that, even when the ionized fraction is fixed, these astrophysical parameters cause measurable
differences in the power spectrum.
       More broadly, the topology of reionization – and therefore the 21-cm signal – is sensitive
to many of the integrated properties of the source population, including the galaxy masses and
ionizing efficiencies and the source spectra, which depends on whether quasars contribute to the
process [39-40]. It is also sensitive to IGM absorption, which is likely dominated by small, dense
pockets in the cosmic web that remain optically thick. These regions, known at later times as
Lyman-limit systems, regulate the end of the reionization process, and understanding their
evolution is critical to understanding how the ionizing background was established, which
contains relics of reionization even after that process was complete [19-20].
       Because of the rich astrophysics driving the 21-cm signal, interpreting these early statistical
results will not be straightforward. Statistical measurements must be interpreted in comparison
to theoretical models, which are simplified not only because of practical concerns (like computing
power) but also because our knowledge of the source population and IGM is so limited at these
times [12, 21]. While careful statistical analysis of the power spectrum can, for example, tightly
constrain the parameters of a simple galaxy formation model as shown in Fig. 2, testing the
assumptions of both galaxy formation and IGM models – or, better, making model-independent
measurements – will in turn require more advanced observations. The recent EDGES observation
serves as a good example of the challenge: the measurement did not match existing models of
galaxy formation. Interpreting it therefore requires the introduction of new source populations
(e.g., [15,22]): even the first 21-cm observation outstripped existing models, demonstrating how
hard theory must work in order to keep up with the real world!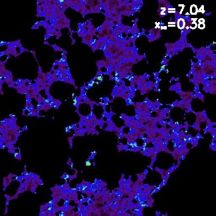
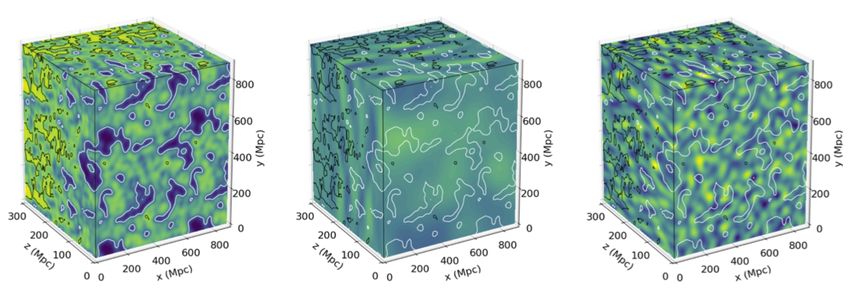
Fig. 3: Improvements in 21-cm analysis pipelines are essential for testing reionization models.
The left panel shows a simulation of reionization, with the blue regions ionized and the
colorscale showing 21-cm intensity. The white and black contours outline ionized and neutral
regions, respectively – also shown in the other panels. The center panel shows a simulated
HERA image of the same region, assuming existing analysis procedures. The right panel shows
the same but assumes improved foreground removal. Note how the resolution and fidelity of
the observation improves significantly because of the pipeline. Credit: A. Beardsley.

   III.    KEY SCIENCE ADVANCES

Other statistics will undoubtedly prove useful in this regard [23-25], but the ultimate goal is to
make high signal-to-noise images of the 21-cm background, which can probe the detailed physics
in a model-independent manner.
       The fundamental challenge in reaching this goal is to separate the (weak) cosmological
signal from astrophysical foregrounds, which are four or more orders of magnitude brighter.
“Foreground avoidance” techniques isolate this contamination within a data cube and allow
statistical measurements and even some “imaging” (see the center panel of Fig. 3 for an example)
[26-27]. However, foregrounds contaminate most of the interferometric data, so existing
techniques provide only low signal-to-noise and poor fidelity, even on coarse angular scales of
tens of arcminutes. The development of algorithms to remove more of the foregrounds from the
contaminated region (known as the wedge in Fourier space), and hence retain more of the data,
is essential for probing the details of reionization (see the right panel of Fig. 3).
       Imaging, or more advanced statistical measurements, will enable more precise tests of
the reionization process and source properties. Some of these tests are best made in
comparison to the galaxy population and are described in another white paper by Furlanetto et
al. But many can be made with the 21-cm data alone. For example, some simple tests enabled by
imaging include: (1) Measuring the sizes and environments of the last remaining neutral regions
will establish how reionization ends and show how the cosmic web develops; the fluctuations in
the ionizing background induced by these regions persist after reionization is likely over [19-20,
28-29]. (2) The size distribution of ionized regions measures the details of the source-absorber
relationship [12,30-31, 39-40] (3) Topological measurements of the ionized structure provide a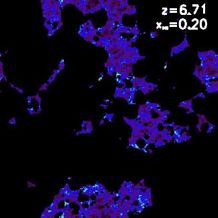
probe of source clustering [32-34]. (4) Identifying large ionized regions will offer unprecedented
direct constraints on quasar lifetime and geometry [35-36]. (5) The identification of individual
ionized regions will greatly enhance our trust in the 21-cm measurements.
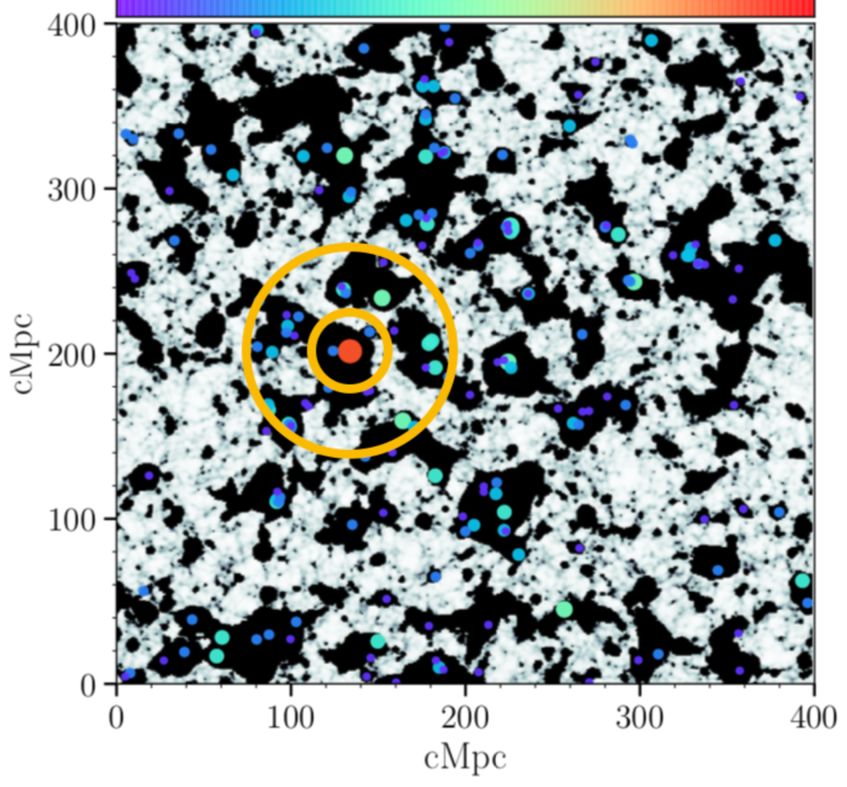
Fig. 4: The identification of HII
regions around luminous quasars
during the epoch of reionization will
provide unprecedented insight into
their properties. Here we a slice
through a semi-numerical simulation
near the midpoint of reionization
(where black areas are ionized).
Colored dots identify massive halos. If
a luminous quasar turned on in the
red halo, the extent of the ionized
region would provide a direct
measurement of its lifetime (the
yellow circles show approximate radii
after 106.5 or 108 years), while the
region’s shape (measured in three
dimensions thanks to redshift
information) would constrain the
emission pattern. Adapted from [6].
Of course, these precision observations will also challenge our theoretical models of both
galaxy formation and reionization. We therefore also require continued development of those
models. These include numerical simulations of galaxy formation in this high-redshift regime as
well as of the reionization process. Because the foreground problem is less difficult at high
frequencies, imaging will likely first constrain the end of the reionization process. Recent
observations [19] suggest that this epoch requires more sophisticated models of the cosmic web
and ionizing background than currently available [20,28]. Given the many uncertainties in both
galaxy formation and IGM absorption, rapid approximate techniques (including both analytic
models [37] and “semi-numeric” simulations like 21cmFAST; [38]) will also be required to
interpret the results and identify key observational strategies. A set of diverse, physically-
motivated models, combined with detailed 21-cm observations and “orthogonal” constraints
from other techniques, provides our best bet for understanding the early universe.
IV. CONCLUSIONS
The 21-cm line has enormous potential to open the reionization era to detailed study. Statistical
measurements are now on the horizon, but these will provide only the first steps in a detailed
understanding of the reionization process. Continued development of analysis techniques for
21-cm measurements, opening access to the imaging regime, as well as improved theoretical
models of the era, will enable huge strides in our understanding of the first galaxies.References
[1] Planck Collaboration 2018, arXiv.org/1807.06209.
[2] Stark, D. et al. 2010, MNRAS, 408, 1628.
[3] Pentericci, L. 2018, A&A, 619, 147.
[4] Mason, C. A. et al. 2019, arXiv.org/1901.11045.
[5] Hoag, A. et al. 2019, arXiv.org/1901.09001.
[6] Davies, F.B. et al. 2018, ApJ, 864, 142.
[7] Bolton, J.S. et al. 2011, MNRAS, 416, L70.
[8] Furlanetto, S.R., Oh, S.P, & Briggs, F.H. 2006, Phys. Rep., 433, 181.
[9] Morales, M.F. & Wyithe, J.S.B. 2010, ARAA, 48, 127.
[10] Pritchard, J.R. & Loeb, A. 2012, Rep. Prog. Phys. 75, 6901.
[11] Liu, A. et al. 2016, PRD, 93, 3013.
[12] Greig, B. & Mesinger, A. 2015, MNRAS, 449, 4246.
[13] Bowman, J. et al. 2018, Nature, 555, 67.
[14] Barkana, R. 2018, Nature, 555, 71.
[15] Mirocha, J. & Furlanetto, S.R., MNRAS, 483, 1980.
[16] Kaurov, A. et al. 2018, ApJ, 864, L15.
[17] Koopmans, L.V.E. et al. 2018, IAUS, 333, 71.
[18] DeBoer, D.R. et al. 2017, PASP, 129, 5001.
[19] Becker, G. et al. 2018, ApJ, 863, 92.
[20] Weinberger, L.H., Haehnelt, M.G. & Kulkarni, G. 2019, MNRAS, in press.
[21] Park, J. et al. 2019, MNRAS, 484, 933.
[22] Schauer, A.T.P., Liu, B. & Bromm, V. 2019, arXiv.org/1901.03344.
[23] Bean, A. Villaescusa-Navarro, F., & Lidz, A. 2018, arXiv.org/1811.10609.
[24] Barkana, R. & Loeb, A. 2008, MNRAS, 384, 1069.
[25] Shimabukuro, H. et al. 2017, MNRAS, 468, 1542.
[26] Liu, A., Parsons, A.R., & Trott, C.M. 2014, PRD, 90, 3018.
[27] Liu, A., Parsons, A.R., & Trott, C.M. 2014, PRD, 90, 3019.
[28] Davies, F.B. & Furlanetto, S.R. 2016, MNRAS, 460, 1328.
[29] D’Aloisio, A. et al. 2018, MNRAS, 473, 560.
[30] Furlanetto, S.R & Oh, S.P. 2005, MNRAS, 363, 1031.
[31] Kaurov, A.A. & Gnedin, N.Y. 2013, ApJ, 771, 35.
[32] Furlanetto, S.R. & Oh, S.P. 2016, MNRAS, 457, 1813.
[33] Bag, S. et al. 2018, MNRAS, 477, 1984.
[34] Chen, Z. et al. 2018, arXiv.org/1812.10333.
[35] Wyithe, J.S.B., Loeb, A. & Barnes, D.G. 2005, ApJ, 634, 715.
[36] Wyithe, J.S.B. & Loeb, A. 2004, ApJ, 610, 117.
[37] McQuinn, M. & D’Aloisio, A. 2018, JCAP, 10, 16.
[38] Mesinger, A., Furlanetto, S.R. & Cen, R. 2011, MNRAS, 411, 955.
[39] McQuinn, M. et al. 2007, MNRAS, 377, 1043.
[40] Furlanetto, S.R., McQuinn, M. & Hernquist, L. 2006, MNRAS, 365, 115.
8You can also read