August 2018 Acknowledgements for community survey component: Thinkfield - Review of Extended General Retail Trading Hours in the City of Greater ...
←
→
Page content transcription
If your browser does not render page correctly, please read the page content below
Review of Extended General Retail Trading
Hours in the City of Greater Geraldton
August 2018

Prepared by Progress Economics on behalf of the City of Greater Geraldton

Acknowledgements for community survey component: Thinkfield
Contents
Executive Summary ...................................................................................................................................................... 3
Background ...................................................................................................................................................................... 4
    Report Focus ............................................................................................................................................................... 5
    Economic Context ..................................................................................................................................................... 5
    General Trends Affecting the Retail Sector.................................................................................................... 6
    Key Stakeholders and Key Issues....................................................................................................................... 8
Data Sources, Methods and Results ..................................................................................................................... 10
    Data Sources.............................................................................................................................................................. 10
         Community Survey Results............................................................................................................................ 11
         Independent Business Survey ...................................................................................................................... 12
         Additional Polling of Businesses by Local Industry Associations................................................. 20
         Activity in the CBD............................................................................................................................................. 21
         Visitor Centre Data ............................................................................................................................................ 25
    Employment .............................................................................................................................................................. 26
    Tourism ....................................................................................................................................................................... 29
Key Findings, Summary and Conclusions ......................................................................................................... 30
Additional Information and Considerations .................................................................................................... 31
Appendix ......................................................................................................................................................................... 32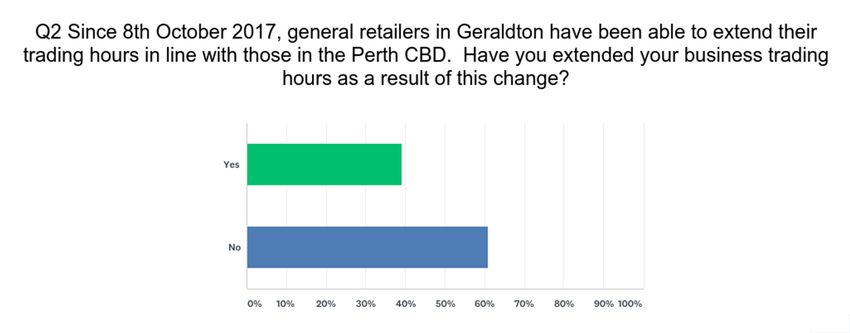
Executive Summary
In early October 2017, the City of Greater Geraldton began a twelve month period of extended
general retail trading hours in the local government area. This drew to a close a long period
of lively and robust local debate about whether a trading extension (deregulation) would be
beneficial for local economic activity, local retailers and supported by the community.

This report looks at a range of measures and surveys to try to gauge the impacts of the trial,
has been completed prior to the end of extended retail trial period, limiting the scope to
evaluate the trial from independent data sources.

The community survey results demonstrate continued, majority community support for
extended retail trading, particularly in younger and middle age categories. However, the
business survey revealed more divergent opinion, with the trial supported by national general
retailers and a small number of local businesses such as cafes and gift shops but strongly
opposed by independent general retailers and many local small businesses. Overall, there was
not majority support among the businesses sampled. The ability to decipher the business
impacts have also been hindered by the opening of new neighbourhood shopping centre with
a national supermarket anchor, in the weeks prior to the extended retail trading period. This
would naturally be expected to reduce visits t the CBD from Southern suburb residents as well
as increase competition levels in the general retail sector. According to business responses to
the survey, there were small employment losses to full time and casual employment, although
these were partially offset by some modest part time gains. It is hard to attribute these losses
given the new Wandina Centre opening, the trading extension and the general climate for the
retail sector.

In terms of tourism, particularly cruise tourism it is difficult to establish definitive impacts
within the reporting period since tourism data is typically published with long lags (and is
also subject to averaging due to survey volatility). However, it was noted that there was only
one Sunday cruise date during the trial that gave general retailers an opportunity to benefit
from passing cruise trade due to deregulated hours, where previously they would have been
prevented.

Overall, it is difficult to conclude within the reporting timelines requested whether
deregulation has had a net benefit or cost on the local economy. The timelines through which
such mechanisms could be expected to operate are naturally longer term, so it would be
recommended that deregulation impacts are monitored and reviewed over a longer term
horizon. In addition, it is recommended that some supportive efforts are directed towards the
local independent retail sector to charter these competitive forces, since it is clearly in the
interest of the local economy to have a vibrant, independent retail sector.
Background
In Western Australia, ‘retail trading hours’ provide times when retailers can open for
business. Generally, the hours a business can open is determined by the business type. The
hours for all these categories are governed by the Retail Trading Hours Act (the Act).
Some categories of retail‐like business, such as cafes, restaurants, food takeaway and short
term markets are not covered by the Act and have more flexible opening hours1. All shops are
regarded as ‘general retail’ shops unless they belong to a specific category and these
categories include small retail shops, special retail shops, filling ‐ service stations or motor
vehicle shops.
In May 2017, City of Greater Geraldton Council submitted an application to State Government
to trial deregulated ‘General Retail’ trading hours for 12 months, starting from 1 July 2017.
Council also committed to a trial review process involving stakeholders:
to test the effectiveness of deregulation as a means to stimulate economic activity and,
to ensure it was meeting community needs and preferences.
This process would include a survey of community views on retail trading hours, with a
report to Council by or before September 2018.
The twelve month trial was approved by State government in September 2017 and
commenced on 6th October 2017. This report is thus being compiled before the end of the
trial period.
In granting the trial, the Minister for Commerce and Industrial Relations office requested a
comprehensive review of the trial be submitted no later than 30 July 2018, within the trial
period.
The review was requested to identify, among other things, the trial’s impact on:
Local businesses, in particular small businesses;
Employment, specifying employment type (i.e. casual, part‐time, full‐time);
Tourism, including cruise ship visits;
1 Source: Department of Mines, Industry Regulation and Safety website, 2018.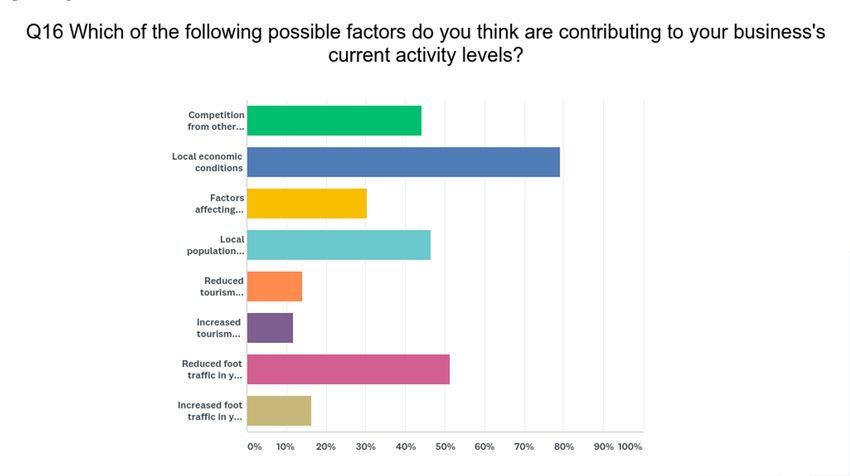
The local community, including community members' views. The purpose of this report is to assess the impacts of a relaxation of general retail trading hours in the City of Greater Geraldton as requested by Minister Bill Johnston in granting the trial. This review has been has been undertaken by Progress Economics, an independent economics consultancy based in Geraldton, with resources provided by the City of Greater Geraldton. While it is attempting to establish observable consequences from the trial less than twelve months since the trial began, it is expected that some of the impacts relating to the trial would play out over far longer timeframes than is allowed for within this report. For example, the full benefits resulting from the perception of Geraldton as being ‘open for business’ might be expected to take some time to be realised and for consequent elevated investment or tourist expenditures to feed through. This review is undertaken with a reporting deadline which falls before the end of the full extent of the trial of extended retail trading. This report can therefore only observe and comment on any effects that have been set in train within relatively short timeframes and reported or picked up by either survey processes or by independent data sources. Conventional independent data sources available through government agencies are largely published with significant lags and thus have very limited potential application within this report. Any comments on more medium term dynamics that a change in retail trading regime might set in train will largely be informed by theory, hypothesis and experience from other markets. Report Focus Clearly, the focus of the trial is an expansion of trading hours for general retail shops. While the trial is specific about the category affected by the extension of trading, there are spill‐over effects for other categories of trade and thus the review and in particular, the business survey also attempted to identify any noteworthy effects in other categories of retail and relevant trade. Economic Context The City of Greater Geraldton is the key regional centre for the Midwest region (population 54,019)2. The recent 2016 census shows population in the Greater Geraldton local government area at 38,634. Comparing the Geraldton significant urban area census populations in 2016 2 Source: 2016 census, ABS website.
and 2011 indicates relatively modest growth of approximately 0.92% between the 2016 and
2011 censuses 3 . The estimated resident population figures for 2017 compared to 2012
indicates zero growth over the recent five year period4. The local economy has been affected
by reduced activity in the resources and construction sectors, but generally has additional
exposure to agriculture, fishing, retail, logistics and multiple other sectors.

Efforts to grow tourism and to build attractiveness to visitors are also a focus for economic
development activity. Tourism Research Australia estimates that from 2013‐2016 Geraldton
hosted an estimated 502,000 visitors per annum, staying an average total of 1,047,000
nights5. Of this an estimated 400,000 nights are accounted for by visitors staying with friends
or relatives, 219,000 nights are spent in hotel accommodation and 98,000 in caravan
parks/camping grounds.

The town is also a significant stop on West Coast (and other itinerary) cruising tours and in
2018 there are 12 cruise ship visits planned with an average capacity per ship of 1,110
passengers (plus 542 crew), with the largest ship potentially holding a capacity of 2,498
passengers (plus 850 crew).

General Trends Affecting the Retail Sector
Adverse factors currently impacting the retail and consumer sectors are well documented at
the nationwide and state level and have been significantly felt in the Greater Geraldton
regional centre. While annual statistics for specific sectors such as retail are not generally
available6 for a specific region, it is reasonable to assume that retail sector activity in Greater
Geraldton will reflect broadly similar changes to the state level figures. These are captured in
the following retail sales growth chart.

3 Note the LG amalgamation between City of Geraldton and Shire of Mullewa makes direct comparison of the LG
measures between census dates more challenging.
4 Source: ABS.Stat tool, ABS website 2018. The ERP population is estimated using births and deaths data, and

ABS models to incorporate migration estimates. Census is counted from census returns but does have a degree
of missed coverage. Generally, it is believed to cover approx. 95% of the population, although this is understood
to be larger in regions with more transient populations.
5 Source: Tourism Research Australia report, 2016. Data is based on four year moving averages.

https://www.tra.gov.au/ArticleDocuments/237/Greater%20Geraldton%20(C).xlsx.aspx
6 Note ‘estimates’ of these figures are but since they based on national or state level data with only small

adjustments to the estimation made from regional employment statistics, updated with each census, there is no
actual measured change at the regional level year to year.
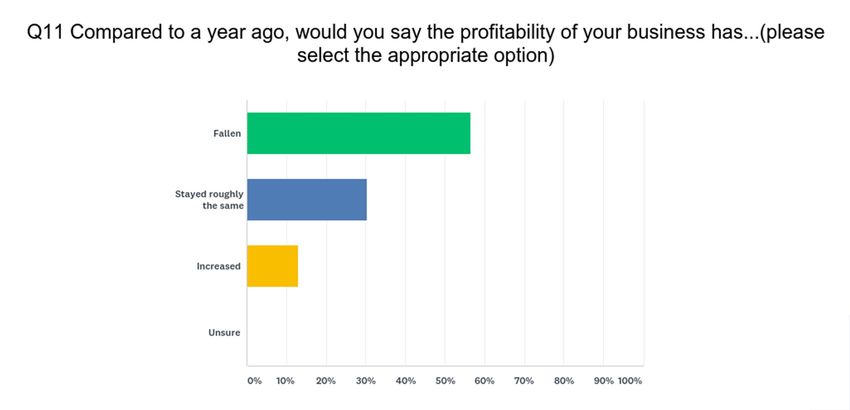
Figure 1 Retail Sales Turnover Growth

                          National and State Retail Sales Growth
                                        Seasonally adjusted, YoY Change
  8.00%
  7.00%
  6.00%
  5.00%
  4.00%
  3.00%
  2.00%
  1.00%
  0.00%
 ‐1.00%

                                                 WA        Australia

Source: Date source ABS website, calculations Progress Economics.

As can be seen even at the national level retail sales growth is falling sharply, but a starker
picture is clear in Western Australia with negative or negligible growth experienced over the
last twelve months. Understandably, this has proven to be a poor backdrop for a local
extension to retail trading hours in the City of Greater Geraldton.

Largely, this weakness has been accounted for by diminished economic activity impacting the
jobs market, slower population growth in WA, slower household earnings growth and cost of
living pressures impacting household spending levels. Uncertainty and low consumer
confidence is impacting the willingness of employed WA consumers to spend. Similar factors
are at play within the Greater Geraldton LGA.

Furthermore, while general retail sales activity is experiencing negligible growth at the state
level, retailers are experiencing considerable competitive pressure from online retail and at
the national level from new entrants to the domestic market, such as ALDI in the supermarket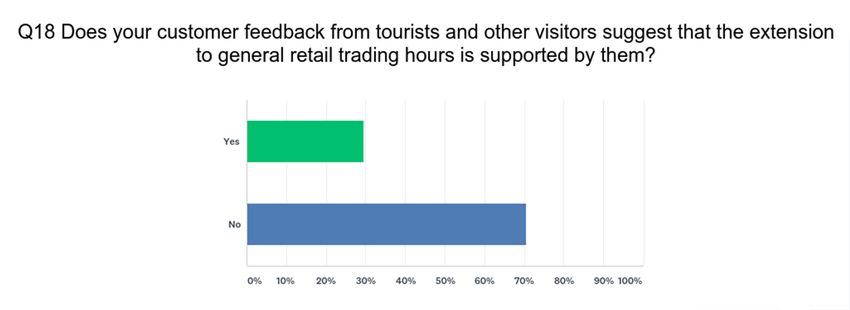
sector and other global clothing retail giants. While many of these businesses have not yet set
up in Geraldton, it is clear that local consumers now have an ever larger choice of retailers to
choose from domestically. In the retail arena, it is well publicised that this is putting pressure
on traditional ‘bricks and mortar’ retailers to engage with customers through multiple (or
omni‐)channels and this serves to benefit those retailers who are able to achieve the scale and
make the necessary investments to attempt this. For smaller retailers they must work much,
much harder through multiple channels to hold on to their existing market share.

A recent nationwide update from Australia Post7, confirmed that by the end of 2017 online
shopping accounted for 8% of traditional retail sales. Since globally this figure is understood
to be approximately 12%, we might expect this growth to continue. While nationally,
traditional retail sales grew by approximately 2.5% in 2017, online sales is reported to have
grown by 18.7% over the same period. Since 1.2m Australians or approximately 10% of the
national workforce are currently employed in retail, there will be significant impacts from
disruption to the retail sector.

Similarly, according to the 2016 census, in Greater Geraldton there were 504 people
employed in supermarkets and grocery stores and approximately 1800 employed in retail
trade as a whole (10.8% of the local workforce). The local employed total workforce was
recorded in the census as 16,701 in 2016 (and 17,256 in 2011, a 3.2% decline).

In terms of business numbers, according to Australian Business Register figures published
through the ABS, in 2017 there were 192 retail trade businesses in Greater Geraldton,
declining from 201 in 2016 and a high of 217 in 2013. Interestingly, while retail businesses
appear to have suffered a decline, accommodation and food businesses have grown over the
same timeframes from 106 in 213 to 119 in 2016 and 115 in 2017. The number of healthcare
and social assistance businesses have also shown growth over the period.

Key Stakeholders and Key Issues
The issue of extended trading hours has a lengthy and somewhat contentious history in
Greater Geraldton. In broad terms, national retailers with a local presence have been keen to
see an extension to general retail locally, given that smaller and specialist retailers already
have capacity under the Act. There is a view within the certain quarters of the community

7 See: ‘Inside Australian Online Shopping’, Australia Post (2018).

https://auspost.com.au/content/dam/auspost_corp/media/documents/2018‐ecommerce‐industry‐paper‐
inside‐australian‐online‐shopping.pdf
that more liberal trading regime within the LGA would serve to attract high profile national
retail chains which currently do not have a presence in Geraldton and this in turn would
strengthen Geraldton’s position as a significant and growing regional centre.

Smaller local retailers working in those market segments also served by national retail chains
have by and large opposed an extended general retail trading regime in Geraldton. However,
there has been broad consensus across all retailers on the need for extended retail trading
arrangements in the pre‐Christmas trading period.

The need to reconcile retail trading interests has been challenging at times for the Mid West
Chamber of Commerce and Industry (MWCCI) and likely contributed to the genesis of the
Geraldton Retail Industry Alliance (GRIA) in 2017. Significantly, the two local advocacy
organisations have cooperated during the period of the trial and have tended to align in their
public statements on the matter. They have been kept informed of the trial’s progress, the
report’s progress and key milestones through direct communications by City staff.

A key but separate aspect of the general retail trading extension has been the issue of local
resident sentiment towards the extension. The City of Greater Geraldton in its community
plan is aiming:
    ‐ To promote ‘Greater Geraldton and its potential business opportunities to facilitate
        targeted economic development’,
    ‐ ‘to foster a community were local business is supported’ and,
    ‐ Is also aiming to ‘revitalise the CBD economic, social and cultural vibrancy’ among
        other things.
It has committed to ‘engage broadly and proactively with the community’ in order to achieve
its governance aspirations enshrined in the plan.

Therefore, community surveys have formed a central part of the City’s undertakings to secure
an extension to general retail trading hours and to ensure that these undertakings are
supported by the community. Details of these surveys and their outcomes can be found in the
corresponding section below.

A final issue that also warrants discussion is the issue of significant store openings within
Greater Geraldton that potentially have complicated the task of understanding the impacts of
the extension to general retail trading hours. On 16 August 2017, less than two months
before the commencement of the retail trading extension, Woolworths opened its second
supermarket in Geraldton in Wandina, on the Northern fringes of the LGA’s Seacrest suburb.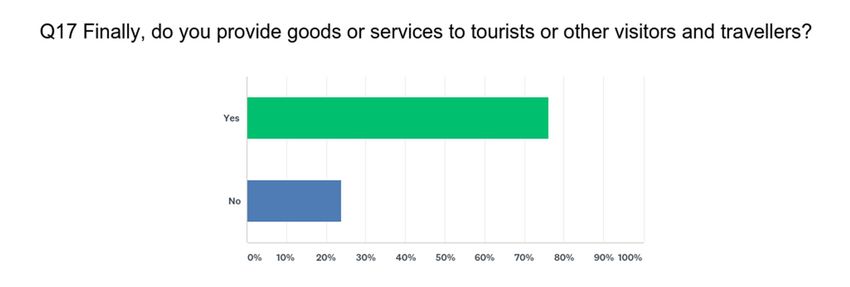
The opening of such a significant retailer (in a new neighbourhood shopping centre, with
attractive undercover parking) in the Southern suburban strip of the LGA, is also very likely to
account for a reduction in visitation to the CBD of Geraldton, since local residents in the
Tarcoola, Wandina and other nearby suburbs would logically be expected to divert some trips
to the CBD to their neighbourhood store instead. As will be seen in subsequent data, there has
been a drop in visitation levels recorded at a central location in the CBD, but it is challenging
to meaningfully attribute this. It is likely that the opening of Woolworths Seacrest accounts
for some diminution of activity for CBD based retailers. It is certainly the case that at least
one of the larger centrally based supermarkets, general retailers acknowledged that this
factor had an impact on their recent trading performance.

Finally, a further national supermarket retailer, Aldi, currently has a new Geraldton store
under construction in Wonthella, located along the North West Coastal Highway. This does
not have an impact for the period under review but certainly indicates that for local retailers
competition is set to increase further in the future and absent strong economic and
population growth will likely mean even more difficult trading conditions for existing
Geraldton retailers in certain retail sectors. While the addition of new national retailers may
broaden the appeal of Geraldton as a regional centre for retail trade, it is unavoidable that
there will be impacts for incumbent traders.

Data Sources, Methods and Results

Data Sources
The reporting deadline requested by State Government and the general paucity of timely
published statistics for regional locations means that measurement of the trial’s impact on
local activity will not be easily captured within reporting timelines from standard data
sources, such as the ABS, alone. As a consequence, local survey data and a range of other tools
have been collected and interrogated to investigate the various impacts of the trial. These are
detailed in the following results section for each source.

The most straight forward and directly accessed of these impacts of the trial is the impact on
community , including community members views. As mentioned above this has been
tackled through community phone surveys.
Community Survey Results
In 2017 and 2018, the City of Greater Geraldton allocated funding for the conduct of
community surveys by independent third parties, to ensure it adequately captured
community sentiment for extended trading.
The first of these community surveys was undertaken by phone in June 2017 and contacted
400 local residents over the age of 16, ensuring gender and age representation in line with
local demographics8, as well as broad representation in each local government ward. This
first survey, which took place prior to the retail trading extension, found that 74% of
residents were in favour of the introduction of a retail trading extension. Majority support
was found in all age categories (16‐29 years, 30‐44 years, 45‐59 years and 60+ years), with
the lowest level of 61% in the oldest age category, but still clearly supportive of extended
retail trading.
The survey was repeated in July 2018, under the same conditions: a phone based survey,
including 400 respondents with an equal male/ female split and age representation in line
with local demographics, as well as representation of all City of Greater Geraldton wards.
The second survey, which was collected in the tenth month of the twelve month trial period,
asked respondents whether they were in favour of extended general retail trading or
preferred to revert to the previous regime. The second survey again found majority support
for extended general retail trading hours in line with the Perth CBD, with 62.8% of residents
in favour. It should be noted the degree of support had declined somewhat from the earlier
survey (74% support) and that in the older age bracket (60 years plus) there was no longer
majority support with a decline to 45.4% (from 61%) and with 47.8% preferring to revert to
the previous trading regime. Majority support clearly still remains in the younger age
brackets and is unchanged in the 45‐59 year age bracket.
Figure 2 Summary of Community Survey Results – Support for Extended Trading Hours
Years 16‐29 30‐44 45‐59 60 + Survey Total
2017 Survey 81% 81% 71% 61% 74%
2018 Survey 72% 72% 71% 45% 63%
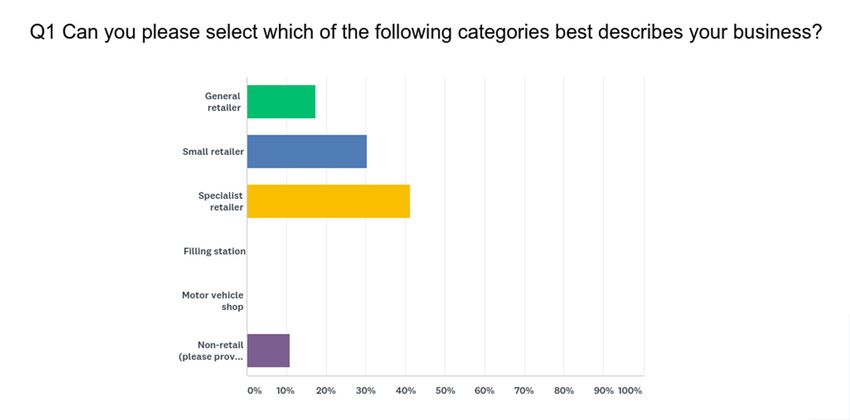
8 For full details please refer to the Thinkfield Community Survey documents included in the appendix.Source: Localise/ Thinkfield reports, 2017 and 2018. Both surveys were contracted to Thinkfield, a dedicated third party market research consultancy, to ensure independence, pursuit of best practice, elimination of various biases in response collection and followed identical methodologies on each occasion. Independent Business Survey As indicated above, there are challenges to investigating the impacts of the trial on local business within the reports deadlines, since the relatively small amount of independent data which is published does not update in time. It was therefore necessary to conduct a local business survey to inform this aspect of the review process. The targeted sample of business for the purposes of the survey was drawn to capture a range of dimensions, such as retail trading category, location, independent business versus chain and was also factored to include local businesses in non‐retail categories. However, since there was no compulsion to participate in the survey, there were also no guarantees that the designed representation was reflected in the actual participation figures and hence there were some slight deviations in the actual response patterns. Nonetheless, some 46 businesses participated (133 were invited to respond) and this sample captured the most significant supermarkets, both national chain and local independent retailers, across various locations in the City of Greater Geraldton. The first question therefore asked respondents to identify which business category they fell into and the results are shown in the chart below.
Figure 3 Responding business by category

There were a total of 8 general retailers who responded, 14 small retailers, 19 specialist and 5
non‐retailers. In terms of amended hours, 18 or fewer than 40% of all 46 responding
businesses had amended their trading hours.
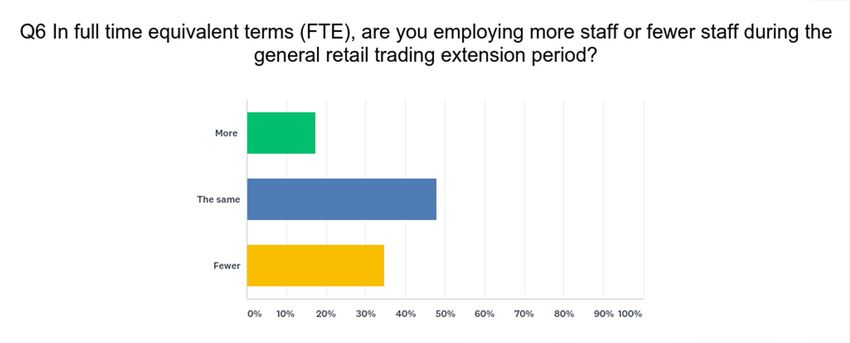
Figure 4 Business alignment with trading extension

Figure 5 Overall employment impact

According to the survey responses, almost 50% of businesses were employing the same
amount of staff in full time equivalent (FTE) as before the retail trading extension. Thirty six
percent of responding businesses claimed to be employing fewer staff and 16% claimed to be
employing more.
The subsequent two questions attempted to quantify any shift in employment and each
question was tackled by 43 of the 46 respondents. The following average and total figures per
employment category per response/business were recorded for the pre‐trial and during trial
periods.
Figure 6 Respondent Supplied Employment Numbers
Before Extended Trading During Extended Trading
Average (per Totals (all Average (per Totals (all
respondent) respondents) respondent) respondents)
Full Time 10 400 9 360
Part Time 7 241 7 247
Casual 13 490 12 480
Source: Progress Economics
According to the data supplied by respondents there appears to be a small loss in employment
between the two periods across two of the three employment categories (full time and
casual), with part time employment category increasing slightly on aggregate.
Interestingly, when asked if the wage bill had increased after allowing for inflation the most
frequent response was that it had, despite a claim of falling employment within businesses.
While this is superficially surprising, it is possibly a valid consequence of penalty rates on
total employment cost given the impact of Sunday and longer trading hours for some
businesses.
There were some noteworthy observations to be made from individual responses to the
survey. For the independent ‘small’ supermarkets largely located at various neighbourhood
nodes across the LGA, all reported a marked decline in their overall employment numbers.
The recently opened national retailer in the non‐CBD location reported a noticeable increase
in its before and during employment numbers. Given that the ‘before’ figures would have
been based on only a six week trading period, prior to the extension introduction, caution is
warranted on the reliability of the those baseline figures. It is also likely that the opening of
this store and the consequent loss of market share for other retailers accounts for some of the
loss in trading activity for the other CBD based supermarkets. It is difficult to separate the
impacts of the new store opening in Wandina out from more general effects on CBD and other
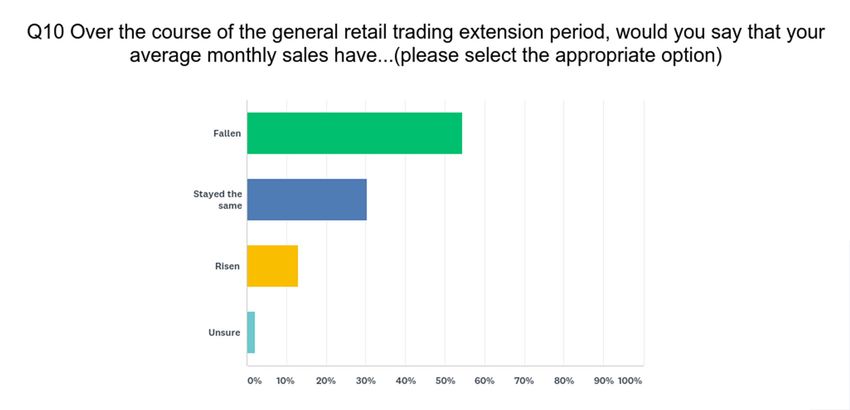
supermarkets from changing resulting from the trading extension.The next two questions asked for retailers to gauge the overall impact on sales and general profitability and the following results were recorded. Figure 7 Impact on sales for respondent businesses
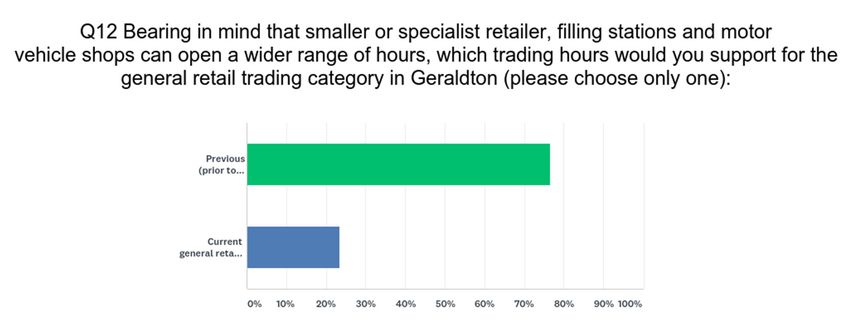
Figure 8 Impact on businesses' profits

As can be seen, 54% of businesses pointed to a fall in sales and over 56% pointed to a fall in
profits. Thirty per cent of business said sales had stayed the same and the same number said
profits were constant. Thirteen percent of responding businesses pointed to increases in both
sales and profits.

The respondents were asked which trading hours regime, they supported and an
overwhelming 76.5% of the 46 respondents said that they preferred the previous hours and
only 23.5% preferred the current extended regime.

Figure 9 Respondents preference for trading hours
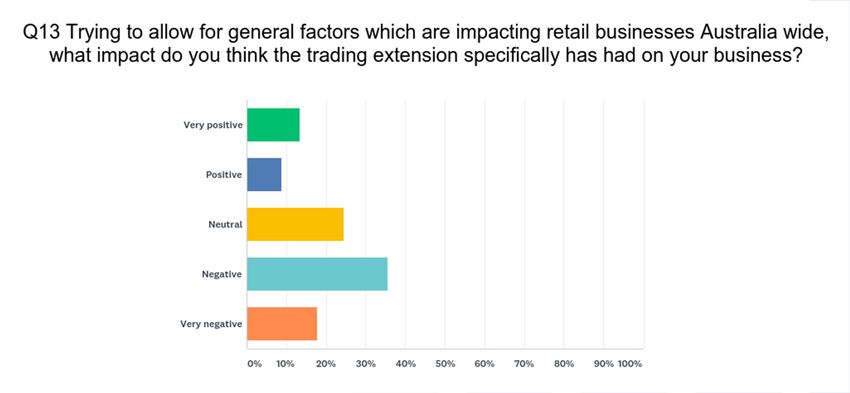
The respondents were also asked if they thought the trial had had a positive or negative
impact on their business. Over 53% said that it had a negative or very negative impact, only
22% said it had been positive and slightly over 24% said its impact was neutral.

Figure 10 General trial impact
The following question gave respondents some choices about what they believed was
contributing to their current business activity levels and the following responses were
recorded. These are consistent with the general factors affecting retail discussed in the
opening context section at the start of this document9.

In closing the respondents were asked to comment on whether they supplied goods to
tourists and approximately 75% said they did. However, a similar share of respondents also
suggested that there was no evidence that the retail trading extension was supported by
tourists.

9Note selection choices were as follows:
Competition from other types of business (e.g. internet based)
Local economic conditions
Factors affecting consumer spending more broadly
Local population trends
Reduced tourism activity
Increased tourism activity
Reduced foot traffic in your business location
Increased foot traffic in your business location
Taken across the cross section of 46 businesses responding to the survey, it would appear
that the dominant voice is that trading through the period corresponding to the retail trading
extension would not be supported by their tourism customers. Since this is not directly
reported by those tourists themselves, caution is again warranted on the reliability of these
responses.

Additional Polling of Businesses by Local Industry Associations
In addition to the business survey, there was survey data reported to the City of Greater
Geraldton through the local industry associations. Firstly, there was a MWCCI survey which
was sent, prior to the trial, to its membership, which exceeded 700 members. There were 190
responses (approximately 27% of members) with two thirds of respondents (18% of the
membership) voting in support of a 12‐month trial of extended trading hours (9% not in
favour and 63% not included or failing to respond to the survey).
More recently, MWCCI in concert with GRIA phone polled a sample of predominantly retail
businesses located close to the CBD and found that 13 (or 43%) of the businesses were ‘for’
the extended retail trading and 17 (57%) were against.
Activity in the CBD
While surveys have proven critical to being able to investigate the impacts, they suffer from
participation issues, largely because of the perceived time involved in completion of the
survey (although this was estimated to be between 7‐8 minutes). From a business
perspective surveys are seen as a ‘cost’ (in lost time) and participation in business surveys
thus often suffers from selection bias, with only those respondents with strong feelings about
a topic taking the time to complete the survey. There is an innate tendency to attract
polarised opinion in its responses, with an under‐representation of middle ground sentiment.
Naturally it is desirable to find impact measures that reduce these biases, but in a regional
setting that can be challenging.
The City of Greater Geraldton has shown willingness to innovate and experiment with
measures of activity and in recent times has subscribed to the Trendwise analytics system.
This uses internet of things sensors to detect mobile phone activity at specified locations to
gauge human activity and visitation levels. The City has trialled the use of these sensors at
three specific locations within its CBD area, before and during the retail trading extension
period and thus has some additional activity data for the purpose of this report. It is hoped
that any change to activation levels in the CBD might be revealed in the data.
However, as might be expected with innovative technology there are generally some
‘learnings’ that occur with the implementation of technology. The City initially deployed three
Trendwise sensors in central areas of the CBD (see City map included in the appendix):
at the library on Marine Terrace,
on the Foreshore near the Visitor Centre (marked ‘i’) and,
a third at Pollinators on Marine Terrace (on the map close to the Wifi signal between
Cathedral Avenue and Fitzgerald Street).
However, there were issues with the sensors and only the sensor at the library on Marine
Terrace was operational for the full extent of the Trendwise subscription and over the two
most suitable comparison periods in the charts below. It is understood that the signalsdetected generally need to be within 100‐150 metres of a sensor, thus any devices detected
are attributed to a zone with a radius of some 100‐150 metres around the sensor.
This is realistically not the ideal location for the purposes of inference for this trial for a
number of reasons:
While located on Marine Terrace which is the main shopping strip in the CBD, this
area of Marine Terrace does not encompass any general retail traders and thus any
businesses which might have been empowered to extend their opening hours.
Furthermore, the City has for a number of years opened the library on Sunday
afternoons and there have been no changes to the library’s opening hours during the
trial period,
The retailers along this strip of Marine Terrace are small or specialist retailers, all of
whom regardless of the trading extension can open on Sunday, but quite a few of
whom choose not to because of low activity levels,
The sensor at this location is unlikely to detect devices at the three nearest general
retail trading centres of Queen’s IGA, Northgate and Stirling Shopping Centres.
In hindsight, in order to fully utilise the benefits of this innovative technology it would have
been preferable to have ensured the continual functioning of the sensors and reviewed their
location prior to the trial’s commencement to maximise the insights from baseline data.
Nonetheless it is worthwhile considering the Trendwise data. There are a range of indicators
published by Trendwise which can be selected for comparison but for the purposes of this
study the ‘number of engaged visitors’ statistic has been selected. For all the separate mobile
phones detected by the sensors in a location, the number of engaged visitors represents the
system record of those signals that dwell in an area for longer than ten minutes (removing
those devices belonging to people in transit through a zone).
Due to the scheduling of extension’s start date in early October and the obligation to report
prior to that date, a comparison of the engaged visitors for the first six months of 2017
compared to the first six months of 2018 has been included as the most sensible timeframe
below to see if there are any noticeable effects10.
10 There was no obvious benefit from comparing Q4 2017, with Q4 2016 since there are typically a number of
dates through that quarter when trading is extended each year for pre‐Christmas trading. Comparison of Q3 was
not possible due to the obligation to report prior to completion of this quarter.Figure 11 Chart showing activity levels in CBD
Total Engaged Visits
More than 10 mins dwell time
3000
2500
2000
1500
1000
500
0
1 2 3 4 5 6 7 8 9 10 11 12 13 14 15 16 17 18 19 20 21 22 23 24 25 26
2017 H1 2018 H1
Source: Trendwise (2018)
The chart above plots the weekly number of engaged visits11, over a six month period running
from Sunday 8th January in 2017 and Sunday 7th January 2018 (avoiding the immediate post‐
Christmas holiday period). The focus on engaged visits, means that phone based signals from
people in transit through the area is removed and the data should capture more meaningful
visits to the CBD area.
Interestingly in the chart above, despite a small increase in engaged visits in the eleven weeks
of 2018 compared to 2017, the subsequent weeks of the six month period shows a decline in
weekly CBD activity levels in 2018 (i.e. during the trading extension) compared to the same
period in the previous year. Comparing the weekly averages, the first six months of 2017
averaged 1812 engaged visits per week, compared to 1675 engaged visits for the same period
during the extension trial period. That is, there were on average fewer devices detected in
this area of the CBD during the general retail trading extension period than had been the case
in the baseline period before. It would indicate that the extension to general retail trading did
According to the Trendwise website, engage visits have: “a long enough dwell to perform a
11
meaningful interaction within your location.” The City’s subscription was set up with 10
minutes as the cut off above which a visit became an engaged one.not work to increase activity levels in this particular zone of the CBD area and in fact the
opposite was true.
The second variable from the Trendwise suite of analytics selected here is a comparison of the
‘days with most potential’ variable. This captures the average numbers of devices detected on
a specified day of the week during a fixed period. Again, the first six months of 2017 has been
compared to the first six months of 2018 to see if there are any impacts visible for the Marine
Terrace location in the CBD.
Figure 12 Average activity levels in CBD
Days with most potential
9000
8000
7000
6000
5000
4000
3000
2000
1000
0
Monday Tuesday Wednesday Thursday Friday Saturday Sunday
2017 H1 2018 H1
Source: Trendwise (2018)
It can be clearly seen from the graph that the average number of devices detected on Marine
Terrace over the week was lower for each of the seven trading days in the first six months of
2018 (the extended trading period) than in the same period in the previous year.
It is difficult to be conclusive about causation but it is clear that activation along Marine
Terrace is certainly not higher in the extended retail trading period and Sunday suffers from
the same diminution of activity levels as every other day of the week.Visitor Centre Data
The City of Greater Geraldton operates a visitor centre (marked on the map) at the Southern
end of the Geraldton Foreshore, which serves as the central tourist information bureau. This
centre also records daily visitor counts and thus is an additional source of statistics, more
specifically on tourist activity levels.
The chart below shows the monthly recorded door counts for the visitors centre, which tends
to peak through the winter (wildflower) season in July to early September. Comparing the
average monthly count over the first half of 2017 to the first half of 2018 (during the trading
extension period) shows a modest improvement from 3,543 entrants per month to 3,650
entrants to the visitors’ centre (3% increase).
Figure 13 Monthly Door Counts at Geraldton Visitor Centre
9,000
8,000
7,000
6,000
5,000
4,000
3,000
2,000
1,000
0
Source: City of Greater Geraldton, Progress Economics
Monthly figures do conceal some of the variability and information that can be viewed in the
daily figures. Hence the inclusion of the daily door count figures in the chart below. The
extreme peaks generally coincide with the arrival of a cruise ship and the troughs, generally
with an occasional malfunction of the door counter.The daily data allow some analysis of individual day effects and comparing the average
Sunday door count in the first half of 2017 with that in 2018 (extension period) does reveal a
small gain, increasing from 65.8 visitors on average on a Sunday to 77.8. Clearly at less than a
100 visitors into the centre, Sunday continues to provide the low point in weekly visitation
within the Geraldton CBD, but there has been a slight improvement during the trial.
Figure 14 Daily Door Counts at Geraldton Visitors Centre
900
800
700
Radiance of the Seas cruise ship visits
600
500
400
300
200
100
0
7/16
8/16
9/16
10/16
11/16
12/16
1/17
2/17
3/17
4/17
5/17
6/17
7/17
8/17
9/17
10/17
11/17
12/17
1/18
2/18
3/18
4/18
5/18
6/18
Source: City of Greater Geraldton Visitors’ Centre, Progress Economics
Employment
The review was tasked with addressing the employment impacts of the trial. Ideally, it would
be useful to have access to independent sources of data within the reporting time frame to be
able to gauge these impacts with confidence in the independence of the data. Unfortunately,there is very little third party data that would both capture before and after impacts of the retail trading extension and be published inside reporting timelines. Census gives the fullest picture of regional employment levels, with sector, e.g. retail detail, but this was completed in 2016 prior to the trading extension and will not be repeated until 2021. The Commonwealth Department of Employment and Workforce Relations does produce quarterly employment data for all LGAs across Australia in its Small Area Labour Market (SALM) report, but unfortunately this is available with publication lags, is prone to considerable volatility and is only available at the aggregate level, i.e. has no insight into specific employment sectors. Greater Geraldton unemployment rate according to the SALM data was 6.9% for March 2018, 5.4% for the comparable quarter in March 2017 and compares to an area low in September 2012 of 2.8%. While there is some expected imprecision in data for relatively small areas and small area labour force statistics are also prone to volatility12, nonetheless it is clear that the general picture of economic activity is significantly weaker and has continued to weaken through the extended general retail trading period. While the business survey has also indicated some overall loss in employment within the retail sector, given the general picture of retail at the State level, a degree of employment loss would be expected given the general weakness in the sector. It is encouraging, however, that there has been some modest increases in recent years in the number of café and accommodation businesses in Geraldton (see ABR business statistics in section on General Factors Impacting Retail). 12The March quarter unemployment figure for Greater Geraldton increased a full one percentage point compared to the previous quarter.
Figure 15 Greater Geraldton Workforce and Unemployment

                                     Greater Geraldton LGA
 21,600                                                                                              8.0

 21,400                                                                                              7.0

                                                                                                     6.0
 21,200
                                                                                                     5.0
 21,000
                                                                                                     4.0
 20,800
                                                                                                     3.0
 20,600
                                                                                                     2.0

 20,400                                                                                              1.0

 20,200                                                                                              0.0
           Dec‐15 Mar‐16    Jun‐16    Sep‐16    Dec‐16 Mar‐17      Jun‐17   Sep‐17   Dec‐17 Mar‐18

                        Workforce (left axis)            Unemployment rate % (right axis)

Source: Department of Employment and Workforce Relations, Small Area Labour Market Report, DEWR
website.

Employment tends to be a lagging indicator of the business cycle and such a general measure
would naturally be somewhat unresponsive to changes in a specific sector. Consequently, it
makes sense to review the employment feedback from the business survey to try to build a
more insightful picture.

These are discussed in detail in the business survey results section above, but broadly
correspond to an overall reduction indicated by respondents to employment within their
businesses, with some offsets from national supermarket stores and some tourist related
small businesses. The independent supermarket sector broadly indicated marked reductions
in employment. Outside of general retailers other retailers generally indicated lower
employment, with the exception of a small number of cafes, which had slightly increased staff
and a gift store, which also supported the extension.
Tourism According to the Remplan data module provided by the City of Greater Geraldton on its website, there are 963 jobs supported by tourism in the local government area and the value of the sector output is estimated at $189.7m for 2016. While independent data for the value of the tourism sector is produced for the Greater Geraldton and is referred to in the opening context section, it is not updated swiftly enough to be able to reflect any changes for the trading deregulation period. As mentioned Geraldton is a feature destination on cruising itineraries for WA. An element of the local debate in advance of the deregulation trial focused on the negative impact on cruising from Geraldton retailers being closed on Sunday and public holiday visit dates. It is worth quantifying the number of these occurrences and their potential impact. Figure 16 Cruise dates falling on Sunday or public holiday Cruise Calendar Visits Sundays or public holidays Total 2016 5 12 2017 0 8 2018 1 (+1 post trial) 12 (actual and planned) As can be seen, in 2016 there were 5 potential dates when cruise tourists would have been in town but there was no general retail trading activity due to Sunday or public holiday closures. There were no dates impacted in 2017 and so far in 2018 there has been one date which coincided with a cruise ship visit and the deregulation meant general retailers were open, and there is one more date this year in November when a cruise ship is expected to visit on a Sunday (but this is after the retail extension period). According to the Australian Cruise Association’s (ACA) annual report, which includes estimates for the economic impact of cruise visits on various regional centres13, in 2016/17 there were 12 cruise ship visits to the Geraldton. The association estimates that passenger and crew expenditure during those visits totalled $553,000 and $542,000 respectively, yielding an estimated crew and passenger spend in the local economy of $91,25014 per cruise ship visits. With one visit in the extended retail trading period, it can be concluded that there 13 See: http://www.australiancruiseassociation.com/sites/default/files/170636‐aca‐ar‐2017.pdf 14 Calculation Progress Economics, based on ACA data.
was an estimated benefit to the local economy of $91,250 in terms of capture of expenditures.
It is difficult to comment conclusively on how much of that would have been lost since apart
from general retailers other categories of business can open on those dates and might well
have captured some of those revenues anyway. The relevant consideration is whether the
extra spend from visitors due to coincident cruise visits on deregulated trading days offsets
any impost to retailers from widening their opening hours, or loss of trade from additional
competition opening extended hours for the remainder of the year.

Key Findings, Summary and Conclusions
There is clear evidence that the general community continues to favour an extended general
retail trading regime in Greater Geraldton, although this has slightly diminished over the
course of the trial period.

The local business survey indicated that the extended trading period was characterised by
slightly lower employment on average across respondent businesses, with indications of a
loss of 40 full time jobs, a gain of 6 part time jobs and a loss of 10 casual workers in the survey
sample. The figures implied a pre‐trial starting employment of 1131 workers, aggregating
across all classes of employment, based on the numbers provided by the business owners.
Given that the census suggested there were 1800 people in retail in Greater Geraldton (in
2016) this implies fairly good coverage within the survey. It is difficult of course to account
for the veracity of the figures, given the respective agendas of participants and the figures are
not audited.

The measures used to capture CBD activation levels did not seem to suggest a benefit from
extended trading based on the location specific measures used, but it is recognised that the
sensors were compromised and while an independent, objective source, problems with their
positioning might have compromised their insights. In addition, the opening of a significant
new supermarket and neighbourhood centre in Wandina just prior to the extension period
might well have accounted for some or perhaps all of the diminished activity levels in the CBD
measured by the sensor and indeed some of the revenue and consequent employment losses
across other competing businesses.

The limited number of coincidences of cruise visits on a Sunday, with only one falling in the
twelve month trading extension period means that there would be minimal impact and
benefit to Geraldton from the extension coming from the cruise sector. In 2016, there were 4
Sunday cruise visits and 0 in 2017. If there are significant benefits from tourism from a more
liberal trading regime, it would likely come from another tourism sector, e.g. holiday makers
in recreational vehicles or other transport modes coming to Geraldton on Sundays etc.

The retail trading extension has been received with mixed sentiment among the business
community and that is presumably since for larger general retailers who were previously
restricted, the trading provides an opportunity to compete more often with smaller
‘neighbourhood’ retailers who have enjoyed protection from this competition on one day of
the week and also later in the evening or ‘after hours’.

However, while it might be considered an issue of fairness as well as community preference to
pursue extended retail trading for all retail sectors it is worth considering the insights from a
US economics practice, Civic Economics15 which follow in the next section as the City
determines regulatory practices for its retail sector to foster local economic development.

Additional Information and Considerations
Civic Economics is a US consulting practice started in 2002, which has undertaken an
interesting and substantial body of work over the last decade interrogating the economic
impacts of the independent retail sector compared to other types of business, such as national
chains with local presence or online retailers shipping to local community. The central
findings from their US based research was that there was clear benefit in terms of retention of
dollars in the local economy from the pursuit of a healthy independent local retail sector,
compared to other modes of retail. This presents is an interesting dilemma for local
government pursuing economic development, since while it might capture noteworthy
construction dollars from the attraction of significant national chains, if that comes through
the displacement of local independent retailers it is clear that proportionately they may be
ultimately increasing the structural leakages out of the local economy over time as
independent local retailers are displaced by retail modes which divert more local revenues
from the regional economy.

This means that the use of the retail sector to grow the local economy and advance the local
economic development must ultimately be a very nuanced and careful constructed agenda.
That consideration is beyond the scope of this report but it is clear that before embarking on a
deregulation agenda to advance local economic development consideration should be given

15 “THE CIVIC ECONOMICS OF RETAIL ‐ Ten Years of Studies, 2002‐2012”, Civic Economics (2012):

http://nebula.wsimg.com/eb1a35cadd85dd440dcba5cb1eba005e?AccessKeyId=8E410A17553441C49302&dis
position=0&alloworigin=1
by local governments to how best to support any incumbent local retailers through these
changes to ensure that the long term health of the independent retail sector is preserved.

The sensible timeline for an evaluation of that journey clearly far exceeds the term of this
report.

Appendix
City of Greater Geraldton Map of the CBD
Localise/ Thinkfield Community Survey Reports: 2017 and 2018
Progress Economics Business Survey Summary Analytics (Survey Monkey)
You can also read