Automated Computer Vision Assessment of Hypomimia in Parkinson Disease: Proof-of-Principle Pilot Study - Journal of Medical Internet Research
←
→
Page content transcription
If your browser does not render page correctly, please read the page content below

JOURNAL OF MEDICAL INTERNET RESEARCH                                                                                                        Abrami et al

     Original Paper

     Automated Computer Vision Assessment of Hypomimia in
     Parkinson Disease: Proof-of-Principle Pilot Study

     Avner Abrami1, MSc; Steven Gunzler2, MD; Camilla Kilbane2, MD; Rachel Ostrand1, PhD; Bryan Ho3, MD; Guillermo
     Cecchi1, PhD
     1
      IBM Research – Computational Biology Center, Yorktown Heights, NY, United States
     2
      Parkinson’s and Movement Disorders Center, Neurological Institute, University Hospitals Cleveland Medical Center, Cleveland, OH, United States
     3
      Department of Neurology, Tufts Medical Center, Boston, MA, United States

     Corresponding Author:
     Guillermo Cecchi, PhD
     IBM Research – Computational Biology Center
     1101 Kitchawan Rd
     Yorktown Heights, NY, 10598
     United States
     Phone: 1 1 914 945 1815
     Email: gcecchi@us.ibm.com

     Abstract
     Background: Facial expressions require the complex coordination of 43 different facial muscles. Parkinson disease (PD) affects
     facial musculature leading to “hypomimia” or “masked facies.”
     Objective: We aimed to determine whether modern computer vision techniques can be applied to detect masked facies and
     quantify drug states in PD.
     Methods: We trained a convolutional neural network on images extracted from videos of 107 self-identified people with PD,
     along with 1595 videos of controls, in order to detect PD hypomimia cues. This trained model was applied to clinical interviews
     of 35 PD patients in their on and off drug motor states, and seven journalist interviews of the actor Alan Alda obtained before
     and after he was diagnosed with PD.
     Results: The algorithm achieved a test set area under the receiver operating characteristic curve of 0.71 on 54 subjects to detect
     PD hypomimia, compared to a value of 0.75 for trained neurologists using the United Parkinson Disease Rating Scale-III Facial
     Expression score. Additionally, the model accuracy to classify the on and off drug states in the clinical samples was 63% (22/35),
     in contrast to an accuracy of 46% (16/35) when using clinical rater scores. Finally, each of Alan Alda’s seven interviews were
     successfully classified as occurring before (versus after) his diagnosis, with 100% accuracy (7/7).
     Conclusions: This proof-of-principle pilot study demonstrated that computer vision holds promise as a valuable tool for PD
     hypomimia and for monitoring a patient’s motor state in an objective and noninvasive way, particularly given the increasing
     importance of telemedicine.

     (J Med Internet Res 2021;23(2):e21037) doi: 10.2196/21037

     KEYWORDS
     Parkinson disease; hypomimia; computer vision; telemedicine

                                                                               [5,6]. This affects the ability to contract facial muscles by
     Introduction                                                              causing hemifacial spasms and can produce involuntary
     Facial expressions are an essential component of interpersonal            movements (ie, tics) and muscle weakness or stiffness.
     communication [1]. They depend on our ability to voluntarily              Parkinson disease (PD) is a neurodegenerative disease that
     and involuntarily contract facial muscles [2], which are                  produces a gradual and generalized loss of motor functions,
     innervated by facial nerves. However, neurodegenerative                   including the ability to contract facial muscles during
     diseases can cause cognitive disorders that affect expressivity           spontaneous and voluntary emotional expressions [7], and
     [3] and cortical or peripheral nerve traumas [4], and can limit           voluntary nonemotional facial movements [8]. This reduced
     the production of facial expressions and emotion recognition
     https://www.jmir.org/2021/2/e21037                                                                   J Med Internet Res 2021 | vol. 23 | iss. 2 | e21037 | p. 1
                                                                                                                        (page number not for citation purposes)
XSL• FO
RenderX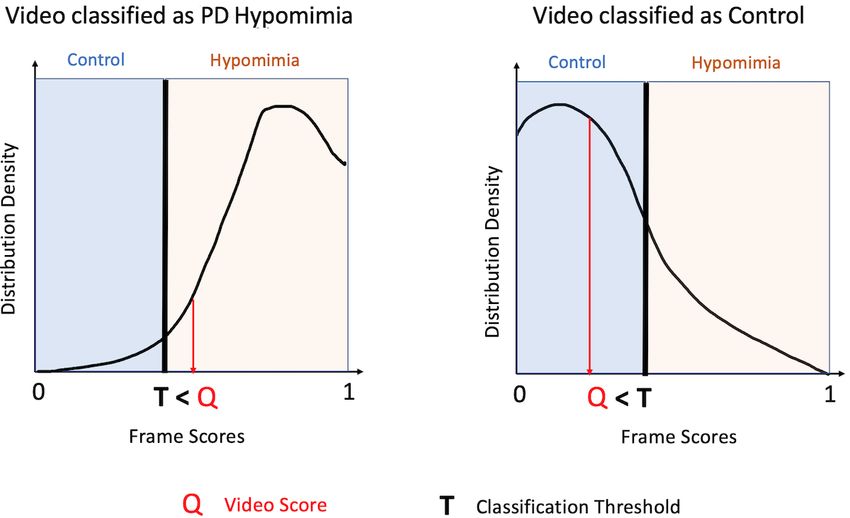
JOURNAL OF MEDICAL INTERNET RESEARCH                                                                                                  Abrami et al

     ability leads to a loss of facial expressiveness that generates a     motor state. An automated video-based assessment tool like
     signature “mask-like” appearance of the disease, which is also        this one may be valuable for use in telemedicine [28], which
     known as hypomimia. This loss of expressivity is often                has become increasingly utilized in PD especially following the
     confounded with depression [2,9], a common symptom in                 onset of the COVID-19 pandemic. Such a resource would also
     patients with PD. However, even nondepressed PD patients              allow for monitoring of a patient’s motor state at home [29,30]
     show hypomimia, supporting the hypothesis of a motor control          between in-office neurologist or clinical trial visits [31].
     impairment in addition to the effects of depression [2,9]. A
     hypomimia rating is part of the Unified Parkinson Disease             Methods
     Rating Scale (UPDRS) [10], which is the gold standard clinical
     assessment tool. When assessing a patient for hypomimia,              Algorithm Development
     neurologists rate on a 5-point scale as follows: 0 for normal         The neural network model was trained using two data sets of
     facial expression, 1 for minimal hypomimia, 2 for slight but          faces, comprising people with PD and controls. The first was
     abnormal diminution of facial expression, 3 for moderate              the YouTube Faces Database [32] (created by the Computer
     hypomimia, and 4 for severe or complete loss of facial                Science Department of Tel Aviv University), which contains
     expression [10].                                                      3425 videos of 1595 people (two-thirds of the subjects are male).
     Disease progression does not seem to produce uniform facial           The average length of the video clips is 7 seconds. This database
     masking across people. Studies of differential deficits in specific   constituted the control database for training the Visual Geometry
     muscles [7] and sections of the face have documented                  Group neural network [33] in this study. The second training
     asymmetric patterns [11] during posed smiling. However,               data set was created by performing a search on YouTube using
     previous work was based on constrained laboratory tasks where         the search terms “Parkinson’s disease” and “interview.” From
     facial expressions were either evoked by sensory stimulations         that search, 107 videos of self-identified PD patients (68 males,
     [12] or posed [7,11], limiting the applicability of the results to    middle-aged and older patients) were collected. This latter
     spontaneous natural expressivity.                                     YouTube set was randomly partitioned into a 75% training set
                                                                           (80/107 videos, 50 males) and 25% test set (27/107 videos, 18
     In experimental settings, the quantification of masked facies in      males). By design, this training data set incorporated common
     patients with PD has been traditionally performed with manual         image quality challenges (such as varying lightning conditions,
     scoring [11,13,14]. A method capable of objectively                   poses, and occasional presence of motion blur).
     characterizing variations in naturally occurring facial
     expressions that vary with disease progression would allow the        To preprocess the videos, faces were extracted from each frame
     patient state to be continuously evaluated outside of a clinical      of each video. Thereafter, each image was converted to
     setting, opening up the possibility of remote or                      grayscale, the intensity was normalized (mean=0.51, standard
     telemedicine-based monitoring. Video analysis has started to          deviation=0.25), and the image was resized to a standardized
     demonstrate success in objectively quantifying emotions in            224 × 224 pixels. The neural network was trained using
     psychiatry [15,16] and neurology [17].                                stochastic gradient descent.

     Computational methods based on known face components (eyes,           After training, for each new video in the test set, the algorithm
     mouth/lips, action units, skin, and shape) have been proposed         assigned each frame a score between 0 and 1, based on the
     [18-24]. For instance, eye-tracking algorithms [18] have been         degree of hypomimia that was detected by the algorithm in that
     successful at quantifying the reduction in emotion recognition        frame. The scores of all of the frames of a video together formed
     by patients with PD [19]. These methods involve the analysis          a density distribution for that video (Figure 1), which
     of facial movements [22], specific visual features [23], patterns     demonstrated the proportion of frames that are assigned each
     related to a specific emotion such as disgust [12], or facial         likelihood of hypomimia. It is important to note that not all
     landmarks [21]. Engineered facial features are nevertheless           frames are indicative of the disease state, as a patient with PD
     limited by image quality (distance to camera), pose (nonfrontal       may well have some frames where he/she does not exhibit
     looking participant), or visual occlusions (eg, glasses, hands,       hypomimia. Thus, the probability distribution for each video
     and hats). These challenges [25] can be overcome by learning          (and thus each subject) had a different shape proportional to the
     features directly from the raw image data using deep convolution      underlying hypomimia severity. We hypothesize that a PD video
     networks that are known to be very effective at extracting            will have more frames with a higher hypomimia score than will
     emotions in healthy participants [26] and to outperform classic       a control video. Similarly, we hypothesize that a patient with
     feature extraction methods.                                           PD in the off drug state will have more frames with a higher
                                                                           hypomimia score than that same subject in the on drug state.
     Although it is well accepted that PD produces a generalized
     loss of the ability to produce facial expressions, it is unclear      In order to classify each video, we needed to characterize this
     how this deficit evolves with disease progression and what are        density distribution for each video as a single number. To do
     the effects of dopamine replacement therapy on masked facies          so, we took the fifth quantile (Q) of that video’s frame score
     [27]. In this work, we describe a methodology to characterize         density distribution (other quantiles can be used without loss
     PD hypomimia using deep learning. This procedure can be               of generality as discussed in the Results section). A video that
     performed remotely on videos, and thus, it provides a novel           exhibits low hypomimia should have a positively skewed
     noninvasive digital tool for objective assessment of PD               distribution, as the bulk of the probability mass will be closer
     hypomimia and the changes associated with an on-off drug              to 0, and therefore, will have a lower value of Q. In contrast, a

     https://www.jmir.org/2021/2/e21037                                                             J Med Internet Res 2021 | vol. 23 | iss. 2 | e21037 | p. 2
                                                                                                                  (page number not for citation purposes)
XSL• FO
RenderX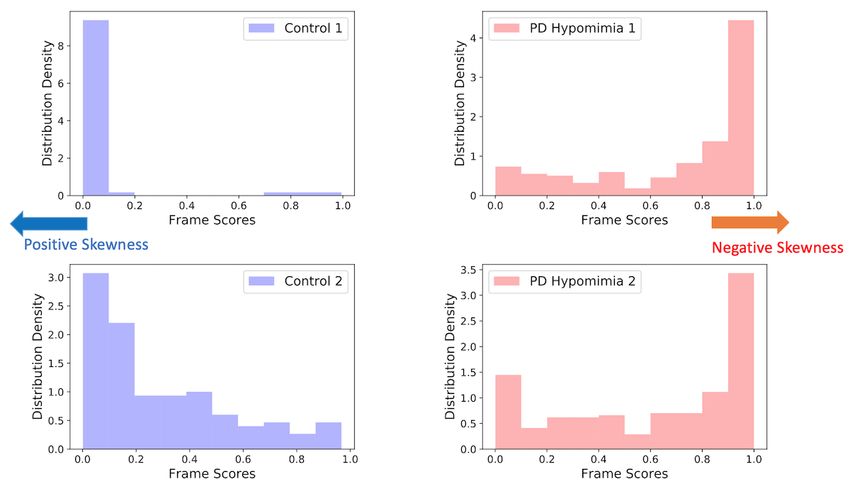
JOURNAL OF MEDICAL INTERNET RESEARCH                                                                                                                Abrami et al

     video that exhibits high hypomimia should have a negatively                     0 to 1 continuum is required to achieve 5% of the video’s
     skewed distribution, with the bulk of the probability mass closer               frames. Using this metric, we hypothesize that control videos
     to 1, and therefore, will have a higher value of Q. Thus, the                   will have a relatively lower Q (more frames concentrated toward
     value of Q can be used to characterize how strongly hypomimia                   0) and PD videos will have a relatively higher Q (more frames
     is detected in a given video, by representing how far along the                 concentrated toward 1; Figure 2).
     Figure 1. The preprocessing pipeline for the input videos. Faces are extracted, greyscaled, and normalized. Then, each frame in the video is assigned
     a probabilistic classification assignment from 0 to 1 representing the degree of hypomimia. Thus, each video is represented by a probability distribution
     of frame scores. SGD: stochastic gradient descent.

     Figure 2. Video scoring. To classify a video, a probability distribution is created for all of a video’s frames, and the fifth percentile of the distribution
     is defined as Q. A video that has a Q value above T (ie, closer to 1 or more evidence of hypomimia) is categorized as PD hypomimia; a video with a Q
     value below T (ie, closer to 0 or less evidence of hypomimia) is categorized as Control. PD: Parkinson disease.

     https://www.jmir.org/2021/2/e21037                                                                           J Med Internet Res 2021 | vol. 23 | iss. 2 | e21037 | p. 3
                                                                                                                                (page number not for citation purposes)
XSL• FO
RenderX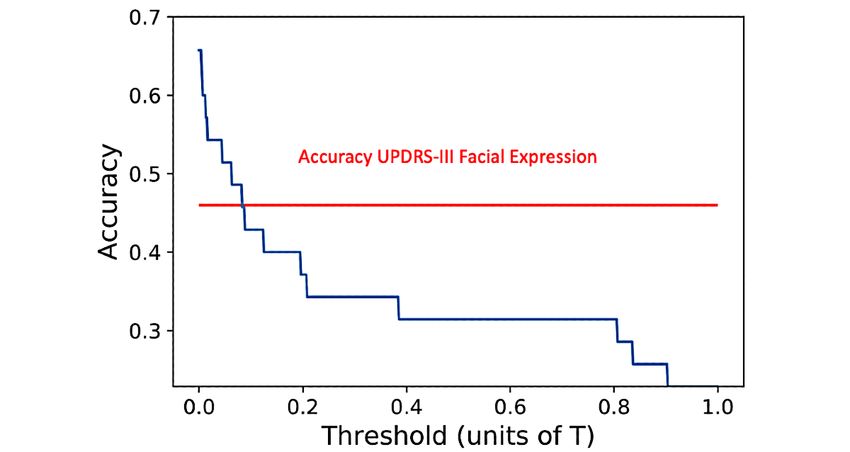
JOURNAL OF MEDICAL INTERNET RESEARCH                                                                                                    Abrami et al

     Finally, a classification threshold T was selected. Any video          All participants arrived at the clinic in the off state. If they were
     that had a Q value lower than the threshold T was classified as        assigned to the off first condition, they completed the
     not PD (ie, 0). Any video that had a Q value higher than the           experimental protocol when they arrived in the clinic (off state).
     threshold T was classified as PD (ie, 1). T was selected such          Thereafter, they took their scheduled L-DOPA dose and waited
     that it maximized classification accuracy in the testing set and       until the medication’s effects began. They were evaluated by
     was validated using the separate held-out validation set               the neurologist administering the UPDRS every 30 minutes
     consisting of the Alan Alda videos.                                    until they self-reported being in the on medication state or 1.5
                                                                            hours after the dose (whichever came earlier). Once this
     Algorithm Testing                                                      occurred, they completed the experimental protocol a second
     The difference in video scores between the PD and control              time (on state). In contrast, if the participant was assigned to
     groups was tested on a set of 54 videos (middle-aged and older         the on first condition, they took their scheduled L-DOPA dose
     patients, 37 males). Of these, half (n=27) featured people with        once they arrived at the clinic, waited until its effects began (as
     self-identified PD, and the other half (n=27) featured people          described above), and then completed the experimental protocol
     without PD (controls). The control videos were selected to             for the first time (on state). These participants then left the clinic
     include people who self-reported having other neurological or          and came back for a second scheduled session on a different
     psychiatric disorders, with the following breakdown: 18 healthy        day to perform the experimental protocol in the off state.
     people, four people with depression, one person with
     posttraumatic stress disorder, one person with traumatic brain         The UPDRS-III Facial Expression item, which rates the
     injury, one person with bipolar disorder, one person with              impairment of facial expressions, was used as the reference
     schizophrenia, and one person with chronic back pain. For the          outcome variable in the present analyses. We characterized a
     videos that were categorized as PD or other disorders,                 strictly positive UPDRS-III Facial Expression score (ie, a rating
     identification was performed based on the uploader’s self-report       greater than 0) as a positive PD classification by the examining
     (ie, the title of the video), not a clinical evaluation. However,      neurologist. Additionally, we characterized a strictly positive
     many of the videos were created by disease associations,               difference of the UPDRS-III Facial Expression score between
     clinicians, academics, documentaries, or celebrities who publicly      off and on (off minus on) as corresponding to a positive drug
     revealed their diagnoses, providing some degree of confidence          state classification by the neurologist.
     of the reliability of the self-report.                                 Participants should have less dysfunction (and a lower UPDRS
                                                                            score) when they are in the on medication state than when they
     Algorithm Validation
                                                                            are in the off medication state. The present work investigates
     Hypomimia and Drug State                                               the effectiveness of the proposed computer vision algorithm to
     The Tufts Clinical data set consists of 35 participants (mean          detect hypomimia in these patients, as well as quantify their
     age 68 years, SD 8 years; 23 males and 12 females; mean total          medication state (ie, on/off) by detecting hypomimia. In that
     UPDRS-III score 25, SD 13) with idiopathic PD. The protocol            respect, if the algorithm is predictive of a patient’s drug state,
     was run at Tufts Medical Center in Boston, Massachusetts and           the model should predict a lower score for the on state as
     was approved by the Tufts Health Sciences Campus Institutional         levodopa contributes to lowering PD symptoms by increasing
     Review Board (IRB #12371) (the complete study design [34]              the availability of dopamine to the brain. This hypothesis was
     and related analyses conducted on the data set [35-37] have            tested by computing the change in score between the off and on
     been reported previously). Patients were video recorded by             medication states.
     means of a Microsoft Kinect camera (Microsoft Corp) at 30              Longitudinal Severities of Masked Facies
     frames per second.
                                                                            The longitudinal data set consisted of seven videos of public
     Only 33 patients participated in a clinical interview in both their    appearances of Alan Alda from 1974 to 2019 (age 38-83 years),
     on and off drug states, with a mean of 3639 frames per video           in which he was engaged in public speaking. Alan Alda is an
     (approximately 2 minutes), which is similar to the length of the       actor, director, and screenwriter who was diagnosed with PD
     videos used in the training data set.                                  in 2014. This data set consists of four videos before diagnosis
                                                                            and three videos after diagnosis, and is used to evaluate the
     All 35 patients performed the UPDRS-III scripted tasks
                                                                            present algorithm’s ability to quantify hypomimia. In this data
     (including pronation-supination, finger tapping, and walking)
                                                                            set, a mean of 9642 frames per video (5.3 minutes) was extracted
     and simulated activities of daily living [34] (including book
                                                                            and analyzed by the algorithm. In these interviews, Mr Alda is
     carrying, bottle shaking, coat buttoning, cursive writing, and
                                                                            recorded in diverse poses and lightning conditions, making the
     zipping) during their clinical visit, with a mean of 50,987 frames
                                                                            longitudinal data set qualitatively similar to the training data
     per video (approximately 28 minutes).
                                                                            set and Tufts Clinical data set.
     PD medication state (on or off) was self-reported by the
     participant at the start of each session. Medication dosage and        Results
     timing was determined by the participant’s typical daily dosage
     of levodopa (L-DOPA) therapy. Participants refrained from              Hypomimia Detection (Test Set)
     taking additional dosages in order to follow this experimental         As expected for the PD videos, a greater proportion of frames
     protocol. Participants were randomly assigned to an order              were classified as “PD hypomimia” than were for the control
     condition (either completing the protocol in on first or off first).   videos. The skewness of the PD subject video distributions was

     https://www.jmir.org/2021/2/e21037                                                               J Med Internet Res 2021 | vol. 23 | iss. 2 | e21037 | p. 4
                                                                                                                    (page number not for citation purposes)
XSL• FO
RenderX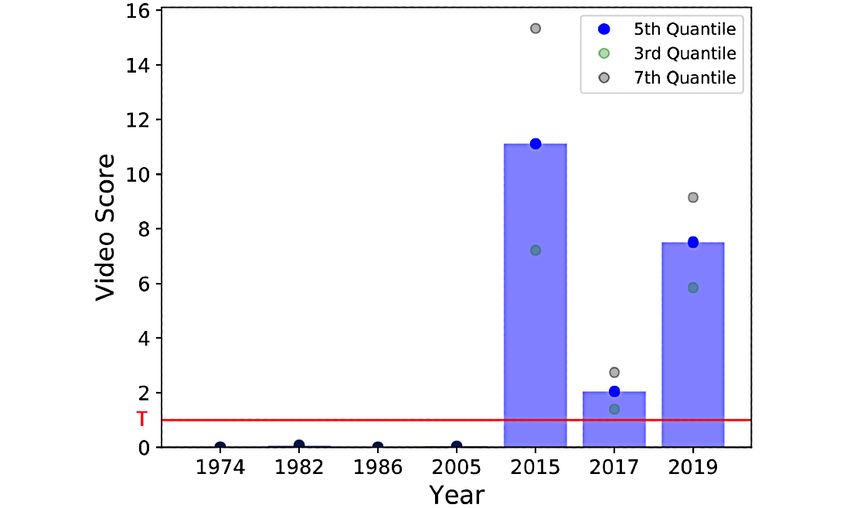
JOURNAL OF MEDICAL INTERNET RESEARCH                                                                                                           Abrami et al

     significantly smaller than that of the control videos (one-tailed           scores closer to 1) for PD videos than for control videos (Figure
     Mann-Whitney U=212, P=.004), demonstrating that there was                   3).
     more weight to the right side of the distribution (hypomimia
     Figure 3. Example test set of PD and control distributions for four videos from the test data set. Two control videos (in blue) and two PD videos (in
     red). The distributions of the PD videos have higher weight on score values closer to 1 (negatively skewed) compared to the control videos, thereby
     demonstrating greater incidence of hypomimia. PD: Parkinson disease.

     We experimentally quantify this difference in skewness by                   To provide a baseline accuracy measure, two professional
     selecting the fifth quantile Q, which becomes the video score.              neurologists rated each video in the test data set on the
     The greater the incidence of hypomimia in the frames of a given             UPDRS-III Facial Expression score (score between 0 and 4).
     video, the higher the quantile Q. Figure 4 shows that a wide                The neurologists performed the evaluation on the video, not an
     range of quantiles would provide satisfying results on the test             in-person clinical examination, and were told just to focus on
     set (all quantiles below 15 achieve an area under the receiver              the Facial Expression score and attempt to avoid being
     operating characteristic curve [AUROC] >0.7). We chose the                  influenced by other cues present in the subject’s behavior, to
     fifth quantile without loss of generality and applied this choice           the extent possible. Using this scoring system, one neurologist’s
     to the validation data sets only. A classification threshold                ratings produced an AUROC of 0.64 and the other neurologist’s
     (T=0.0003) was selected to maximize classification accuracy                 ratings produced an AUROC of 0.79. Averaging both
     (70% accuracy or 38/54 videos correctly classified) in the test             neurologists’ UPDRS-III Facial Expression scores produced an
     set. This threshold was determined on the basis of performance              AUROC of 0.75. These scores were taken as an approximation
     on these test set videos and then evaluated on the separate                 of baseline classification accuracy that could be achieved using
     held-out validation data sets (Alan Alda and Tufts Clinical) to             expert human raters. It is important to note, however, that this
     characterize hypomimia cues.                                                accuracy is an approximation and a true in-person clinical rating
                                                                                 would incorporate substantially more information than just the
                                                                                 UPDRS-III Facial Expression score.

     https://www.jmir.org/2021/2/e21037                                                                      J Med Internet Res 2021 | vol. 23 | iss. 2 | e21037 | p. 5
                                                                                                                           (page number not for citation purposes)
XSL• FO
RenderX
JOURNAL OF MEDICAL INTERNET RESEARCH Abrami et al
Figure 4. Test set AUROC (PD vs Control) as a function of the chosen video distribution quantile to use as the “Q” threshold. A wide range of quantiles
achieves AUROC > 0.7 (15th quantile and below). The fifth quantile, selected as our video score threshold, is shown in green. AUROC: area under the
receiver operating characteristic curve; PD: Parkinson disease.
To quantitatively evaluate the difference between the off and
Hypomimia Changes Associated With the Drug State on states, we computed the difference between the off and on
in the Tufts Data Set (Validation Set) video scores for each participant. The off score generated by
Finally, we assessed the performance of our algorithm on the the algorithm was strictly greater than the on score in 63%
held-out validation sets, after being trained on the training set (22/35) of the participants during the clinical visit. In
and accuracy maximized on the testing set. The first validation comparison, the neurologist ratings of the UPDRS-III Facial
set was the Tufts Clinical data set used to assess hypomimia Expression score were strictly greater in the off state than in the
changes associated with the drug state. For each patient, we on state for only 46% (16/35) of participants. However, it is
extracted and analyzed all frames in the video. Our goal was to worth noting that the UPDRS-III Facial Expression score is
quantify PD hypomimia for each patient’s visit and see if on integer based and does not allow clinicians to assess changes
and off motor states had an impact on hypomimia as captured in facial expression that are more granular than these integer
by the neurologist’s UPDRS-III Facial Expression score and ratings. The clinical interview accuracies of the UPDRS-III
our algorithm. Facial Expression score and algorithm were 45% (15/33) and
55% (18/33), respectively.
To test if the algorithm was able to correctly classify PD
hypomimia, we computed the score of each clinical interview To quantify the sensitivity of our analysis, we provided a plot
video to see if it exceeded the decision threshold T. If the score highlighting the differences in detection as given by different
was above the threshold, the video was categorized as PD. The thresholds (the x-axis is scaled by T). Thresholds to separate
algorithm detected PD in 76% (25/33) of the off drug sessions the on state from the off state effectively were smaller than T,
(in comparison, the neurologist gave a UPDRS-III Facial which appeared reasonable as we expected the difference
Expression score higher than 0 for 88% [29/33] of these between the on and off states to be more subtle than the
sessions) and in 67% (22/33) of the on drug sessions (in difference between the PD and control groups. More precisely,
comparison, it was 70% [23/33] for the neurologist). This a threshold of 0.1 T provided an accuracy comparable to that
reduction in facial masking detection between the off and on of the neurologist (46% accuracy), and a threshold of 0.01 T
drug sessions for both the algorithm and the neurologist can be led to 60% accuracy (Figure 5).
attributed to drug efficacy in reducing PD symptoms.
https://www.jmir.org/2021/2/e21037 J Med Internet Res 2021 | vol. 23 | iss. 2 | e21037 | p. 6
(page number not for citation purposes)
XSL• FO
RenderXJOURNAL OF MEDICAL INTERNET RESEARCH Abrami et al
Figure 5. On-off sensitivity of the Tufts data set. On-off classification for a clinical visit is displayed as a function of threshold. On-off differences are
far more subtle than PD versus Control differences (on which the model was originally trained). The red line shows the percentage of participants for
which the neurologists rated the UPDRS-III Facial Expression score higher in the off state than in the on state. PD: Parkinson disease; UPDRS: United
Parkinson Disease Rating Scale.
all videos before PD diagnosis were below the optimal threshold
Longitudinal Severities of Masked Facies T for positive classification, and all videos after diagnosis were
We sought to retrospectively validate the algorithm’s ability to well above the threshold, highlighting the fact that the algorithm
characterize PD symptomology in an individual longitudinally. was able to capture hypomimia cues. Finally, we included a
The algorithm was applied to seven interview videos featuring confidence interval (as given by the third and seventh video
Alan Alda (officially diagnosed with PD in 2014) from 1974 distribution quantiles) associated with the video scores (Figure
to 2019. There was an increase in the algorithm’s PD 6).
classification before PD diagnosis to after diagnosis. Indeed,
https://www.jmir.org/2021/2/e21037 J Med Internet Res 2021 | vol. 23 | iss. 2 | e21037 | p. 7
(page number not for citation purposes)
XSL• FO
RenderXJOURNAL OF MEDICAL INTERNET RESEARCH Abrami et al
Figure 6. Validation with Alan Alda interviews. All videos after Mr Alda’s PD diagnosis are above the threshold T, whereas videos before his PD
diagnosis are below T (horizontal red line), indicating that the algorithm is sensitive to PD hypomimia symptomatology. Dots show the confidence
interval (third quantile and seventh quantile of the video density distribution). PD: Parkinson disease.
full range of relevant ages affected by PD (early onset PD
Discussion patients were not represented), which constrains generalizability.
Principal Results The effect of dopaminergic medication was not taken into
consideration when training the model, as all videos in the
In this proof-of-principle pilot study, we used deep learning to training data sets were classified as either PD or control, with
detect PD hypomimia from videos of people with and no consideration of on versus off medication state. There is
without PD. Our method was also able to detect the effect uncertainty linked to the video labels in the training data set, as
of dopamine replacement medication in participants during their it relied on the uploader’s self-report (ie, the title of the video),
clinical visit and to analyze the progression of symptoms in the not a clinical evaluation. Consequently, it is important to validate
actor Alan Alda before and after his diagnosis of PD. the present algorithm with clinically verified participants with
Comparison With Prior Work and an Alternative and without PD, as was performed in this work using clinically
Approach validated participants in on and off drug states. Moreover, while
gender and, to a lesser extent, age can be ascertained with some
A well-established method to identify facial expressions was degree of certainty for subjects in the training data set, additional
proposed by Ekman and Friesen [38], which describes visual demographic information is highly limited, making
facial movements related to the muscles involved in the generalization to larger test sets potentially susceptible to
production of emotions. Known as the Facial Action Coding demographic or other biases in the training sets. This
System (FACS), this method uses localized image information observation, coupled with the fact that the longitudinal study is
and has been previously applied to study parkinsonism limited as it was applied on only seven videos of one person,
[12,39]. However, the studies did not provide information on implies that more extensively curated training data sets as well
medication state or longitudinal changes of facial expressions as larger testing data sets will be required to validate the
in PD patients. robustness of our method.
An alternative approach to investigate the progression of PD as
Conclusions
a function of the ability to move specific facial muscles is to
use electromyography [7]. This approach may be considered Our algorithm may serve as a nonclinical marker for PD
less prone to artifacts of head movement, complexion, and facial hypomimia and on and off motor states. Unlike the lengthy
bone structure, but the use of electromyography at a participant’s physical examination techniques required for the clinical
home is technically challenging and impractical. assessment of PD, which require in-person or video
examinations that must be rated by a trained clinician, the
Limitations present automated technique is capable of rating videos of a
There are noteworthy limitations to our work. The training data patient’s face. This technique has the potential to improve the
set is limited, as in particular, it did not include people in the ability to continuously monitor the on and off states, even in the
https://www.jmir.org/2021/2/e21037 J Med Internet Res 2021 | vol. 23 | iss. 2 | e21037 | p. 8
(page number not for citation purposes)
XSL• FO
RenderXJOURNAL OF MEDICAL INTERNET RESEARCH Abrami et al
patient’s home. This can thereby serve as a serial data point for parkinsonism and as a nonobtrusive objective score to assess
use in at-home monitoring for PD or at-home assessment in a on and off states. Further study will be needed to assess the
PD clinical research study, with little patient burden and minimal value of this automated assessment in various clinical settings.
technological requirements. The proposed model was tested on PD hypomimia, but in theory,
it could be applied to other neurological conditions that produce
With a shift toward a greater role of telemedicine, an automated
other face signatures.
assessment of hypomimia could serve as a screening tool for
Acknowledgments
The authors acknowledge the help provided by Dr John Gunstad in the initial phase of the project (encouraging our efforts and
connecting us with clinical specialists in Parkinson disease) and the feedback provided by Dr Ajay Royyuru over several iterations
of the results. The authors would also like to thank Alan Alda for allowing us to display the outcome of our algorithm on some
of his publicly available videos.
Conflicts of Interest
None declared.
References
1. Frith C. Role of facial expressions in social interactions. Philos Trans R Soc Lond B Biol Sci 2009 Dec
12;364(1535):3453-3458 [FREE Full text] [doi: 10.1098/rstb.2009.0142] [Medline: 19884140]
2. Rinn WE. The neuropsychology of facial expression: a review of the neurological and psychological mechanisms for
producing facial expressions. Psychol Bull 1984 Jan;95(1):52-77. [Medline: 6242437]
3. Bersani G, Polli E, Valeriani G, Zullo D, Melcore C, Capra E, et al. Facial expression in patients with bipolar disorder and
schizophrenia in response to emotional stimuli: a partially shared cognitive and social deficit of the two disorders.
Neuropsychiatr Dis Treat 2013;9:1137-1144 [FREE Full text] [doi: 10.2147/NDT.S46525] [Medline: 23966784]
4. Gordin E, Lee TS, Ducic Y, Arnaoutakis D. Facial nerve trauma: evaluation and considerations in management.
Craniomaxillofac Trauma Reconstr 2015 Mar;8(1):1-13 [FREE Full text] [doi: 10.1055/s-0034-1372522] [Medline:
25709748]
5. Pick S, Goldstein LH, Perez DL, Nicholson TR. Emotional processing in functional neurological disorder: a review,
biopsychosocial model and research agenda. J Neurol Neurosurg Psychiatry 2019 Jun;90(6):704-711 [FREE Full text] [doi:
10.1136/jnnp-2018-319201] [Medline: 30455406]
6. Shiota MN, Simpson ML, Kirsch HE, Levenson RW. Emotion recognition in objects in patients with neurological disease.
Neuropsychology 2019 Nov;33(8):1163-1173 [FREE Full text] [doi: 10.1037/neu0000587] [Medline: 31478721]
7. Livingstone SR, Vezer E, McGarry LM, Lang AE, Russo FA. Deficits in the Mimicry of Facial Expressions in Parkinson's
Disease. Front Psychol 2016;7:780 [FREE Full text] [doi: 10.3389/fpsyg.2016.00780] [Medline: 27375505]
8. Marneweck M, Hammond G. Voluntary control of facial musculature in Parkinson's disease. J Neurol Sci 2014 Dec
15;347(1-2):332-336. [doi: 10.1016/j.jns.2014.11.003] [Medline: 25467144]
9. Vogel HP. Symptoms of depression in Parkinson's disease. Pharmacopsychiatria 1982 Nov;15(6):192-196. [doi:
10.1055/s-2007-1019537] [Medline: 7156182]
10. Fahn S, Elton R. Unified Parkinson's Disease Rating Scale. In: Fahn S, Marsden CD, Goldstein M, Calne DB, editors.
Recent Developments in Parkinson's Disease. Florham Park, NJ: Macmillan Healthcare Information; 1987:153-163.
11. Ricciardi L, Visco-Comandini F, Erro R, Morgante F, Volpe D, Kilner J, et al. Emotional facedness in Parkinson's disease.
J Neural Transm (Vienna) 2018 Dec;125(12):1819-1827. [doi: 10.1007/s00702-018-1945-6] [Medline: 30343335]
12. Wu P, Gonzalez I, Patsis G, Jiang D, Sahli H, Kerckhofs E, et al. Objectifying facial expressivity assessment of Parkinson's
patients: preliminary study. Comput Math Methods Med 2014;2014:427826 [FREE Full text] [doi: 10.1155/2014/427826]
[Medline: 25478003]
13. Marsili L, Agostino R, Bologna M, Belvisi D, Palma A, Fabbrini G, et al. Bradykinesia of posed smiling and voluntary
movement of the lower face in Parkinson's disease. Parkinsonism Relat Disord 2014 Apr;20(4):370-375. [doi:
10.1016/j.parkreldis.2014.01.013] [Medline: 24508573]
14. Gunnery SD, Naumova EN, Saint-Hilaire M, Tickle-Degnen L. Mapping spontaneous facial expression in people with
Parkinson's disease: A multiple case study design. Cogent Psychol 2017 Sep 25;4(1):1376425 [FREE Full text] [doi:
10.1080/23311908.2017.1376425] [Medline: 29607351]
15. Fei Z, Yang E, Li D, Butler S, Ijomah W, Li S, et al. Deep convolution network based emotion analysis towards mental
health care. Neurocomputing 2020 May;388:212-227 [FREE Full text] [doi: 10.1016/j.neucom.2020.01.034]
16. Leo M, Carcagnì P, Distante C, Spagnolo P, Mazzeo PL, Rosato AC, et al. Computational Assessment of Facial Expression
Production in ASD Children. Sensors (Basel) 2018 Nov 16;18(11) [FREE Full text] [doi: 10.3390/s18113993] [Medline:
30453518]
https://www.jmir.org/2021/2/e21037 J Med Internet Res 2021 | vol. 23 | iss. 2 | e21037 | p. 9
(page number not for citation purposes)
XSL• FO
RenderXJOURNAL OF MEDICAL INTERNET RESEARCH Abrami et al
17. Yolcu G, Oztel I, Kazan S, Oz C, Palaniappan K, Lever TE, et al. Facial expression recognition for monitoring neurological
disorders based on convolutional neural network. Multimed Tools Appl 2019 Jul 23;78(22):31581-31603 [FREE Full text]
[doi: 10.1007/s11042-019-07959-6]
18. Bek J, Poliakoff E, Lander K. Measuring emotion recognition by people with Parkinson's disease using eye-tracking with
dynamic facial expressions. J Neurosci Methods 2020 Feb 01;331:108524. [doi: 10.1016/j.jneumeth.2019.108524] [Medline:
31747554]
19. Chen H, Wu D, He J, Li S, Su W. Emotion Recognition in Patients With Parkinson Disease. Cogn Behav Neurol 2019
Dec;32(4):247-255. [doi: 10.1097/WNN.0000000000000209] [Medline: 31800485]
20. Katsikitis M, Pilowsky I. A study of facial expression in Parkinson's disease using a novel microcomputer-based method.
J Neurol Neurosurg Psychiatry 1988 Mar 01;51(3):362-366 [FREE Full text] [doi: 10.1136/jnnp.51.3.362] [Medline:
3361329]
21. Bandini A, Orlandi S, Escalante HJ, Giovannelli F, Cincotta M, Reyes-Garcia CA, et al. Analysis of facial expressions in
parkinson's disease through video-based automatic methods. J Neurosci Methods 2017 Apr 01;281:7-20. [doi:
10.1016/j.jneumeth.2017.02.006] [Medline: 28223023]
22. Bowers D, Miller K, Bosch W, Gokcay D, Pedraza O, Springer U, et al. Faces of emotion in Parkinsons disease:
micro-expressivity and bradykinesia during voluntary facial expressions. J Int Neuropsychol Soc 2006 Nov;12(6):765-773.
[doi: 10.1017/S135561770606111X] [Medline: 17064440]
23. Gonzalez I, Sahli H, Enescu V, Verhelst W. Context-Independent Facial Action Unit Recognition Using Shape and Gabor
Phase Information. In: D’Mello S, Graesser A, Schuller B, Martin JC, editors. Affective Computing and Intelligent Interaction.
ACII 2011. Lecture Notes in Computer Science, vol 6974. Berlin, Heidelberg: Springer; 2011:548-557.
24. Leo M, Carcagnì P, Mazzeo P, Spagnolo P, Cazzato D, Distante C. Analysis of Facial Information for Healthcare Applications:
A Survey on Computer Vision-Based Approaches. Information 2020 Feb 26;11(3):128 [FREE Full text] [doi:
10.3390/info11030128]
25. Kanade T, Cohn J, Tian Y. Comprehensive Database for Facial Expression Analysis. In: Proceedings Fourth IEEE
International Conference on Automatic Face and Gesture Recognition (Cat. No. PR00580). 2000 Presented at: Fourth IEEE
International Conference on Automatic Face and Gesture Recognition; March 28-30, 2000; Grenoble, France. [doi:
10.1109/AFGR.2000.840611]
26. Leo M, Carcagnì P, Distante C, Mazzeo PL, Spagnolo P, Levante A, et al. Computational Analysis of Deep Visual Data
for Quantifying Facial Expression Production. Applied Sciences 2019 Oct 25;9(21):4542. [doi: 10.3390/app9214542]
27. Bologna M, Fabbrini G, Marsili L, Defazio G, Thompson PD, Berardelli A. Facial bradykinesia. J Neurol Neurosurg
Psychiatry 2013 Jun;84(6):681-685. [doi: 10.1136/jnnp-2012-303993] [Medline: 23236012]
28. Tan JR, Coulson S, Keep M. Face-to-Face Versus Video Assessment of Facial Paralysis: Implications for Telemedicine.
J Med Internet Res 2019 Apr 12;21(4):e11109 [FREE Full text] [doi: 10.2196/11109] [Medline: 30977734]
29. Agnisarman S, Narasimha S, Chalil Madathil K, Welch B, Brinda F, Ashok A, et al. Toward a More Usable Home-Based
Video Telemedicine System: A Heuristic Evaluation of the Clinician User Interfaces of Home-Based Video Telemedicine
Systems. JMIR Hum Factors 2017 Apr 24;4(2):e11 [FREE Full text] [doi: 10.2196/humanfactors.7293] [Medline: 28438724]
30. Marceglia S, Rossi E, Rosa M, Cogiamanian F, Rossi L, Bertolasi L, et al. Web-based telemonitoring and delivery of
caregiver support for patients with Parkinson disease after deep brain stimulation: protocol. JMIR Res Protoc 2015 Mar
06;4(1):e30 [FREE Full text] [doi: 10.2196/resprot.4044] [Medline: 25803512]
31. Pan D, Dhall R, Lieberman A, Petitti DB. A mobile cloud-based Parkinson's disease assessment system for home-based
monitoring. JMIR Mhealth Uhealth 2015 Mar 26;3(1):e29 [FREE Full text] [doi: 10.2196/mhealth.3956] [Medline: 25830687]
32. Wolf L, Hassner T, Maoz I. Face recognition in unconstrained videos with matched background similarity. In: CVPR 2011.
2011 Presented at: Conference on Computer Vision and Pattern Recognition (CVPR); June 20-25, 2011; Providence, RI,
USA. [doi: 10.1109/cvpr.2011.5995566]
33. Simonyan K, Zisserman A. Very Deep Convolutional Networks for Large-Scale Image Recognition. arXiv. URL: https:/
/arxiv.org/abs/1409.1556 [accessed 2021-02-02]
34. Erb K, Daneault J, Amato S, Bergethon P, Demanuele C, Kangarloo T, et al. The BlueSky Project: monitoring motor and
non-motor characteristics of people with Parkinson’s disease in the laboratory, a simulated apartment, and home and
community settings. Mov Disord. 2018. URL: https://tinyurl.com/psw6wb9f [accessed 2021-02-02]
35. Erb MK, Karlin DR, Ho BK, Thomas KC, Parisi F, Vergara-Diaz GP, et al. mHealth and wearable technology should
replace motor diaries to track motor fluctuations in Parkinson's disease. NPJ Digit Med 2020 Jan 17;3(1):6 [FREE Full
text] [doi: 10.1038/s41746-019-0214-x] [Medline: 33452390]
36. Abrami A, Heisig S, Ramos V, Thomas KC, Ho BK, Caggiano V. Using an unbiased symbolic movement representation
to characterize Parkinson's disease states. Sci Rep 2020 Apr 30;10(1):7377 [FREE Full text] [doi:
10.1038/s41598-020-64181-3] [Medline: 32355166]
37. Mahadevan N, Demanuele C, Zhang H, Volfson D, Ho B, Erb MK, et al. Development of digital biomarkers for resting
tremor and bradykinesia using a wrist-worn wearable device. NPJ Digit Med 2020 Jan 15;3(1):5 [FREE Full text] [doi:
10.1038/s41746-019-0217-7] [Medline: 33441944]
https://www.jmir.org/2021/2/e21037 J Med Internet Res 2021 | vol. 23 | iss. 2 | e21037 | p. 10
(page number not for citation purposes)
XSL• FO
RenderXJOURNAL OF MEDICAL INTERNET RESEARCH Abrami et al
38. Ekman P, Friesen W. Facial Action Coding System: A Technique for the Measurement of Facial Movement. 1978. URL:
https://www.semanticscholar.org/paper/Facial-action-coding-system%3A-a-technique-for-the-of-Ekman-Friesen/
1566cf20e2ba91ca8857c30083419bf7c127094b [accessed 2021-02-02]
39. Vinokurov N, Arkadir D, Linetsky E, Bergman H, Weinshall D. Quantifying Hypomimia in Parkinson Patients Using a
Depth Camera. In: Serino S, Matic A, Giakoumis D, Lopez G, Cipresso P, editors. Pervasive Computing Paradigms for
Mental Health. MindCare 2015. Communications in Computer and Information Science, vol 604. Cham: Springer; 2016:63-71.
Abbreviations
AUROC: area under the receiver operating characteristic curve
L-DOPA: levodopa
PD: Parkinson disease
UPDRS: United Parkinson Disease Rating Scale
Edited by G Eysenbach; submitted 04.06.20; peer-reviewed by R Dorsey, S Guness, M Leo; comments to author 24.06.20; revised
version received 30.07.20; accepted 18.12.20; published 22.02.21
Please cite as:
Abrami A, Gunzler S, Kilbane C, Ostrand R, Ho B, Cecchi G
Automated Computer Vision Assessment of Hypomimia in Parkinson Disease: Proof-of-Principle Pilot Study
J Med Internet Res 2021;23(2):e21037
URL: https://www.jmir.org/2021/2/e21037
doi: 10.2196/21037
PMID: 33616535
©Avner Abrami, Steven Gunzler, Camilla Kilbane, Rachel Ostrand, Bryan Ho, Guillermo Cecchi. Originally published in the
Journal of Medical Internet Research (http://www.jmir.org), 22.02.2021. This is an open-access article distributed under the terms
of the Creative Commons Attribution License (https://creativecommons.org/licenses/by/4.0/), which permits unrestricted use,
distribution, and reproduction in any medium, provided the original work, first published in the Journal of Medical Internet
Research, is properly cited. The complete bibliographic information, a link to the original publication on http://www.jmir.org/,
as well as this copyright and license information must be included.
https://www.jmir.org/2021/2/e21037 J Med Internet Res 2021 | vol. 23 | iss. 2 | e21037 | p. 11
(page number not for citation purposes)
XSL• FO
RenderXYou can also read