Trajectories of Cognitive Function and Their Machine Learning-based Prediction Models in Older Adults: a 16 Years Follow-up in the Chinese ...
←
→
Page content transcription
If your browser does not render page correctly, please read the page content below
Trajectories of Cognitive Function and Their
Machine Learning-based Prediction Models in Older
Adults: a 16 Years Follow-up in the Chinese
Longitudinal Healthy Longevity Survey
Yafei Wu
Xiamen University School of Public Health
Maoni Jia
Xiamen University School of Public Health
Chaoyi Xiang
Xiamen University School of Public Health
Shaowu Lin
Xiamen University School of Public Health
Zhongquan Jiang
Xiamen University School of Public Health
Ya Fang ( fangya@xmu.edu.cn )
Xiamen University School of Public Health https://orcid.org/0000-0002-9895-3234
Research
Keywords: Cognitive trajectories, Machine learning, Growth mixture model, MMSE
Posted Date: July 26th, 2021
DOI: https://doi.org/10.21203/rs.3.rs-725498/v1
License: This work is licensed under a Creative Commons Attribution 4.0 International License.
Read Full License
Page 1/25Abstract
Background: Cognitive decline shows heterogeneous with increasing age. The trajectory of cognitive
function is yet to be fully investigated in older Chinese. Early identification of such trend is essential for
the prevention of high-risk population related to cognitive decline. This study aimed to explore the
heterogeneity and determinants of cognitive trajectories, and construct prediction models for
distinguishing cognitive trajectories among the elderly Chinese at a community level.
Methods: This study included 3502 older adults aged 65-105 years at their first observations in the
Chinese Longitudinal Healthy Longevity Survey from 2002 to 2018. The Chinese version Mini-Mental
State Examination (MMSE) was used for measuring cognitive function. The heterogeneity of cognitive
trajectories was identified through mixed growth model, and the determinants of cognitive trajectories
were analyzed by logistic regression. Under a consideration of feature selection, machine learning
algorithms, namely logistic regression (LR), support vector machine (SVM), and an integrated algorithm
combining LR and SVM (stacking), were used to predict cognitive trajectories using epidemiological
variables. Area under the receiver operating characteristic curve (AUROC) and brier score were used to
assess discrimination and calibration, respectively.
Results: Two distinct cognitive trajectories were identified according to the changes of MMSE scores:
stable-function (93.6%), and rapid-decline (6.4%). Older age, female gender, Han ethnicity, having no
schooling, rural residents, low frequency leisure activities, and low baseline ADL score were associated
with the rapid decline in cognitive function. For classification of two trajectories, the performance of LR,
SVM and stacking algorithms with feature selection were comparable, of which achieved 0.66 of
balanced accuracy, 0.74 of sensitivity, 0.73 of F1 score, 0.66 of AUROC, and 0.25 of brier score. Among
the predictors, age and psychological well-being were the most effective variables for distinguishing two
trajectories.
Conclusions: Two cognitive trajectories were identified among older Chinese. The identified determinants
of trajectories could be targeted for constructing early risk prediction models.
Background
Dementia is a degenerative disease of the central nervous system accompanied by cognitive decline.
According to the World Alzheimer's Report, more than 50 million people worldwide were estimated to be
living with dementia in 2020. Moreover, the number will increase to 152 million by 2050 with rapid aging
[1]. Until now, the etiology and pathogenesis of dementia are still unclear, and there is no effective cure in
clinical practice [2]. About three quarters of dementia patients worldwide were not diagnosed in time,
especially in low- and middle-income countries. It was estimated that the annual global losses related to
dementia were $818 billion, which was equivalent to the output of the 18th largest economy [1].
Therefore, it is crucial to identify the high-risk individuals of cognitive decline and evaluate their long-term
changing patterns for the timely prevention of dementia.
Page 2/25Cognitive function is constantly changing with age increasing. Previous studies have demonstrated that
heterogeneity exists in trajectories of cognitive function over time [3–6]. While trajectory of cognitive
function is yet to be fully investigated in older Chinese. Meanwhile, previous prediction studies related to
cognitive function mainly focused on diagnostic conversion, especially for mild cognitive impairment
(MCI) converts into Alzheimer disease (AD) [7–10], and according to our understanding, only few studies
started to make predictions of cognitive trajectories [11, 12]. Therefore, identification and prediction of
trajectories of cognitive function have significant implications for primary prevention targeted at potential
vulnerable older adults.
Machine learning (ML), which is a set of computational methods that can discover complex nonlinear
relationships between inputs and outputs, has been widely used in disease prediction [13]. In medical
practice, ML can process complex medical data and construct prediction models for decision-making.
Most models have been derived using logistic regression or support vector machine in predicting
cognitive-related diseases as well as other psychological diseases, and have showed decent performance
[14, 15]. Currently, with the development of computer technology and the accumulation of high-volume
data, machine learning has been played an increasingly important role in health risk prediction.
This study focused on two issues: first, mixed growth model was used to explore the trajectories of
cognitive function among the older Chinese, and the determinants of cognitive trajectories were also
analyzed. Then, under a consideration of feature selection (recursive feature elimination), machine
learning algorithms, namely logistic regression (LR), support vector machine (SVM), and an integrated
method combining both LR and SVM (known as stacking), were used to predict the types of cognitive
trajectories using epidemiological variables.
Methods
Study design and participants
This study retrospectively collected data from the Chinese Longitudinal Healthy Longevity Survey
(CLHLS). CLHLS is an ongoing, prospective cohort study of community-dwelling Chinese older
individuals [16, 17]. It covers 22 of the 31 mainland provinces, encompassing 85% of the total population
in China. Starting in 1998, a follow-up investigation was conducted every 3 years, and there are totally 8
waves (1998, 2000, 2002, 2005, 2008, 2011, 2014, and 2018) so far. The CLHLS study was approved by
the Research Ethics Committee of Peking University (IRB00001052-13074), and was publicly available at
the Peking University Open Research Data (https://opendata.pku.edu.cn/dataverse/CHADS ). More details
of the study design have been described in previous studies, and the survey data have been widely
reported as high-quality [18].
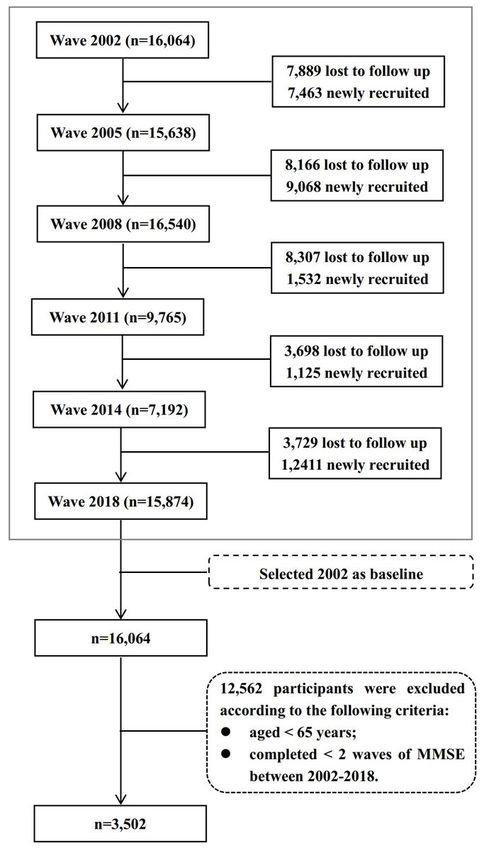
The first 2 waves (1998 and 2000) were excluded because they mainly targeted for participants older
than 80 years. Thus, six recent investigations from 2002 to 2018 were used for analysis. Data in 2002
were selected as baseline in this study. For trajectories analysis, those who had complete information in
the Chinese version Mini-Mental State Examination (MMSE) for at least two waves were included. Finally,
Page 3/25a total of 3502 participants aged ≥ 65 years were included. The flow chart of the CLHLS follow-up and
the sample selection of the current analysis is presented in Fig. 1.
Cognitive Assessment
The CLHLS used the Chinese version of the Mini-Mental State Examination (MMSE), whose validity and
reliability have been verified [17, 19], as a measure of global cognitive function at each wave. MMSE
contains a total of 24 questions, involving 7 dimensions of orientation, food counting within one minute,
memory, calculation, drawing, recall and language. Except for food counting within one minute (one point
for each food, and not exceed 7 points of a maximum score), other questions were coded as follows: 1
point (correct answer) and 0 point (wrong answer). The total scores of the MMSE range from 0 to 30, with
higher scores representing higher cognitive function. The MMSE scores were used to identify the potential
trajectories of cognitive function in the current analysis.
Measurement of Predictors
Predictors in this study included sociodemographic characteristics, lifestyles, psychological well-being
(PWB) and physical activity, and chronic diseases. For sociodemographic characteristics, age, sex (man,
woman), ethnicity (Han ancestry, minority), education (illiterate, primary school, junior high and above),
marital status (unmarried, separated or divorced or widowed, married), residence (rural, urban), and co-
residence (yes, no) were included. For lifestyles, regular fruits intake (yes, no), regular vegetables intake
(yes, no), regular tea consumption (yes, no), smoker (yes, no), alcohol drinker (yes, no), regular exercise
(yes, no), and leisure activity (yes, no) were considered. Specifically, leisure activities included housework,
personal outdoor activities, garden work, reading newspapers or books, raising domestic animals or pets,
playing cards or mahjong, watching TV or listening to the radio, and taking part in some social activities.
According to previous study [5], each item had 5 levels and was coded as follows: “almost every day”
(coded as 1), “not daily, but once a week” (coded as 2), “not weekly, but at least once a month” (coded as
3), “not monthly, but sometimes” (coded as 4), and “never” (coded as 5). The total scores of the above 8
items ranged 8–40. A high frequency was defined as “being scored at 40th percentile or below”, and a
low frequency as “being scored over 40th percentile”. From 1998 to 2005 in CLHLS, 7 items (optimism,
conscientiousness, personal control, happiness, neuroticism, loneliness, and self-esteem) were used to
test the psychological state. The use of these items for measuring PWB has been used in several
previous studies [20–22]. Specifically, if the item is helpful to PWB, we coded as follows: 5 (“always”), 4
(“often”), 3 (“sometimes”), 2 (“seldom”), and 1 (“never”); and if the item is harmful to PWB, we coded in an
opposite way, and 0 point were code for “unable to answer” for all items. Therefore, the total scores of
PWB ranged 0–35, of which a higher score indicating much better psychological state. Physical activity
included activities of daily living (ADL) and instrumental ADL (IADL). ADL was assessed by the 6 daily
activities (bathing, dressing, continence, using the toilet, indoor transferring, and feeding themselves), and
IADL was assessed by the 8 instrumental activities (shopping, cooking, visiting neighbors, doing laundry,
walking continuously for 1 km, continuously crouching and standing up 3 times, lifting a weight of 5 kg,
and taking public transportation) [23]. Each item was coded as: 0 (“with complete assistance”), 1 (“with
part assistance”), or 2 (“independently”). So, the total scores of ADL and IADL ranged 0–12, and 0–16,
Page 4/25respectively. For chronic diseases, self-reported diagnosis of hypertension (yes, no), diabetes (yes, no),
and stroke (yes, no) were selected. Detailed measurements of variables were summarized in
Supplementary Table S1. The multiple imputation approach was applied to reduce the influence of
missing values on predictors in the analyses.
Feature selection
Feature selection was performed for reducing the dimensions of variables and improving model
performance. In the current study, recursive feature elimination (RFE) was used. RFE is an ML method for
feature selection that combines with several classifiers to eliminate redundant variables, thus identifying
the most important factors for each classifier [24]. In order to select the best combination of predictors, a
10-flod cross validation was combined with RFE, that was, RFE was performed on each subset of input
data, and validation error of all subsets was calculated. Finally, the subset with smallest error was
selected as the optimal combination.
Trajectories of cognitive function
The Growth Mixed Model (GMM) was used to explore the heterogeneity of cognitive trajectories, which
could divide populations into several groups based on the differences in growth trajectories. Previous
studies suggested that a latent growth curve model (LGCM) and latent class growth model (LCGM)
should be used to explore the shape of growth curve and the number of potential trajectory classes
before GMM analysis [25, 26]. When the optimal LCGM model was selected, the GMM model was fitted
subsequently. For model selection, statistical indices and interpretability are often considered. Statistical
indices include sample-size adjusted Bayesian information criteria (SABIC), entropy, Vuong-Lo-Mendell-
Rubin likelihood ratio test (VLMR-LRT), and proportion of the smallest class. SABIC is an information
criterion with a more reduction, representing an improvement of model. Entropy is a measure of
classification accuracy, ranging from 0 to 1. The larger the entropy, the better the trajectories
classification. VLMR-LRT compares the results of the k-1 class model with k class model. A significant p
value (< 0.05) indicates that k class model is better than k-1 class model. Besides, each trajectory class
must contain enough samples, no less than 5% of total population. Followed with previous studies [5, 23],
trajectory classes ranged 1 to 5 were tested in this study, and then selected the most favorable class
according to the above indices.
Derivation and evaluation of cognitive trajectories prediction models
For prediction of cognitive trajectories, the commonly used logistic regression (LR) and support vector
machine (SVM) in the field of psychology were selected. Considering that LR and SVM are all single
classifiers, so a new method that combines both LR and SVM (known as stacking) is further constructed
for distinguishing different trajectories. Stacking is one of the ensemble learning algorithms, which can
integrate various of ML algorithms into achieving a more powerful learner [27]. For LR, two
hyperparameters (types of penalty: “none”, “L1”, “L2”, “elasticnet”, and the regularization term C:
searching from 0.01, 0.1, 1, 10, 100) were tuned with 10-fold cross validation [24] in the training set, and
Page 5/25finally penalty and C were set as “L1” and 10, respectively. For SVM, the kernel parameter (“linear”, “rbf”,
“poly”, “sigmoid”) and regularization term (searching from 0.01, 0.1, 1, 10, 100) were tuned, and finally the
“linear” kernel and 1 of C were selected. As for stacking, LR and SVM were served as the base classifiers
in the first layer, and LR was used for the final prediction in the second layer.
Given that the imbalanced classes between cognitive trajectories, synthetic minority oversampling
technique (SMOTE) [28] was used to process the training data before prediction. In the stage of
performance evaluation, balanced accuracy, considering both positive and negative classes, were chosen
to measure how accurate is the overall performance of prediction model is. Also, the F1 score, which
combines both precision and recall, was also calculated. Area under the receiver operating characteristic
curve (AUROC) and its 95% confidence interval (95% CI) were used to evaluate the discrimination of
prediction models, and calibration was evaluated by brier score. In order to obtain stable estimation of
model performance, we looped through the code 1000 times for LR and 100 times for SVM and stacking
(for time consideration).
Sensitivity analysis
Given that trajectory analysis is more stable for participants with 3 or more observations over time, we
conducted a sensitivity analyses by including participants who had complete information on MMSE for
at least 3 waves. Followed by the selection criteria in this study, 1668 participants were included for
sensitivity analysis. Besides, trajectory of cognitive function may also be influenced by potential factors
such as age, sex, and education [29]. Therefore, a further sensitivity analysis was performed with a
consideration of age, sex, and education as covariates for participants who had complete information on
MMSE for at least 2 waves (n = 3502).
Statistical analysis
Continuous variables were presented as mean ± standard deviation. Categorical variables were presented
as percentages. The comparisons of baseline characteristics among different trajectories were performed
by appropriately choosing ANOVA test and chi square test. All the above analysis were conducted with
SPSS 25.0. Trajectory class analyses were performed with Mplus 8.3 (Muthén and Muthén, 2019).
Feature selection, model derivation, and model evaluation were performed with scikit-learn package in
Python 3.7.6. A two-sided p-value of < 0.05 was considered statistically significant.
Results
Heterogeneous trajectories of cognitive function
A linear model was chosen for LCGM model because a relatively lower SABIC was observed in a linear
LGCM model. Among the 1 to 5-class LCGM models, a 2-class model were selected because of higher
entropy (0.92), and a > 5% smallest class (p value of VLMR-LRT was < 0.0001). Finally, a better fit (SABIC
Page 6/25= 48305.86, entropy = 0.93, p value of VLMR-LRT < 0.0001) and good separation of different classes
(smallest class = 6.40%) were also observed in the GMM model.
Table 1
Performance of latent class growth model and growth mixture model
SABIC Entropy VLMR-LRT Smallest class
LGCM
linear 49352.73 — — —
quadratic 49359.34 — — —
cubic 49361.33 — — —
LCGM
1-class 49804.05 — — 100%
2-class 48356.83 0.92 0.0000 7.17%
3-class 47668.92 0.91 0.1883 4.91%
4-class 47201.83 0.89 0.4556 1.31%
5-class 46879.68 0.84 0.6411 1.37%
GMM
2-class 48305.86 0.93 0.0082 6.40%
NOTE: SABIC, sample-size adjusted Bayesian information criteria; VLMR-LRT, VUONG-LO-MENDELL-
RUBIN likelihood ratio test; LGCM, latent growth curve model; LCGM, latent class growth model; GMM,
growth mixture model.
Figure 1 shows the mean MMSE scores over time for the two trajectory classes: stable-function (93.6%,
intercept = 28.402, p < 0.001; slope = -0.138, p < 0.001), and rapid-decline (6.4%, intercept = 24.410, p <
0.001; slope = -0.2.454, p < 0.005). The sensitivity analyses identified cognitive trajectories with similar
shapes and distributions among participants who had complete information on MMSE for at least 3
waves (Supplementary Figure S1). With adjusting age, sex, and education, similar results were also
observed among participants who had complete information on MMSE for at least 2 waves
(Supplementary Figure S2), and we found that there were differences in the baseline MMSE score
between different genders (higher in man compared with woman, p < 0.001, Supplementary Table S2) as
well as between different education level (higher in high education level compared with low education
level, p < 0.001), but the effects of sex, and education on the slope were not significant (p = 0.227, p =
0.394, respectively). Meanwhile, age showed a negative effect on the MMSE score in each wave (all p
values < 0.001).
Page 7/25Baseline characteristics of study population
Page 8/25Table 2
Sample Characteristics by cognitive trajectories classes in 2002
Total sample (N Trajectory Class P-value# Missing
= 3502) data
Normal Rapid-
decline
(n =
3278) (n = 224)
Sociodemographic Characteristics
Age 75.64 ± 8.17 75.23 ± 81.62 ± < 0.001 —
7.97 8.67
Sex
Male 2108 (60.2%) 2012 96 < 0.001 —
(61.4%) (42.9%)
Female 1394 (39.8%) 1266 128
(38.6%) (57.1%)
Ethnicity
Han Ancestry 3335 (95.2%) 3113 222 0.005 —
(95.0%) (99.1%)
Minority 167 (4.8%) 165 2 (0.9%)
(5.0%)
Education
Illiterate 1280 (36.6%) 1144 136 < 0.001 6
(35.0%) (60.7%) (0.17%)
Primary School 1226 (35.1%) 1163 63
(35.5%) (28.1%)
Junior High and above 990 (28.3%) 965 25
(29.5%) (11.2%)
Marital Status
Unmarried 39 (1.1%) 37 (1.1%) 2 (0.9%) < 0.001 —
Married 2020 (57.7%) 1943 77
(59.3%) (34.4%)
NOTE. Values are presented as mean ± standard deviation, number (%), or median (interquartile
range).
* PWB = psychological well-being, ADL = activity of daily living, IADL = instrumental activity of daily
living.
# Null hypothesis: no difference across the two classes
Page 9/25Total sample (N Trajectory Class P-value# Missing
= 3502) data
Normal Rapid-
decline
(n =
3278) (n = 224)
Separated/Divorced/Widowed 1443 (41.2%) 1298 145
(39.6%) (64.7%)
Residence
Urban 1652 (47.2%) 1567 85 0.004 —
(47.8%) (37.9%)
Rural 1850 (52.8%) 1711 139
(52.2%) (62.1%)
Co-residence
Yes 3015 (86.1%) 2838 177 0.002 —
(86.6%) (79.0%)
No 487 (13.9%) 440 47
(13.4%) (21.0%)
Lifestyles
Regular Fruit Intake
Yes 1400 (40.0%) 1328 72 0.013 —
(40.5%) (32.1%)
No 2102 (60.0%) 1950 152
(59.5%) (67.9%)
Regular Vegetables Intake
Yes 3184 (90.9%) 2987 197 0.109 —
(91.1%) (87.9%)
No 318 (9.1%) 291 27
(8.9%) (12.1%)
Regular Tea Consumption
Yes 1331 (38.0%) 1267 64 0.003 —
(38.7%) (28.6%)
NOTE. Values are presented as mean ± standard deviation, number (%), or median (interquartile
range).
* PWB = psychological well-being, ADL = activity of daily living, IADL = instrumental activity of daily
living.
# Null hypothesis: no difference across the two classes
Page 10/25Total sample (N Trajectory Class P-value# Missing
= 3502) data
Normal Rapid-
decline
(n =
3278) (n = 224)
No 2171 (62.0%) 2011 160
(61.3%) (71.4%)
Smoker
Yes 954 (27.2%) 907 47 0.029 1
(27.7%) (21.0%) (0.03%)
No 2547 (72.8%) 2370 177
(72.3%) (79.0%)
Alcohol Drinker
Yes 953 (27.2%) 897 56 0.461 3
(27.4%) (25.1%) (0.09%)
No 2546 (72.8%) 2379 167
(72.6%) (74.9%)
Regular Exercise
Yes 1682 (48.1%) 1592 90 0.017 2
(48.6%) (40.4%) (0.06%)
No 1818 (51.9%) 1685 133
(51.4%) (59.6%)
Leisure Activity
Low Frequency 2016 (57.6%) 1835 181 < 0.001 —
(56.0%) (80.8%)
High Frequency 1486 (42.4%) 1443 43
(44.0%) (19.2%)
Mental State & Metal State
PWB Score* 27.25 ± 4.10 27.29 ± 26.76 ± 0.062 —
4.10 3.96
ADL Score* 11.88 ± 0.56 11.90 ± 11.61 ± < 0.001 —
0.52 0.97
NOTE. Values are presented as mean ± standard deviation, number (%), or median (interquartile
range).
* PWB = psychological well-being, ADL = activity of daily living, IADL = instrumental activity of daily
living.
# Null hypothesis: no difference across the two classes
Page 11/25Total sample (N Trajectory Class P-value# Missing
= 3502) data
Normal Rapid-
decline
(n =
3278) (n = 224)
IADL Score* 14.74 ± 2.66 14.85 ± 13.16 ± < 0.001 —
2.53 3.86
Chronic Disease
Hypertension
Yes 625 (18.4%) 589 36 0.546 100
(18.5%) (16.8%) (2.86%)
No 2777 (81.6%) 2599 178
(81.5%) (83.2%)
Diabetes
Yes 85 (2.5%) 80 (2.5%) 5 (2.3%) 0.875 100
(2.86%)
No 3317 (97.5%) 3108 209
(97.5%) (97.7%)
Stroke
Yes 168 (4.9%) 158 10 (4.7%) 0.878 100
(5.0%) (2.86%)
No 3234 (95.1%) 3032 202
(95.0%) (95.3%)
NOTE. Values are presented as mean ± standard deviation, number (%), or median (interquartile
range).
* PWB = psychological well-being, ADL = activity of daily living, IADL = instrumental activity of daily
living.
# Null hypothesis: no difference across the two classes
Table 2 shows the results of baseline characteristics of the study sample with different trajectory classes.
This study identified 3278 participants with “stable-function” class, 224 participants with “rapid-decline”
class. The mean age of the whole population was 75.64 years; and 60.2% of them were male. Of the
whole population, 36.6% were illiterate, 57.5% were in married, and 52.5% of them were rural residents.
Most of them were Han ancestry (95.2%) and lived with their household members (86.1%). About 91.0%
participants often had vegetables intake, while a much lower proportion were existed in fresh fruit intake
(40.0%), tea consumption (38.0%), regular exercise (48.1%), and high frequency leisure activity (42.4%).
The smoker and alcohol drinker accounted both 27.2%. The baseline mental state score was 27.25, and
the baseline ADL and IADL scores were 11.88, and 14.74, respectively. Hypertension (18.4%) was
Page 12/25common among the older, followed by stroke (4.9%) and diabetes (2.5%). For the comparisons of
baseline characteristics among trajectory classes, significant differences were found in all variables
except for alcohol drinker, mental state score, and chronic diseases (hypertension, diabetes, and stroke).
Comparisons between the analytical sample and drop-out sample are presented in Supplementary Tables
S3. The sample in the current analysis was younger, having higher education level, having higher
frequency leisure activity, better mental state, better cognitive functioning, better activity of daily living,
having diabetes, and more likely to be rural participants.
Determinants of cognitive trajectories
Table 3 summarizes the results of the associations between potential risk factors and cognitive
trajectories. Compared with the stable-function class, individuals who were older, being female, being Han
ancestry, having low level education, living in rural districts, having low-frequency leisure activity, having
low ADL score were more likely to develop a rapid-decline trajectory.
Page 13/25Table 3
Binary logistic regression analysis for influencing factors of cognitive trajectories
Odds Ratio (95% CI) P-value
Age 1.07 (1.05–1.09) 0.000
Sex (Ref: Male)
Female 1.70 (1.17–2.48) 0.005
Ethnicity (Ref: Han Ancestry)
Minority 0.17 (0.04–0.69) 0.013
Education (Ref: Illiterate)
Primary School 0.65 (0.45–0.93) 0.018
Junior High and above 0.40 (0.24–0.67) 0.000
Marital Status (Ref: Unmarried)
Married 1.15 (0.26–5.13) 0.855
Divorced/Separated/Widowed 0.85 (0.19–3.88) 0.833
Residence (Ref: Rural)
Urban 0.72 (0.51-1.00) 0.049
Co-residence (Ref: No)
Yes 0.91 (0.61–1.36) 0.646
Regular Fruit Intake (Ref: No)
Yes 0.81 (0.58–1.15) 0.238
Regular Vegetables Intake (Ref: No)
Yes 0.93 (0.58–1.50) 0.758
Regular Tea Consumption (Ref: No)
Yes 0.79 (0.57–1.10) 0.165
Smoker (Ref: No)
Yes 1.00 (0.67–1.47) 0.978
Alcohol Drinker (Ref: No)
Note: reference is the stable-function class.
* PWB = psychological well-being, ADL = activity of daily living, IADL = instrumental activity of daily
living.
Page 14/25Odds Ratio (95% CI) P-value
Yes 1.22 (0.85–1.77) 0.285
Regular Exercise (Ref: No)
Yes 0.97 (0.71–1.34) 0.871
Leisure Activity (Ref: Low Frequency)
High Frequency 0.58 (0.39–0.84) 0.005
PWB Score* 1.03 (0.99–1.07) 0.169
ADL Score* 0.75 (0.61–0.91) 0.005
IADL Score* 0.99 (0.94–1.04) 0.643
Hypertension (Ref: No)
Yes 0.90 (0.60–1.35) 0.617
Diabetes (Ref: No)
Yes 1.44 (0.55–3.78) 0.463
Stroke (Ref: No)
Yes 0.78 (0.36–1.71) 0.538
Note: reference is the stable-function class.
* PWB = psychological well-being, ADL = activity of daily living, IADL = instrumental activity of daily
living.
Performance evaluation of cognitive trajectory prediction models
The performance of cognitive trajectory prediction models with the whole variables and selected
variables are shown in Table 4. Generally, all the three ML algorithms performed relatively better in the
feature selection data set compared with the full variables data set. Specifically, LR, SVM, and stacking
had equivalent performance, with a balanced accuracy around 0.66, a highest sensitivity of 0.74 in SVM,
a specificity of 0.58, a F1 score of 0.73 in both LR and SVM. For AUROC, the three algorithms achieved
0.66, 0.66, and 0.65, respectively. Also, the three models calibrated well with their brier scores ranged
0.25–0.26. The sensitivity analysis also showed similar performance for predicting “stable-function” vs
“rapid-decline” classes among participants who had complete information on MMSE for at least 3 waves
(Supplementary Table S4) as well as two-classes trajectories considering covariates among participants
who had complete information on MMSE for at least 2 waves (Supplementary Table S5).
Page 15/25Table 4
Performance of machine learning algorithms for cognitive trajectory prediction.
Full variables Selected variables with RFE#
LR SVM Stacking LR SVM Stacking
Balanced 0.63 0.62 0.63 0.66 0.66 0.65
Accuracy
Sensitivity 0.72 0.72 0.73 0.73 0.74 0.73
Specificity 0.53 0.52 0.53 0.58 0.58 0.58
F1 Score 0.68 0.68 0.68 0.73 0.73 0.72
AUROC 0.63 0.62 0.63 0.66 0.66 0.65
(0.62– (0.62– (0.62– (0.66– (0.66– (0.65–
0.63) 0.63) 0.63) 0.66) 0.67) 0.66)
Brier Score 0.29 0.29 0.29 0.26 0.26 0.25
Note: RFE = recursive feature selection, AUROC = area under the receiver operating characteristic curve.
# Psychological well-being and age were selected as the final predictors.
Discussion
In the current study, we described the cognitive trajectories of 16-year follow-up in a nationally
representative sample of community-dwelling older Chinese and explored its potential determinants. The
results indicated that a two-classes linear model of cognitive trajectories provided the best statistical fit
measures, namely, stable-function, and rapid-decline. Previous studies have examined for cognitive
trajectories and have reported varying numbers of trajectories, Brent J.Small et al. identified a two-classes
trajectories with growth mixed model over a six year period [30]. Similarly, the two-classes cognitive
trajectories (stable and decline) were also reported in the Alzheimer’s Disease Neuroimaging Initiative
(ADNI) study at 9 timepoints spanned over 6 years [11]. While 6 trajectories were identified for modeling
cognitive and psychotic symptoms among Alzheimer patients over a 13.5 years follow-up [31]. The 2-
classes model were more popular in studies such as distinguishing AD converter vs. non-converter, and
stable vs. decline [11, 32, 33]. The results revealed that stable-function class accounted for most of the
population [5, 34], indicating that majority of participants kept stable cognitive function through their
aging periods.
Compared with stable-function class, individuals with older age, female gender, Han ethnicity, having no
schooling, rural residents, low frequency leisure activities, and low baseline ADL score were at much
higher risk of having rapid cognitive decline, which were also demonstrated in previous studies [29, 35–
38]. The human aging process, a significant risk factor of cognitive impairment, has been demonstrated
to be closely associated with cognition decline. A hypothesis, derived from that hormone-replacement
therapy can protect against dementia, suggested that the changing of hormone may result in sex
Page 16/25difference in cognition decline [39]. High level education is one of important protective factors of
cognitive performance, people can get high education by implementing public policy to support high-
quality education in early life. What’s more, setting up universities for the elderly to promote education,
encouraging the elderly to strengthen exercise and social interaction also means a lot. There exist huge
differences between rural and urban. Rural residents in mainland China usually have lower income, live in
poorer housing conditions, receive less education, and enjoy lower levels of social and health
entitlements compared with the urban ones [40]. Also, for elderly, mild cognition impairment is easy to be
overlooked and it is difficult to distinguish cognitive impairment form normal cognition decline with
aging. More seriously, in rural areas, due to limited utilization of healthcare resources, the screening or
diagnosis of cognitive impairment in rural areas might be delayed and underestimated [41]. Recently,
government have made great progression to reduce the rural-urban inequality and focus on the
modification of associated factors. It suggested that absence of leisure activities can be viewed as the
base of cognition decline. One possible explanation is that the leisure activities can increase the cognitive
stimuli and promote the cognitive function. Positive correlation between leisure activities and brain
volume, white matter, as well as parietal lobe gray matter volume in older adults has been established
through a magnetic resonance imaging study [42]. On the other hand, leisure activities can promote
interpersonal social contact among elderly, which is also known to be associated with a decreased risk of
cognitive impairment [43]. An increasing amount of scientific evidence suggested that some leisure
activities, such as tai chi, can reduce perceived and physiological stress and improves cognition in
healthy older adults [44]. Besides, reading, playing mahjong or cards are common in elderly, they played
positive role in delaying cognitive decline and promote healthy aging. Previous study showed that ADL,
physical performance, and cognitive impairment prevalence gradually increased with aging [45]. ADL is
closely affected by medical care and life nursing, indicating the demand of medical care investment and
long-term care.
A few studies have focused on the prediction of cognitive-related trajectories, but mainly for diagnostic
conversion such as MCI converts into AD [9, 46]. Due to the differences in task definitions and data types,
it is not trivial to compare the performance of prediction models. For instance, Brent J. Small et al. found
that a 67% of sensitivity and 86% of specificity were obtained for GMM classification of two decline
trajectories [30]. Nikhil Bhagwat et al. used a ML framework to predict the clinical symptom trajectories
among Alzheimer patients, and achieved with 0.90 accuracy and 0.97 AUROC for two-classes trajectories
task and 0.76 accuracy for 3-classes task on ADNI datasets, as well as 0.72 accuracy and 0.88 AUROC
for two-classes task on replication in another dataset [11]. In the current study, we found that ML
algorithms had potential to predict the trajectory of cognitive function with acceptable performance,
especially for its relatively higher sensitivity (0.74), F1 score (0.73), and low brier score (0.25). However,
the performance of prediction models in current study was not particularly high, of which limited
prediction data might be an explanation, and more complicated information such as imaging data was
deserved for future study. Considering the fact that the severity of cognitive decline and limited early
screening tool, thus, our prediction models might be meaningful for the primary screening of high-risk
populations. Also, data used in our prediction models were easy to obtain with low costs and no injury
Page 17/25risk, so it was suitable for early warning in the community level or less developed areas. Certainly, the
current prediction task was an attempt for the risk identification of cognitive trajectories served as the
preliminary task before clinical diagnosis and treatment, and also help facilitate the widespread use of
machine learning algorithms for health risk prediction.
In the current study, age and psychological well-being (PWB) were identified as the important predictors.
Previous studies have found that age was the independent risk factor of cognition impairment and PWB
is verified as significant predictors to mild cognitive impairment, and PWB should not be overlooked in
intervention trials [47, 48]. Thus, family caregivers and medical staff should pay more attention to the
potential changes in the cognitive state of older adults as well as their psychological well-being.
Engaging in volunteering, provision of informal care, looking after grandchildren, paid employment may
help to promote psychological well-being in some extent, besides some policy strategies, such as
facilitating welfare benefits, improving the service capacity and level of public hospitals, satisfying the
need for some health-care services should also be considered.
There may be some potential advantages in the current study. Firstly, the cognitive trajectory classes were
examined by GMM model using a 16-year longitudinal data, which was helpful for uncovering the
heterogeneity of long-term changing patterns of cognitive function among older adults. Besides, ML
algorithms incorporated easily accessible epidemiological information would be target for early screening
of high-risk populations, and promote healthy cognitive development.
Limitations
However, the shortcomings of present study should be noted. Firstly, the sample size was relatively small
and types of predictors were limited, while machine learning was superior in prediction tasks with large
amount of data and multi-source information, especially for the current mainstream brain imaging tests.
This might be an important reason for the limited performance in the current prediction task. However,
brain imaging tests were relatively expensive, which was also an obstacle for widely use in early risk
identification. So, simple tools with high performance based on easy-accessible information need to be
designed in future studies. Secondly, data in 2002 was used to predict the 16-year span trajectories, and
all predictors were assumed to be unchangeable, but in fact, some variables might change over time.
Therefore, the power of predictors would be weakened due to a long-term follow-up. For a further
analysis, more advanced machine learning methods, such as long short-term memory (LSTM) model with
the ability for analyzing time series data [49], could be used for prediction of cognitive trajectories. Finally,
the MMSE was used for cognitive measurement in current study. The advantage of the MMSE is that it is
a well-known instrument and provides an easy-to-interpret score reflecting global cognition. However, a
main disadvantage of the scale is its limited sensitivity to change over time and the presence of ceiling
effects, especially in cognitively unimpaired populations. While for the current study, we just focused on
the changing patterns of MMSE score rather than distinguishing among MCI vs. AD, so this may not be a
main challenge in study. Perhaps more sensitive measure such as delayed recall or a functional measure
would be much valuable for identifying trajectories, and it may deserve more attention in future studies.
Page 18/25Conclusions
This study identified two trajectories of cognitive function among older adults in China using a
community-based, nationally representative sample. Older age, female gender, Han ethnicity, having no
schooling, rural residents, low frequency leisure activities, and low baseline ADL score were associated
with the rapid decline in cognitive function. Also, machine learning algorithms showed potential for
classifying different trajectories, serving as a tool for early risk identification. In conclusion,
understanding the heterogeneity of cognitive function and its determinants would be helpful for
promotion of cognitive function among older adults.
Abbreviations
MMSE: Mini-mental State Examination; ML: machine learning; LR: logistic regression; SVM: support
vector machine; AUROC: area under the receiver operating characteristic curve; RFE: recursive feature
elimination; LGCM: latent growth curve model; LCGM: latent class growth model; GMM: growth mixed
model; PWB: psychological well-being; ADL: activity of daily living; IADL: instrumental activity of daily
living.
Declarations
Ethical Approval and Consent to participate
The CLHLS study was approved by the Research Ethics Committee of Peking University (IRB00001052-
13074), and written informed consent was provided by all participants or their proxy respondents.
Consent for publication
Not applicable.
Availability of data and materials
The dataset supporting the conclusions of this article is publicly available at the Peking University Open
Research Data (https://opendata.pku.edu.cn/dataverse/CHADS).
Competing interests
None.
Funding
This study was supported by the National Natural Science Foundation of China (No. 81973144).
Authors’ contributions
Page 19/25Y.W., M.J., C.X., S.L., Z.J. and Y.F. worked together on this article. Specifically, Y.W. conceived and designed
the study. Y.W., Z.J. and C.X. contributed to the data analysis. Y.W., M.J., and C.X. drafted the manuscript.
S.L. revised the article. Y.F. supervised and revised the article. All authors have read and approved the final
manuscript.
Acknowledgements
We thank the staff and the participants of the CLHLS study.
References
1. Zhao L. 2020 Alzheimer's disease facts and figures. Alzheimers Dement 2020, 16(3):391-460.
2. Lane CA, Hardy J, Schott JM. Alzheimer's disease. Eur J Neurol 2018, 25(1):59-70.
3. Min JW. A longitudinal study of cognitive trajectories and its factors for Koreans aged 60 and over: A
latent growth mixture model. Int J Geriatr Psych 2018, 33(5):755-762.
4. Taniguchi Y, Kitamura A, Murayama H, Amano H, Shinozaki T, Yokota I et al. Mini-Mental State
Examination score trajectories and incident disabling dementia among community-dwelling older
Japanese adults. Geriatr Gerontol Int 2017, 17(11):1928-1935.
5. Tu LH, Lv XZ, Yuan CZ, Zhang M, Fan ZL, Xu XL et al. Trajectories of cognitive function and their
determinants in older people: 12 years of follow-up in the Chinese Longitudinal Healthy Longevity
Survey. Int Psychogeriatr 2020, 32(6):765-775.
6. Olaya B, Bobak M, Haro JM, Demakakos P. Trajectories of Verbal Episodic Memory in Middle-Aged
and Older Adults: Evidence from the English Longitudinal Study of Ageing. J Am Geriatr Soc 2017,
65(6):1274-1281.
7. Licher S, Leening MJG, Yilmaz P, Wolters FJ, Heeringa J, Bindels PJE et al. Development and
Validation of a Dementia Risk Prediction Model in the General Population: An Analysis of Three
Longitudinal Studies. Am J Psychiat 2019, 176(7):543-551.
8. Prestia A, Caroli A, Wade SK, van der Flier WM, Ossenkoppele R, Van Berckel B et al. Prediction of AD
dementia by biomarkers following the NIA-AA and IWG diagnostic criteria in MCI patients from three
European memory clinics. Alzheimers Dement 2015, 11(10):1191-1201.
9. Davatzikos C, Bhatt P, Shaw LM, Batmanghelich KN, Trojanowski JQ. Prediction of MCI to AD
conversion, via MRI, CSF biomarkers, and pattern classification. Neurobiol Aging 2011, 32(12).
10. Ahn HJ, Chin J, Park A, Lee BH, Suh MK, Seo SW et al. Seoul Neuropsychological Screening Battery-
Dementia Version (SNSB-D): A Useful Tool for Assessing and Monitoring Cognitive Impairments in
Dementia Patients. J Korean Med Sci 2010, 25(7):1071-1076.
11. Bhagwat N, Viviano JD, Voineskos AN, Chakravarty MM, Neuroimaging AsD. Modeling and prediction
of clinical symptom trajectories in Alzheimer's disease using longitudinal data. Plos Comput
Biol 2018, 14(9).
Page 20/2512. Lee JS, Cho SK, Kim HJ, Kim YJ, Park KC, Lockhart SN et al. Prediction Models of Cognitive
Trajectories in Patients with Nonamnestic Mild Cognitive Impairment. Sci Rep-Uk 2018, 8.
13. Nevin L, Editors PM. Advancing the beneficial use of machine learning in health care and medicine:
Toward a community understanding. Plos Med 2018, 15(11).
14. Zhang R, Simon G, Yu F. Advancing Alzheimer's research: A review of big data promises. Int J Med
Inform 2017, 106:48-56.
15. Tanveer M, Richhariya B, Khan RU, Rashid AH, Khanna P, Prasad M et al. Machine Learning
Techniques for the Diagnosis of Alzheimer's Disease: A Review. Acm T Multim Comput 2020, 16(1).
16. Lv YB, Gao X, Yin ZX, Chen HS, Luo JS, Brasher MS et al. Revisiting the association of blood pressure
with mortality in oldest old people in China: community based, longitudinal prospective study. Bmj-
Brit Med J 2018, 361.
17. Zeng Y, Feng QS, Hesketh T, Christensen K, Vaupel JW. Survival, disabilities in activities of daily
living, and physical and cognitive functioning among the oldest-old in China: a cohort study.
Lancet 2017, 389(10079):1619-1629.
18. Yi Z. Reliability of Age Reporting Among the Chinese Oldest-Old in the CLHLS Datasets: Springer
Netherlands; 2008.
19. An RP, Liu GG. Cognitive impairment and mortality among the oldest-old Chinese. Int J Geriatr
Psych 2016, 31(12):1345-1353.
20. Zhang W, Liu G. Childlessness, Psychological Well-being, and Life Satisfaction Among the Elderly in
China. Journal of cross-cultural gerontology 2007, 22(2).
21. Wu Z, Schimmele CM. Psychological disposition and self-reported health among the 'oldest-old' in
China. Ageing Soc 2006, 26:135-151.
22. Han WJ, Shibusawa T. Trajectory of physical health, cognitive status, and psychological well-being
among Chinese elderly. Arch Gerontol Geriat 2015, 60(1):168-177.
23. Xiao J, Shi Z, Fang Y. Association Between Disability Trajectory and Health Care Service Utilization
Among Older Adults in China. Journal of the American Medical Directors Association 2021.
24. Wu XY, Yuan XL, Wang W, Liu K, Qin Y, Sun XL et al. Value of a Machine Learning Approach for
Predicting Clinical Outcomes in Young Patients With Hypertension. Hypertension 2020, 75(5):1271-
1278.
25. Qiu PY, Zeng M, Kuang WH, Meng SS, Cai Y, Wang HL et al. Heterogeneity in the dynamic change of
cognitive function among older Chinese people: A growth mixture model. Int J Geriatr Psych 2020,
35(10):1123-1133.
26. Liu SW, Rovine MJ, Molenaar PCM. Selecting a Linear Mixed Model for Longitudinal Data: Repeated
Measures Analysis of Variance, Covariance Pattern Model, and Growth Curve Approaches. Psychol
Methods 2012, 17(1):15-30.
27. Wolpert DH. Stacked Generalization. Neural Networks 1992, 5(2):241-259.
Page 21/2528. Chawla NV, Bowyer KW, Hall LO, Kegelmeyer WP. SMOTE: Synthetic minority over-sampling
technique. J Artif Intell Res 2002, 16:321-357.
29. Wu Z, Phyo AZZ, Al-Harbi T, Woods RL, Ryan J. Distinct Cognitive Trajectories in Late Life and
Associated Predictors and Outcomes: A Systematic Review. J Alzheimers Dis Rep 2020, 4(1):459-
478.
30. Small BJ, Backman L. Longitudinal trajectories of cognitive change in preclinical Alzheimer's
disease: A growth mixture modeling analysis. Cortex 2007, 43(7):826-834.
31. Wilkosz PA, Seltman HJ, Devlin B, Weamer EA, Lopez OL, DeKosky ST et al. Trajectories of cognitive
decline in Alzheimer's disease. Int Psychogeriatr 2010, 22(2):281-290.
32. Huang MY, Yang W, Feng QJ, Chen WF, Neuroimaging AsD. Longitudinal measurement and
hierarchical classification framework for the prediction of Alzheimer's disease. Sci Rep-Uk 2017, 7.
33. Moradi E, Pepe A, Gaser C, Huttunen H, Tohka J, Initi AsDN. Machine learning framework for early
MRI-based Alzheimer's conversion prediction in MCI subjects. Neuroimage 2015, 104:398-412.
34. Hayden KM, Reed BR, Manly JJ, Tommet D, Pietrzak RH, Chelune GJ et al. Cognitive decline in the
elderly: an analysis of population heterogeneity. Age Ageing 2011, 40(6):684-689.
35. Legdeur N, Heymans MW, Comijs HC, Huisman M, Maier AB, Visser PJ. Age dependency of risk
factors for cognitive decline. Bmc Geriatr 2018, 18.
36. Yates LA, Ziser S, Spector A, Orrell M. Cognitive leisure activities and future risk of cognitive
impairment and dementia: systematic review and meta-analysis. Int Psychogeriatr 2016,
28(11):1791-1806.
37. Zhu XY, Qiu CX, Zeng Y, Li J. Leisure activities, education, and cognitive impairment in Chinese older
adults: a population-based longitudinal study. Int Psychogeriatr 2017, 29(5):727-739.
38. Downer B, Chen NW, Raji M, Markides KS. A longitudinal study of cognitive trajectories in Mexican
Americans age 75 and older. Int J Geriatr Psych 2017, 32(10):1122-1130.
39. LeBlanc ES, Janowsky J, Chan BKS, Nelson HD. Hormone replacement therapy and cognition -
Systematic review and meta-analysis. Jama-J Am Med Assoc 2001, 285(11):1489-1499.
40. Lu Y, Liu C, Yu D, Fawkes S, Ma J, Zhang M et al. Prevalence of mild cognitive impairment in
community-dwelling Chinese populations aged over 55 years: a meta-analysis and systematic
review. Bmc Geriatr 2021, 21(1):10.
41. Liu CC, Liu CH, Sun Y, Lee HJ, Tang LY, Chiu MJ. Rural-urban disparities in the prevalence of mild
cognitive impairment and dementia in Taiwan: A door-to-door nationwide study. J Epidemiol 2021.
42. Benedict C, Brooks SJ, Kullberg J, Nordenskjold R, Burgos J, Le Greves M et al. Association between
physical activity and brain health in older adults. Neurobiol Aging 2013, 34(1):83-90.
43. Marioni RE, Proust-Lima C, Amieva H, Brayne C, Matthews FE, Dartigues JF et al. Social activity,
cognitive decline and dementia risk: a 20-year prospective cohort study. Bmc Public Health 2015, 15.
44. Wu MT, Tang PF, Goh JOS, Chou TL, Chang YK, Hsu YC et al. Task-Switching Performance
Improvements After Tai Chi Chuan Training Are Associated With Greater Prefrontal Activation in
Page 22/25Older Adults. Front Aging Neurosci 2018, 10.
45. Zhang PD, Lv YB, Li ZH, Yin ZX, Li FR, Wang JN et al. Age, Period, and Cohort Effects on Activities of
Daily Living, Physical Performance, and Cognitive Functioning Impairment Among the Oldest-Old in
China. J Gerontol a-Biol 2020, 75(6):1214-1221.
46. Ye JP, Farnum M, Yang E, Verbeeck R, Lobanov V, Raghavan N et al. Sparse learning and stability
selection for predicting MCI to AD conversion using baseline ADNI data. Bmc Neurol 2012, 12.
47. Chen LL. Leisure activities and psychological wellbeing reduce the risk of cognitive impairment
among older adults with hearing difficulty: A longitudinal study in China. Maturitas 2021, 148:7-13.
48. Gates N, Valenzuela M, Sachdev PS, Singh MAF. Psychological well-being in individuals with mild
cognitive impairment. Clin Interv Aging 2014, 9:779-792.
49. Hong X, Lin RJ, Yang CH, Zeng NY, Cai CT, Gou J et al. Predicting Alzheimer's Disease Using LSTM.
Ieee Access 2019, 7:80893-80901.
Figures
Page 23/25Figure 1
Flow chart of CLHLS survey and sample selection in current analysis.
Page 24/25Figure 2
Heterogeneous trajectories of cognitive function. MMSE scores were measured by the Chinese version
Mini-Mental State Examination. Two classes were identified: “stable-function” class, and “rapid-decline”
class. Each trajectory was the mean change pattern of MMSE over time.
Supplementary Files
This is a list of supplementary files associated with this preprint. Click to download.
SupplementaryInformation.docx
Page 25/25You can also read