SARS-COV-2 HUMORAL AND CELLULAR IMMUNE RESPONSES IN COVID-19 CONVALESCENT INDIVIDUALS WITH HIV
←
→
Page content transcription
If your browser does not render page correctly, please read the page content below
SARS-CoV-2 Humoral and Cellular Immune
Responses in COVID-19 Convalescent Individuals
With HIV
Denise Giannone
Universidad de Buenos Aires Facultad de Medicina
Maria Belén Vecchione
Universidad de Buenos Aires Facultad de Medicina
Alejandro Czernikier
Universidad de Buenos Aires Facultad de Medicina
Maria Laura Polo
Universidad de Buenos Aires Facultad de Medicina
Virginia Gonzalez Polo
Universidad de Buenos Aires Facultad de Agronomia
Leonel Cruces
Universidad de Buenos Aires Facultad de Medicina
Yanina Ghiglione
Universidad de Buenos Aires Facultad de Medicina
Silvia Balinotti
Sanatorio Güemes: Sanatorio Guemes
Yesica Longueira
Universidad de Buenos Aires Facultad de Medicina
Gabriela Turk
Universidad de Buenos Aires Facultad de Medicina
Natalia Laufer
Universidad de Buenos Aires Facultad de Medicina
Maria Florencia Quiroga ( fquiroga@fmed.uba.ar )
Universidad de Buenos Aires https://orcid.org/0000-0002-0956-5492
Research Article
Keywords: HIV/SARS-CoV-2 coinfection, COVID-19, SARS-CoV-2, HIV, humoral immunity, cellular
responses, antibody responses
Posted Date: January 11th, 2022
Page 1/25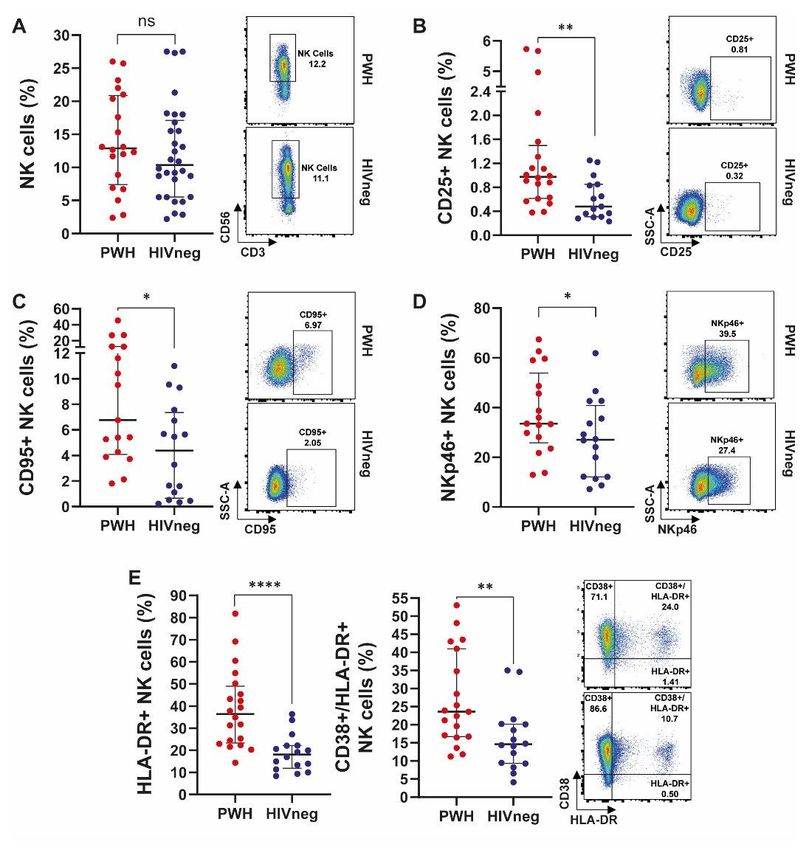
DOI: https://doi.org/10.21203/rs.3.rs-1229520/v1
License: This work is licensed under a Creative Commons Attribution 4.0 International License.
Read Full License
Page 2/25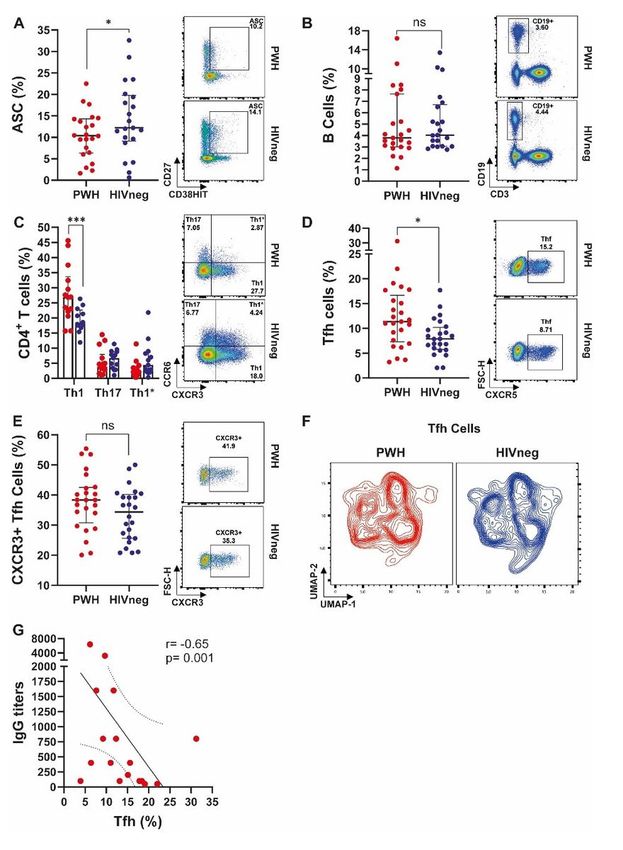
Abstract
Background
SARS-CoV-2-specific immune response features in people with HIV infection (PWH) remain to be fully
elucidated. We aimed to evaluate the impact of HIV over humoral and cellular responses in COVID-19
convalescent PWH.

Methods
Blood samples from 29 PWH with preserved CD4+T-cell counts on ART and 29 HIV-negative (HIVneg)
donors were included. SARS-CoV-2-specific IgG levels and IgG titers were determined by ELISA. Antibody
neutralization capacity was evaluated against the reference B1 strain SARS-CoV-2. IFN-γ-secreting cells
were detected by ELISpot using SARS-CoV-2 Spike, RBD, or Nucleocapsid protein or overlapping peptide
pools. Frequency and phenotype of T, B and NK cells and levels of soluble cytokines and chemokines
were assessed by flow cytometry.

Results
SARS-CoV-2-specific antibodies were detected on 65.5% of PWH and 79.3% of HIVneg individuals, with no
differences in serum IgG levels and anti-SARS-CoV-2 neutralizing antibodies. All donors exhibited SARS-
CoV-2-specific cellular immunity, including those with undetectable antibody responses. PWH showed
diminished percentages of antibody-secreting cells compared to HIVneg cohort, with similar B cell
proportions between groups. PWH presented an increment in T follicular helper (Tfh, CD4+CXCR5+)
percentage, which negatively correlated with IgG titers. Additionally, CD4+PD1+ and CD8+HLA-DR+ cell
frequencies were augmented in PWH. Moreover, PWH presented a high proportion of CD95+, CD25+,
NKp46+, HLA-DR+, and CD38+/HLA-DR+ NK cells. Both groups displayed similar Tregs frequency,
effector/memory, and T-helper profile for CD4TL, exhaustion and memory phenotypes for CD8TL and
subtle differences in classical monocytes. Profile of circulating cytokines and chemokines was
significantly different between both groups. Magnitude of IFN-γ responses to S or N proteins, and RBD
was lower in PWH compared to HIVneg donors. Correlation analysis of immune and clinical parameters
showed a distinct immune landscape in the PWH group.

Conclusions
PWH showed a distinctive immune profile although severity of COVID-19 was not exacerbated. PWH with
conserved CD4+T-cell counts exerted both humoral and cellular responses against SARS-CoV-2. Even
though cellular response was lower compared to HIVneg individuals, PWH achieved similar antibody

                                                Page 3/25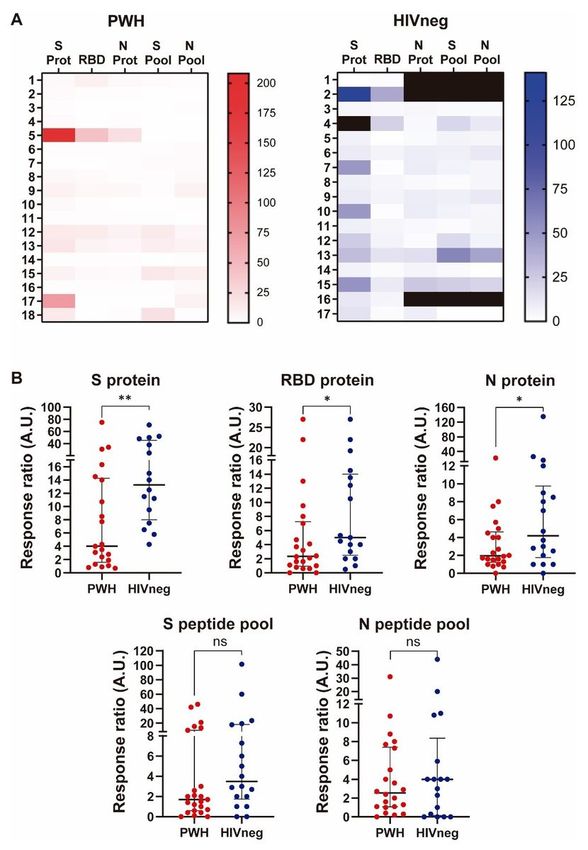
responses with a high neutralization capacity. These data reinforce the impact of ART, not only in
controlling HIV but also other infections.

Introduction
The outbreak of severe acute respiratory syndrome coronavirus 2 (SARS-CoV-2), etiologic agent of
coronavirus disease 2019 (COVID-19), has raised concerns around the world (1). In Argentina, the first
cases were recorded at the beginning of March 2020 (2). The predisposing factors for severe COVID-19
are aging, diabetes, cardiac disease, and obesity among others, which condition the host’s immune
response to the virus (3). Although human immunodeficiency virus (HIV) infection induces immune
suppression mainly because of CD4+ T cell depletion, this chronic viral infection does not appear to be a
risk factor for severe COVID-19 (4–6). Nevertheless, data regarding the impact of HIV on the susceptibility
and severity of infection with SARS-CoV-2 are insufficient in the literature. It is known that, in immune-
competent persons, effective response against SARS-CoV-2 involves the development of a functional
antibody response and cellular immunity, which drives antibody production and cytotoxic effectors to
viral eradication (7).

Studies on humoral immune responses against SARS-CoV-2 in HIV-immunosuppressed individuals are
scarce and controversial. On one hand, it has been described that antibodies against SARS-CoV-2 are
detected in people with HIV (PWH) with previous history of COVID-19, although with lower conversion
rates when compared to HIV-naïve persons (8, 9). On the other hand, it was shown that similar antibody
responses can be achieved by PWH on ART with complete HIV suppression compared to HIV-uninfected
individuals (10). In addition, memory cellular immunity could be assessed after SARS-CoV-2 infection in
some cohorts of PWH (9). A deeper understanding about this issue is fundamental to applying an
optimal vaccination strategy to this population. Yet, an integrative analysis of the level and quality of
antibody or T-cell response capacity against SARS-CoV-2 has not been tackled previously.

We aimed to study the immune landscape that occurs after COVID-19 in PWH. Therefore, antibody
testing, phenotypic analysis of peripheral blood leukocytes, plasma cytokines assessment, and
determination of memory responses against SARS-CoV-2 were performed in a cohort of PWH. Afterwards,
we compared these observations with those seen in a cohort of HIV-negative (HIVneg) individuals
convalescent from COVID-19. Our findings provide insights for understanding long-term SARS-CoV-2-
specific T cell and humoral immunity in the context of HIV infection.

Methods
Individuals enrolled. This is a cross-sectional study. Between April and December 2020 peripheral blood
samples from donors to the Argentinean Biobank of Infectious Diseases (BBEI) with confirmed COVID-19
diagnosis were collected at the convalescent stage: 29 PWH with preserved CD4+T-cell counts on ART
and 29 HIV-negative individuals (HIVneg) were included. Written informed consents were obtained from

                                                  Page 4/25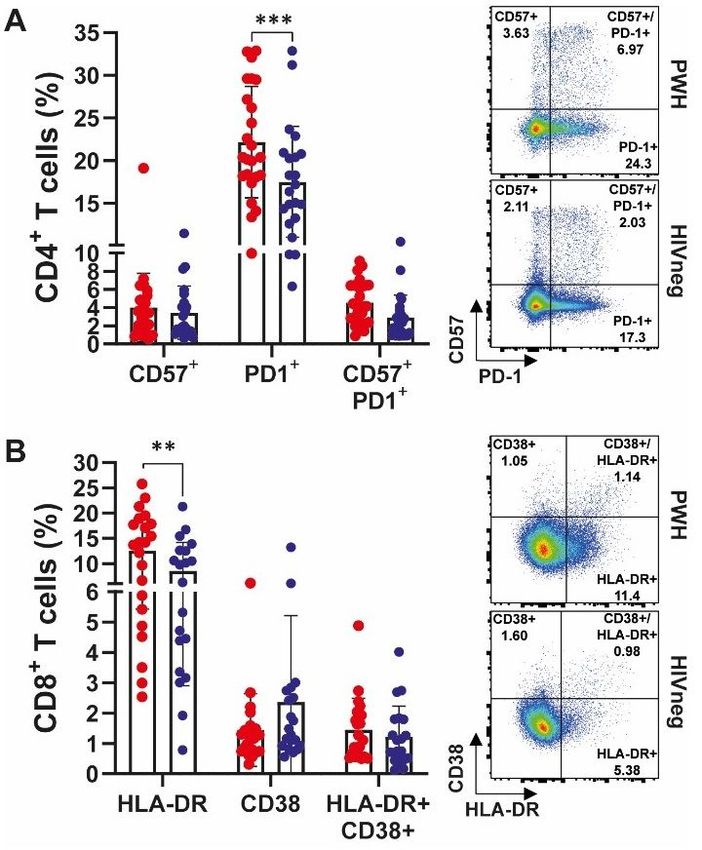
all participants. Research was conducted according to protocols approved by the institutional review
board of Fundación Huésped, Argentina.

Sample processing: Blood samples were processed within 4 hours from withdrawal. Serum and plasma
were aliquoted and stored at -80°C. Peripheral blood mononuclear cells (PBMCs) were isolated by Ficoll-
Hypaque density gradient centrifugation (GE Healthcare, Sweden). Cells were preserved in a solution of
fetal bovine serum (FBS, Sigma-Aldrich, USA) supplemented with 10% DMSO (Sigma-Aldrich) and stored
in liquid nitrogen until thawed the day of analysis.

Antibody assessment: SARS-CoV-2-specific IgG antibodies were evaluated in plasma samples from all
donors by ELISA (COVIDAR kit, Laboratorio Lemos S.R.L., Argentina). Normalized optical density (NOD)
values were calculated by subtracting the cut-off value to each donor sample OD value, and the resulting
value was divided by the mean positive control OD value. Additionally, SARS-CoV-2-specific IgG was
titrated by making 2-fold serial dilutions of plasma.

Virus neutralization: Vero-E6 cells were maintained in DMEM medium (Sigma-Aldrich) plus 2 mM L-
glutamine (Sigma-Aldrich), 100 U/ml penicillin (Sigma-Aldrich), 100 µg/ml streptomycin (Sigma-Aldrich)
and 10% FBS (Gibco BRL, USA). SARS-CoV-2 strain (lineage B.1, hCoV-19/Argentina/PAIS-G0001/2020,
GISAID Accession ID: EPI_ISL_499083) was kindly provided by Dr. Sandra Gallego (InViV working group).
Serial 2-fold dilutions of decomplemented plasma were incubated with 200 plaque-forming units (PFU) of
SARS-CoV-2 for 1 h at room temperature, in triplicates. Then, mixtures were added to 80% confluent Vero-
E6 cell monolayers in 96-well plates and incubated at 37°C for 1 h. Afterward, cells were washed and
culture medium with 2% FBS was added. After 72 h, plates were fixed with 4% paraformaldehyde for 20
min at room temperature and stained using a 0.5% crystal violet dye solution in acetone and methanol.
Neutralization titer was calculated as the inverse of the highest plasma dilution that showed an 80%
cytopathic inhibitory effect.

Flow cytometry and CBA analysis. Recently thawed PBMCs were stained with the following fluorochrome-
conjugated antibodies (Abs) for ex vivo study: CD3, CD4, CD8, CD25, CD127, CD196 (CCR6), CD185
(CXCR5), CD183 (CXCR3), CD57, PD1, CD27, CD45RA, CD62L, CD19, ICOS, HLA-DR, CD38, CD14, CD16,
CD56, CD69, CD95, NKP46, NKP30 and NKG2D (all from BD Biosciences). Dead cells were excluded using
the BD Horizon™ Fixable Viability Stain 510 from BD Biosciences. Negative control samples were
incubated with irrelevant isotype-matched mAbs in parallel with experimental samples. Sample
acquisition and analysis were carried out on a BD FACSAria™ Fusion Flow Cytometer using the BD
FACSDiva software (BD Biosciences). Data were analyzed with FlowJo Software (Version 10, BD
Biosciences). Anomalies in flow cytometry data were eliminated using FlowAI (FlowJo Software, BD
Biosciences). Gating strategy is shown in Supplementary Figure 1A, B and C. Uniform Manifold
Approximation and Projection (UMAP) (nonlinear, dimension reduction) analysis was performed (n = 26,
13 individuals in PWH and 13 individuals in HIVneg group) using FlowJo plugins. Additionally, several
cytokine and chemokine concentrations from plasma samples were determined using the Th1/Th2/Th17

                                                  Page 5/25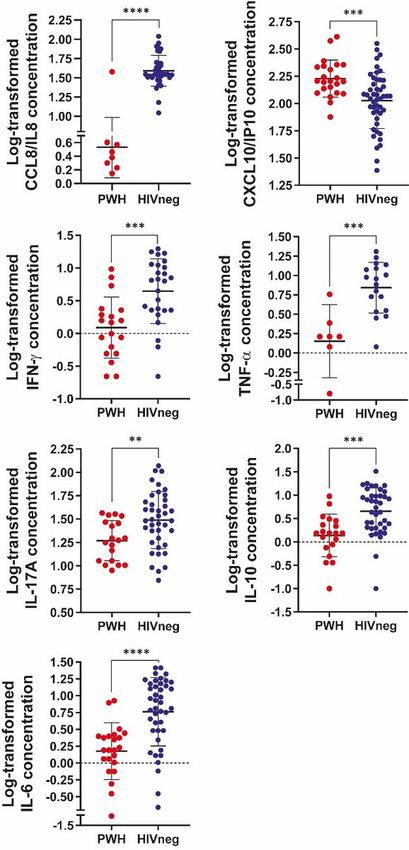
and Chemokine CBA kits (BD Biosciences) following the manufacturer’s instructions and analyzed using
the FCAP ArrayTM software Version 3.0 (BD Biosciences).

SARS-CoV-2 specific cellular responses. IFN-γ-secreting cells were detected using enzyme-linked
immunospot (ELISpot) assays conducted as described previously (11). Briefly, PBMC were plated on
sterile 96-well plates (MultiScreen IP plates; Millipore), coated with mouse anti-human IFN-γ monoclonal
antibody (BD Biosciences) at 2x10⁵ cells/well. SARS-CoV-2 Spike, RBD, Nucleocapside proteins (kindly
provided by Dr. A. Gamarnik, Leloir Institute, Buenos Aires, Argentina), Spike or Nucelocapside peptide
pools (BEI Resources, NIAID, NIH. NR-52402, and NR-52404) were titrated beforehand and added in
duplicate wells (final concentration 10µg/ml for proteins and 2µg/ml for peptide pools). Negative
(medium plus 0.05% DMSO) and positive (PHA 10µg/ml Sigma-Aldrich) controls were included for each
donor. Plates were developed using biotinylated anti-human IFN-γ monoclonal antibody, streptavidin-
peroxidase complex, and AEC (3-amino-9-ethylcarbazole) substrate reagent set (BD Biosciences). Plates
were scanned on an ImmunoSpot reader and specific spots were counted using the ImmunoSpot
software (Cellular Technology Ltd.). Results were expressed as the ratio of Ag-specific spot-forming units
(SFU)/106 PBMC to the negative-control values. Cut-off value was set at 25 SFU/106. In samples where
negative control had a value of zero, a value of 12.5 SFU/106 was assigned for calculations. Additionally,
when the negative control value was above 25 SFU/106, the cut-off was calculated as the media + 1 SD
of negative replicate results.

Data analysis: Clinical, demographic and laboratory data associated with each donor was kept at the
Noraybanks software database (Noraybio, Spain). Statistical analyses were performed using GraphPad
Prism 8.4.3 (GraphPad Software). All tests were considered statistically significant when the p values
were
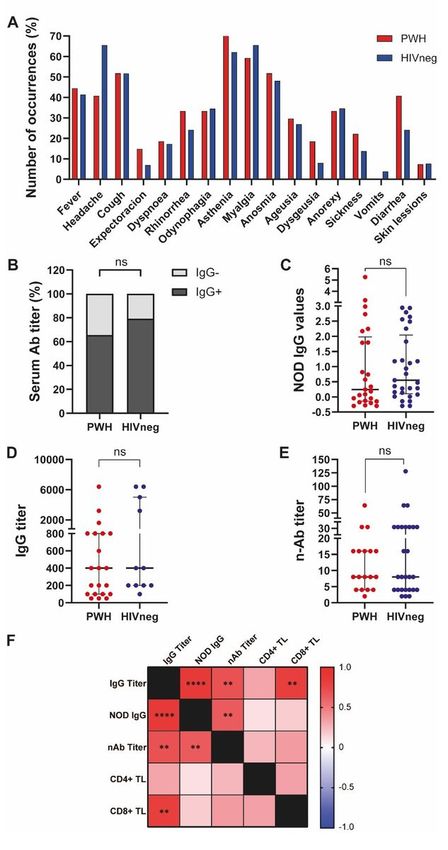
HIVneg donors (1 case of AHT+ hypothyroidism, 1 case of AHT + asthma, 1 case of AHT + pituitary
adenoma, 1 case of thrombocytopenic purpura and 1 case of obesity). In addition, both groups displayed
similar symptom patterns with no statistical differences (Chi square test with Yates correction,
significance level: 0.05; not significant for any symptom analyzed, Figure 1A). We could observe that
65.5% of PWH and 79.3% of HIVneg individuals showed detectable SARS-CoV-2-specific antibodies
(Figure 1B), with similar amounts of total IgG, IgG titers and anti-SARS-CoV-2 neutralizing antibodies
between groups (Figure 1C, D and E). Finally, a thorough analysis was performed among PWH, revealing
that neutralization capacity correlated with IgG titers (r:0.70, p
Continuing our analysis, similar proportions of NK cells were observed in both groups as determined by
the expression of CD56 (Figure 4A). Augmented proportions of CD25, CD95, NKP46, HLA-DR and HLA-
DR/CD38 co-expressing cells among the PWH group were detected, therefore indicating an enhanced
activation/exhaustion of peripheral NK cells in these individuals (Figure 4B to E, respectively). Finally,
increased percentages of CD14++CD16- classical peripheral monocytes in the PWH group were observed
compared to HIVneg individuals, whereas there weren’t any differences regarding the proportion of total
CD14+, CD14+CD16bright non-classical or intermediate CD14++CD16dim monocytes between groups
(Supplementary Figure 4), therefore showing minor differences on monocyte’s distribution or abundance
(14).

Plasma cytokines / chemokines are differentially modulated in convalescent COVID-19 PWH

Continuing our task on characterizing the immune profile during the COVID-19 convalescence phase,
plasma concentrations of several cytokines and chemokines were determined by flow cytometry using a
multiplex assay. A marked decrease of IL-8/CCL8 and increased levels of IP-10/CXCL10 were observed in
PWH individuals compared to HIV-negative COVID-19 convalescents (Figure 5), whereas any differences
were found on MCP-1/CCL2, MIG/CXCL9 or RANTES/CCL5 plasma concentrations between groups (data
not shown). Moreover, statistically diminished levels of IFN-γ, TNF-α, IL-17A, IL-6 and IL-10 plasma
concentrations were noticed in PWH compared to HIVneg COVID-19 convalescent individuals, as shown
in Figure 5. Notably, IL-8/CCL8 couldn’t be detected in 65.2% of the PWH tested, whereas in the HIV
negative group was undetectable in 22.9% of individuals (p = 0,0005, Chi square test with Yates
correction).

Cellular immune responses against SARS-CoV-2 are diminished in PWH

Advancing on our studies, we aimed to determine T cell responses against SARS-CoV-2 antigens and
peptide pools, as it was described elsewhere (9, 15). Hence, PBMCs from each donor were stimulated in
the presence of proteins or peptide pools encompassing both Spike and Nucleocapside proteins and
afterwards the IFN-γ-producing cells were determined by ELISpot. Our data demonstrated an overall
diminished response against SARS-CoV-2 antigens, specifically against Spike, RBD and Nucleocapside
whole proteins in the PWH group, with no differences in T cell responses against Spike or Nucleocapside
peptide pools (Figure 6A and B). These data show that although PWH presented lower T cell responses
against SARS-CoV-2 compared to HIV negative donors, these cells were able to collaborate to mount
robust humoral immune responses against the pathogen.

Analysis of associations of immune cell subsets, serological determinations, cytokine/chemokines
assessments and Ag-specific cellular immune responses in PWH and HIV negative participants

Finally, to examine differences in the immune landscape between PWH and HIV-negative participant
groups, associations between clinical, serological, cytokine/chemokine plasma levels, numerous immune
cell populations and SARS-CoV-2-specific cellular immune response parameters were performed by
Spearman correlation analysis. Results can be evinced in Figure 7 for statistical significances and
                                                 Page 8/25
Supplementary Figure 5 for Spearman R values. All in all, we could observe distinctive patterns of
associations when comparing both cohorts. Several correlations were statistically significant in PWH but
not in HIVneg: i) On comparing serological parameters and Tfh frequency, a positive correlation between
ASC and Tfh proportions and negative correlations between nAb titers and ASC/Tfh percentages were
found; ii) Among CD4+ T cell activation/exhaustion/memory-effector markers, positive correlations
between PD1 and PD1/CD57 with Treg proportions or between exhaustion markers and CD4+ TCM, CD4+
TTM, CD4+ TEM, and CD4+ TEMRA, Th1, Th1* and Th17 percentages were discovered, as well as negative
correlations between Treg and CD4+ TNaive or Th2 cells; iii) Numerous cytokines/chemokines levels
correlated with Ag-specific cellular immune responses, finding negative associations between CCL5
concentration and Spike protein responses, IL-6 and Spike peptide pool–specific IFN-γ producing cells, or
TNFα/ IL-10 levels and RBD or Nucleocapsid protein responses; iv) Ag-specific immune cell responses
correlated with the number of symptoms, B lymphocytes, several CD8+ TL and NK activated/exhausted
populations, and lastly, v) different cytokines/chemokines levels were associated to ASC/Tfh frequencies
(Figure 7 and Supp. Figure 5). We couldn’t observe any significant correlation between the magnitude of
the cellular immune responses against viral antigens and anti-SARS-CoV-2 IgG titers neither in PWH nor
HIVneg donors. These differences reveal the overall impact of HIV infection over the memory response
against SARS-CoV-2 after COVID-19 infection.
Discussion
We aimed to investigate the impact of HIV infection over the immune profile of lymphocyte populations in
PWH recovered from COVID-19, as well as the anti- SARS-CoV-2 humoral and cellular responses. Both
PWH and HIV negative individuals displayed similar frequency of symptoms, with asthenia, myalgia, and
anosmia being the most frequent, reflecting the prevalence of mild COVID-19 in the study groups.
Preserved CD4+ T cell counts in PWH was accompanied by mild symptoms, as it was also described by
others (16).
When studying the antibody profile assessed as NOD, IgG titer and IgG neutralization capacity, similar
levels in both PWH and HIV-negative convalescent COVID-19 individuals were observed. It indicates that
adaptive humoral immunity finds its way to an effective response against SARS-CoV-2, even in an
immune-compromised environment, as it was also demonstrated by others (10). It has been established
that Tfh cells contribute with B cells in germinal center of secondary lymphoid organs to generate
efficient neutralizing and non-neutralizing antibody responses in SARS-CoV-2 infection. As Tfh are key
determinants of humoral responses, this subset should be taken into consideration in the design of
effective vaccination regimens (17). We observed a negative correlation between SARS-CoV-2 specific-IgG
titers and the proportion of Tfh cells in the PWH group (Figure 2G). It has been deeply described that Tfh
cells are expanded and exhibit a dysfunctional state during HIV infection, and that these defects persist
even when ART treatment succeeds in controlling viral replication (18, 19). Moreover, it has been shown
that CXCR3-expressing Tfh lymphocytes (also named Th1-like skewed Tfh cells) are expanded and that
this expansion could be driven by persistent HIV antigen expression (20). We additionally observed a
Page 9/25central memory phenotype (as shown by an up-regulated CD27 expression) in Tfh cells from PWH, which
paralleled with increased CD4+ TCM lymphocytes within this group (shown in Supplementary Figure 3B).
Therefore, we hypothesize that these differences in Tfh proportions and phenotype might be a preexisting
trait, due to chronic HIV infection. Finally, although the proportion of total B lymphocytes were similar
among groups, we detected reduced ASC proportions in the PWH group. It has been described that during
COVID-19 infection, ASC were elevated in individuals with detectable SARS-CoV-2 compared to those that
have cleared the virus, being this association stronger in the HIV-negative group (21). Moreover, prior to
recovery, a case report from an HIV-negative individual with mild-to-moderate COVID-19 showed that ASC
appeared in the blood at the time of viral clearance and peaked on day 8, then finally diminished (22).
These data are in agreement with our results showing a diminished proportion of ASC in convalescent
PWH. We postulate that a smaller amount of ASC could have been taken place during acute SARS-CoV-2
infection due to the immune disturbances related to chronic HIV infection. Our observations, in addition to
previous data published by others, suggest that HIV infection would exert a negative effect on the
subsequently antibody secretion to newly recognized antigens, as those from SARS-CoV-2. Contrary to
expectations, we could not detect any differences in the antibody secretion’s magnitude and the viral
neutralizing capacity when we compared humoral immune responses from both PWH and HIV negative
individuals. It indicates that Tfh are efficient in driving humoral responses against newly recognized
pathogens, even in a chronic HIV-compromised environment.
Systemic CD4+ T cell activation is a hallmark for HIV chronic infection (23). As a whole, we observed
slight differences in activation markers within PWH when comparing with HIV-negative persons. These
similarities in CD4TL status between groups could be interpreted as a long and sustained cell activation
in our HIVneg cohort that could lead to persistent clinical symptoms triggered during the acute phase
COVID-19, as described previously (24).
Both CD8+ T cells and NK cells are key at controlling viral infections, including those carried on by SARS-
CoV-2 (25, 26). Also, both cell types are affected during HIV infection, lowering their cytotoxic and
cytokine-producing functions, therefore affecting anti-viral immunity (27, 28). We detected a marked NK
and a less evident CD8+ TL activation state in PWH with respect to convalescent COVID-19 HIVneg
individuals. These observations are in agreement with previous reports, showing an increment of
activated but not exhausted CD8+ T cells in HIV+ viremic individuals compared to healthy donors in the
COVID-19 convalescent state (29). Regarding NK cells, Antinori and coworkers have shown highly
activated NK cells with augmented NKG2A and NKG2C proportions in convalescent COVID-19 HIV+
individuals (30), therefore reinforcing the idea of increased activation/exhaustion in HIV/SARS-CoV-2
coinfected patients. Our data suggest that enhanced NK activation might offset the failure in adaptive
immunity derived from HIV infection.
It has been extensively shown that a cytokine storm takes place during acute COVID-19 infection, which is
responsible for severe disease (7). These elevated pro-inflammatory cytokines are produced by
monocytes, lymphocytes, and other cell types, as well as endothelial cells (7, 31). In most immune-
competent individuals, after SARS-CoV-2 infection is cleared, cytokines and chemokines levels return to
Page 10/25normality (31). On the contrary, HIV infection imposes a different scenario, where chronic inflammation
constitutes a distinctive trait that leads to excess risk of non-AIDS events (32). In our cohort, convalescent
COVID-19 PWH presented significant diminished levels of IL-8, IFN-γ, TNF-α, IL-17A and IL-6, therefore
suggesting a reduced pro-inflammatory capacity in both the monocyte/macrophage and the T
lymphocyte compartments, which would correlate with a milder disease severity in COVID-19/HIV
coinfection, also seen by others (31).
IL-6 and TNF-α are potent macrophage-induced cytokines with pro-inflammatory effects, partially
responsible for the cytokine storm these patients experience (31). These cytokines were significantly
diminished in PWH individuals compared to HIVneg donors, paralleling a mild to moderate COVID-19. As
expected for chronic and virologically controlled HIV infection, IP-10 (the ligand of CXCR3) levels were
higher in this group compared to HIV-negative donors (33), showing a distinctive kinetics pattern for this
chemokine, as seen previously for both HIV and COVID-19 (31, 33). Finally, the T-cell derived pro-
inflammatory cytokines IFN-γ and IL-17 and the regulatory IL-10 were diminished in plasma from COVID-
19 convalescent PWH group, therefore displaying the disturbances provoked by HIV infection in the T cell
compartment, as it was described (19, 34). IL-8, TNF-α and IL-6 constitute an inflammatory cytokine
signature of COVID-19, but also a bridge to the subsequent adaptive immune response (35). Therefore,
we hypothesize that the lower levels of these cytokines observed in the PWH cohort would result in a
weaker cellular immune response against the virus. Moreover, the observed persistence of pro-
inflammatory cytokines in the HIV negative cohort might be linked to the development of long COVID-19
symptoms, although until now there is no data available on this topic.
It is known that a Th1-skewed profile arises after SARS-CoV-2 infection, as was extensively demonstrated
(7, 31, 36, 37). Our results showed a measurable IFN-γ response after stimulation of PBMC from all PWH
tested in the presence of viral antigens. Notably, all the individuals tested responded to at least one
antigen, independently of their serological status. However, we could not detect any correlation between
the magnitude of cellular responses with any serological parameter tested. Otherwise, PWH presented
lower levels of cellular response against viral proteins when compared to HIVneg, therefore showing
some degree of anomalous response. These observations point out the imbalance elicited by HIV
infection, also demonstrated by lower levels of plasma cytokines in convalescent PWH. Additional work
will be required to assess potential T cell cross-reactivity against other human coronaviruses, as was
reported in other studies (36–39).
One limitation of this study is that we did not perform an in-depth analysis of B cell-antigen specific
responses. Further research, such as the analysis of fluorochrome-coupled Spike-specific B cells’
frequency and phenotype, could add insights into the SARS-CoV-2 specific memory immune response.
Another limitation we can evince is that the data presented along this work was derived from
cryopreserved samples, which may underestimate the magnitude of the assessed T cell responses (40).
Finally, the lack of a control group of PWH ART-naïve didn't allow us to fully elucidate the role of low CD4+
T cell counts over the immune response and clinical outcome of SARS CoV-2 infection.
Page 11/25Conclusions
HIV infection without treatment has been proposed as serious comorbidity of COVID-19, but with proper
ART overall immunity against SARS-CoV-2 is not affected in these individuals (16). Since COVID-19
infection outcomes were similar in PWH compared with HIV negative participants, the differences in
cellular immune responses and cell phenotypes between both groups may suggest an alternative
immunity to SARS-CoV-2 in PWH instead of a dysregulated one. Our data support the landscape of
increased activation/exhaustion, reduced cellular responses and plasma cytokines concurrent with
effective antibodies responses against SARS CoV-2, reinforcing the idea of a significant impact of ART
not only in HIV control but in the capacity of restrict other infections.
Declarations
Ethics approval and consent to participate
The study was carried out in line with the World Medical Association Declaration of Helsinki and
approved by the Ethics Committee of Fundación Huésped, Buenos Aires, Argentina. Written informed
consent was provided by all the participants.
Consent for publication
Not applicable.
Availability of data and materials
All data generated or analyzed during this study are included in this published article and its
supplementary information files.
Competing interests
The authors declare that they have no competing interests.
Funding
This work was supported by the Agencia Nacional de Promoción de la Investigación, el Desarrollo
Tecnológico y la Innovación (Agencia I+D+i) from Argentina through an extraordinary funding opportunity
to improve the national response to COVID-19 (Proyecto COVID N° 11, IP 285).
Authors' contributions
NL and MFQ conceived and designed experiments; DG, MBV, NL and MFQ analyzed and interpreted the
data and wrote the manuscript. DG, MBV, AC, MLP and LC processed samples and performed
experiments. SB, BWG, NL and YL recruited donors, collected samples and obtained clinical data. YL
performed serological studies. VGP performed and analyzed flow cytometry data. GT, NL and YG
Page 12/25contributed reagents/materials and analyzed and interpreted the data. All authors contributed to the
refinement of the report and approved the final manuscript.
Acknowledgements
The authors would like to thank the BBEI donor subjects for their participation, Dr. Andrea Gamarnik, Dr.
Maria M. Gonzalez Lopez Ledesma and Dr. Sandra Gallego for providing materials and Dr. Horacio
Salomon for continuous support.
References
1. Huang C, Wang Y, Li X, Ren L, Zhao J, Hu Y, et al. Clinical features of patients infected with 2019
novel coronavirus in Wuhan, China. Lancet. 2020;395(10223):497-506.
2. Longueira Y, Polo ML, InVi Vwg, Biobanco de Enfermedades Infecciosas Coleccion Cwg, Turk G,
Laufer N. Dynamics of SARS-CoV-2-specific antibodies among COVID19 biobank donors in
Argentina. Heliyon. 2021;7(10):e08140.
3. Apicella M, Campopiano MC, Mantuano M, Mazoni L, Coppelli A, Del Prato S. COVID-19 in people
with diabetes: understanding the reasons for worse outcomes. Lancet Diabetes Endocrinol.
2020;8(9):782-92.
4. SeyedAlinaghi S, Karimi A, MohsseniPour M, Barzegary A, Mirghaderi SP, Fakhfouri A, et al. The
clinical outcomes of COVID-19 in HIV-positive patients: A systematic review of current evidence.
Immun Inflamm Dis. 2021.
5. Oral abstracts of the 11th IAS Conference on HIV Science, 18-21 July 2021. J Int AIDS Soc. 2021;24
Suppl 4:e25755.
6. Brown LB, Spinelli MA, Gandhi M. The interplay between HIV and COVID-19: summary of the data
and responses to date. Curr Opin HIV AIDS. 2021;16(1):63-73.
7. Mazzoni A, Salvati L, Maggi L, Annunziato F, Cosmi L. Hallmarks of immune response in COVID-19:
Exploring dysregulation and exhaustion. Semin Immunol. 2021:101508.
8. Liu Y, Xiao Y, Wu S, Marley G, Ming F, Wang X, et al. People living with HIV easily lose their immune
response to SARS-CoV-2: result from a cohort of COVID-19 cases in Wuhan, China. BMC Infect Dis.
2021;21(1):1029.
9. Alrubayyi A, Gea-Mallorqui E, Touizer E, Hameiri-Bowen D, Kopycinski J, Charlton B, et al.
Characterization of humoral and SARS-CoV-2 specific T cell responses in people living with HIV.
bioRxiv. 2021.
10. Snyman J, Hwa SH, Krause R, Muema D, Reddy T, Ganga Y, et al. Similar antibody responses against
SARS-CoV-2 in HIV uninfected and infected individuals on antiretroviral therapy during the first South
African infection wave. Clin Infect Dis. 2021.
11. Quiroga MF, Angerami MT, Santucci N, Ameri D, Francos JL, Wallach J, et al. Dynamics of adrenal
steroids are related to variations in Th1 and Treg populations during Mycobacterium tuberculosis
Page 13/25infection in HIV positive persons. PloS one. 2012;7(3):e33061.
12. Zhang J, Liu W, Wen B, Xie T, Tang P, Hu Y, et al. Circulating CXCR3(+) Tfh cells positively correlate
with neutralizing antibody responses in HCV-infected patients. Sci Rep. 2019;9(1):10090.
13. De Biasi S, Meschiari M, Gibellini L, Bellinazzi C, Borella R, Fidanza L, et al. Marked T cell activation,
senescence, exhaustion and skewing towards TH17 in patients with COVID-19 pneumonia. Nat
Commun. 2020;11(1):3434.
14. van den Bosch TP, Caliskan K, Kraaij MD, Constantinescu AA, Manintveld OC, Leenen PJ, et al. CD16+
Monocytes and Skewed Macrophage Polarization toward M2 Type Hallmark Heart Transplant Acute
Cellular Rejection. Front Immunol. 2017;8:346.
15. Ni L, Ye F, Cheng ML, Feng Y, Deng YQ, Zhao H, et al. Detection of SARS-CoV-2-Specific Humoral and
Cellular Immunity in COVID-19 Convalescent Individuals. Immunity. 2020;52(6):971-7 e3.
16. Sharov KS. HIV/SARS-CoV-2 co-infection: T cell profile, cytokine dynamics and role of exhausted
lymphocytes. Int J Infect Dis. 2021;102:163-9.
17. Boppana S, Qin K, Files JK, Russell RM, Stoltz R, Bibollet-Ruche F, et al. SARS-CoV-2-specific
circulating T follicular helper cells correlate with neutralizing antibodies and increase during early
convalescence. PLoS Pathog. 2021;17(7):e1009761.
18. Lindqvist M, van Lunzen J, Soghoian DZ, Kuhl BD, Ranasinghe S, Kranias G, et al. Expansion of HIV-
specific T follicular helper cells in chronic HIV infection. J Clin Invest. 2012;122(9):3271-80.
19. Phetsouphanh C, Xu Y, Zaunders J. CD4 T Cells Mediate Both Positive and Negative Regulation of
the Immune Response to HIV Infection: Complex Role of T Follicular Helper Cells and Regulatory T
Cells in Pathogenesis. Front Immunol. 2014;5:681.
20. Niessl J, Baxter AE, Morou A, Brunet-Ratnasingham E, Sannier G, Gendron-Lepage G, et al. Persistent
expansion and Th1-like skewing of HIV-specific circulating T follicular helper cells during
antiretroviral therapy. EBioMedicine. 2020;54:102727.
21. Karim F, Gazy I, Cele S, Zungu Y, Krause R, Bernstein M, et al. HIV status alters disease severity and
immune cell responses in variant SARS-CoV-2 infection wave. 2021.
22. Thevarajan I, Nguyen THO, Koutsakos M, Druce J, Caly L, van de Sandt CE, et al. Breadth of
concomitant immune responses prior to patient recovery: a case report of non-severe COVID-19. Nat
Med. 2020;26(4):453-5.
23. Sedaghat AR, German J, Teslovich TM, Cofrancesco J, Jr., Jie CC, Talbot CC, Jr., et al. Chronic CD4+
T-cell activation and depletion in human immunodeficiency virus type 1 infection: type I interferon-
mediated disruption of T-cell dynamics. J Virol. 2008;82(4):1870-83.
24. Townsend L, Dyer AH, Naughton A, Kiersey R, Holden D, Gardiner M, et al. Longitudinal Analysis of
COVID-19 Patients Shows Age-Associated T Cell Changes Independent of Ongoing Ill-Health. Front
Immunol. 2021;12:676932.
25. Peng Y, Mentzer AJ, Liu G, Yao X, Yin Z, Dong D, et al. Broad and strong memory CD4(+) and CD8(+)
T cells induced by SARS-CoV-2 in UK convalescent individuals following COVID-19. Nat Immunol.
2020;21(11):1336-45.
Page 14/2526. Antonioli L, Fornai M, Pellegrini C, Blandizzi C. NKG2A and COVID-19: another brick in the wall. Cell
Mol Immunol. 2020;17(6):672-4.
27. Perdomo-Celis F, Taborda NA, Rugeles MT. CD8(+) T-Cell Response to HIV Infection in the Era of
Antiretroviral Therapy. Front Immunol. 2019;10:1896.
28. Mikulak J, Oriolo F, Zaghi E, Di Vito C, Mavilio D. Natural killer cells in HIV-1 infection and therapy.
AIDS. 2017;31(17):2317-30.
29. Karim F, Gazy I, Cele S, Zungu Y, Krause R, Bernstein M, et al. HIV status alters disease severity and
immune cell responses in beta variant SARS-CoV-2 infection wave. Elife. 2021;10.
30. Mondi A, Cimini E, Colavita F, Cicalini S, Pinnetti C, Matusali G, et al. COVID-19 in people living with
HIV: Clinical implications of dynamics of the immune response to SARS-CoV-2. J Med Virol.
2021;93(3):1796-804.
31. Azkur AK, Akdis M, Azkur D, Sokolowska M, van de Veen W, Bruggen MC, et al. Immune response to
SARS-CoV-2 and mechanisms of immunopathological changes in COVID-19. Allergy.
2020;75(7):1564-81.
32. Deeks SG, Tracy R, Douek DC. Systemic effects of inflammation on health during chronic HIV
infection. Immunity. 2013;39(4):633-45.
33. Lei J, Yin X, Shang H, Jiang Y. IP-10 is highly involved in HIV infection. Cytokine. 2019;115:97-103.
34. Van der Sluis RM, Kumar NA, Pascoe RD, Zerbato JM, Evans VA, Dantanarayana AI, et al.
Combination Immune Checkpoint Blockade to Reverse HIV Latency. J Immunol. 2020;204(5):1242-
54.
35. Buszko M, Nita-Lazar A, Park JH, Schwartzberg PL, Verthelyi D, Young HA, et al. Lessons learned: new
insights on the role of cytokines in COVID-19. Nat Immunol. 2021;22(4):404-11.
36. Braun J, Loyal L, Frentsch M, Wendisch D, Georg P, Kurth F, et al. SARS-CoV-2-reactive T cells in
healthy donors and patients with COVID-19. Nature. 2020;587(7833):270-4.
37. Le Bert N, Tan AT, Kunasegaran K, Tham CYL, Hafezi M, Chia A, et al. SARS-CoV-2-specific T cell
immunity in cases of COVID-19 and SARS, and uninfected controls. Nature. 2020;584(7821):457-62.
38. Sekine T, Perez-Potti A, Rivera-Ballesteros O, Stralin K, Gorin JB, Olsson A, et al. Robust T Cell
Immunity in Convalescent Individuals with Asymptomatic or Mild COVID-19. Cell. 2020;183(1):158-
68 e14.
39. Grifoni A, Weiskopf D, Ramirez SI, Mateus J, Dan JM, Moderbacher CR, et al. Targets of T Cell
Responses to SARS-CoV-2 Coronavirus in Humans with COVID-19 Disease and Unexposed
Individuals. Cell. 2020;181(7):1489-501 e15.
40. Owen RE, Sinclair E, Emu B, Heitman JW, Hirschkorn DF, Epling CL, et al. Loss of T cell responses
following long-term cryopreservation. J Immunol Methods. 2007;326(1-2):93-115.
Figures
Page 15/25Figure 1
Clinical manifestations and anti-SARS-CoV-2 antibody responses in PWH and HIVneg individuals. (A)
Frequency of occurrence of the depicted symptoms in PWH (red) and HIVneg (blue) cohorts. (B)
Proportion of measurable IgG responses in PWH and HIVneg participants. Chi Squared test, ns. (C) IgG
NOD values, (D) IgG titers, and (E) neutralizing Anti-SARS-CoV-2 antibodies were determined in plasma
from PWH and HIVneg individuals as described in the Materials and Methods section. Mann-Whitney test
Page 16/25was used. p < 0.05 were considered significant. Data are expressed as median and interquartile range. (F)
Heatmap depicting from red (+1) to blue (-1) Spearman Rank correlation values between each
parameter. p values per correlation are shown in those boxes where statistics were significant. **p < 0.01;
****p < 0.0001.
Figure 2
Page 17/25Analysis of antibody-secreting cells and CD4+ T-lymphocytes’ phenotype in PWH and HIVneg
donors. Frequency of (A) Analysis of antibody-secreting cells (ASC), (B) B lymphocytes, (C) CD4+ Th1,
Th17 and Th1* (Th1/Th17) subpopulations, (D) Tfh, and (E) CXCR3+ Tfh cells in SARS-CoV-2
convalescent PWH (n =25) and HIV-negative (n =24) individuals via traditional gating, as showed in
Supplementary Figure 1. Each dot represents an individual donor. Data are expressed as median and
interquartile range. Representative flow cytometry graphs depicting each analyzed marker in PWH (upper
panels) and HIVneg (lower panels) donors are shown. Significance was determined by two-tailed
Mann−Whitney U test, *p < 0.05, **p < 0.01, ***p < 0.001. (F) Profile of Tfh cell markers using Uniform
manifold approximation and projection (UMAP) analysis between PWH (red) and HIVneg individuals
(blue). (G) Spearman test (two-tailed) demonstrated a negative correlation between IgG titters and
frequency of Tfh in PWH.
Page 18/25Figure 3
Study of activation/memory markers on CD4+ and CD8+ T cells from PWH and HIVneg donors.
(A) Frequency of CD4+ T lymphocytes expressing CD57, PD-1 or CD57/PD-1. (B) Proportion of CD8+ T
lymphocytes expressing HLA-DR, CD38 or both. Markers were determined via traditional gating as
depicted in Supplementary Figure 1 in SARS-CoV-2 convalescent PWH (n =25, red dots) and HIV-negative
(n =24, blue dots) individuals. Each dot represents an individual donor. Data are expressed as median and
Page 19/25interquartile range. Representative flow cytometry graphs depicting each analyzed marker in PWH (upper
panels) and HIVneg (lower panels) donors are shown. **p < 0.01, ***p < 0.001. Significance was
determined by two-tailed Mann−Whitney U test.
Figure 4
Page 20/25Analysis of peripheral NK cells’ phenotype in PWH and HIVneg donors. Frequency of (A) total NK cells; (B)
CD25+ NK cells; (C) CD95+ NK cells; (D) NKp46+ NK cells; (E) HLA-DR+ (left) and HLA-DR+/CD38+ co-
expressing (right) NK cells in SARS-CoV-2 convalescent PWH (n =20) and HIV-negative (n =29) individuals
via traditional gating, as showed in Supplementary Figure 1. Each dot represents an individual
donor. Data are expressed as median and interquartile range. Representative flow cytometry graphs
depicting each analyzed marker in PWH (upper panels) and HIVneg (lower panels) donors are
shown. Significance was determined by two-tailed Mann−Whitney U test, *p < 0.05, **p < 0.01, ****p <
0.0001.
Page 21/25Figure 5
Assessment of serum cytokines and chemokines in PWH and HIVneg donors. The concentrations of
CCL8/IL8; CXCL10/IP10; IFN-γ; TNF-α; IL-17A IL-10 and IL-6 were determined by a multiplex assay and
flow cytometry. Data are depicted as the log-transformed concentration values (pg/mL). Each point
represents an individual donor. Data are expressed as median and interquartile range. Significance was
determined by two-tailed Mann−Whitney U test, **p < 0.01, ***p < 0.001, ****p < 0.0001.
Page 22/25Figure 6
Cellular immune response after in vitro stimulation of PBMCs from PWH and HIVneg with SARS-CoV-2
protein antigens and peptide pools. IFN-γ ELISpot assays were performed to determine the frequency of
Ag-experienced T cells in peripheral blood from the individuals enrolled. Stimulation of BPMCs with Spike
(S) protein, RBD protein, Nucleocapside (N) protein or a peptide pool encompassing S protein or N protein
was performed. Afterwerads, IFN-γ producing cells were determinined as illustrated in the Materials and
Page 23/25Methods section. (A) Heatmap depicting the relative-to-media magnitude of the IFN-γ ELISpot responses
to the different SARS-CoV-2 proteins or peptide pools in PWH and HIVneg participant. Each row represent
an individual. (B) In order to compare group differences, data were normalized to media levels. Each dot
represents an individual donor. Data are expressed as median and interquartile range. Significance was
determined by two-tailed Mann−Whitney U test, *p < 0.05; **p < 0.01. A.U.: arbitrary units.
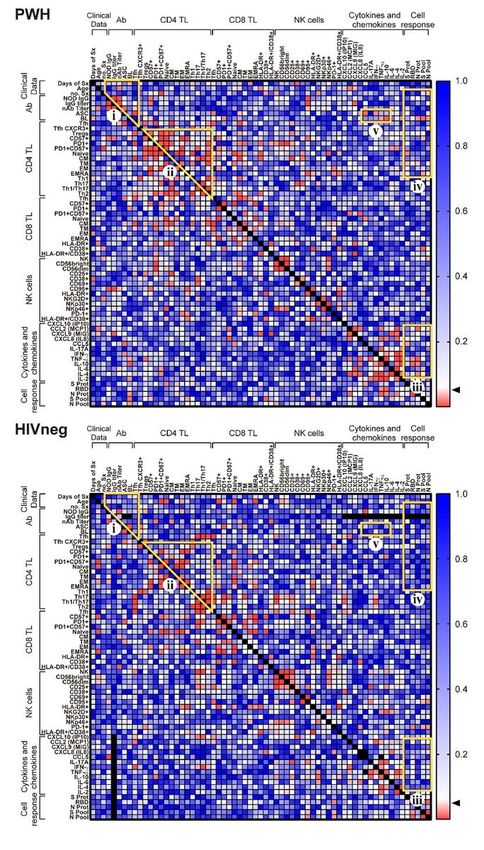
Figure 7
Page 24/25Immune parameters and clinical correlates in PWH and HIVneg donors. Statistically significant Spearman
rank correlation values (p) are shown from red (0) to blue (+1.0). Arrow shows p = 0.05 value. R-values
per correlation are shown in Supplementary Figure 4. Demarcated regions (yellow line) indicate a set of
correlations that differ between PWH and HIVneg participant group. The regions with statistically
significant correlations were denominated i, ii, iii, iv and v for a better analysis. Square brackets
encompass clinical, serological, phenotypic, cytokine/chemokines’ levels or cellular response parameters.
Supplementary Files
This is a list of supplementary files associated with this preprint. Click to download.
SupplementaryFigures.docx
Page 25/25You can also read