Language vs Speaker Change: A Comparative Study - arXiv
←
→
Page content transcription
If your browser does not render page correctly, please read the page content below

Language vs Speaker Change: A Comparative Study
                                                   Jagabandhu Mishra1, a and S. R. Mahadeva Prasanna1, b
                                                   Department of Electrical Engineering, IIT Dharwad, Dharwad 580011, Karnataka, India.
                                                   (Dated: 8 March 2022)
                                                   Spoken language change detection (LCD) refers to detecting language switching points in a
                                                   multilingual speech signal. Speaker change detection (SCD) refers to locating the speaker
                                                   change points in a multispeaker speech signal. The objective of this work is to understand the
                                                   challenges in LCD task by comparing it with SCD task. Human subjective study for change
                                                   detection is performed for LCD and SCD. This study demonstrates that LCD requires larger
                                                   duration spectro-temporal information around the change point compared to SCD. Based on
                                                   this, the work explores automatic distance based and model based LCD approaches. The
                                                   model based ones include Gaussian mixture model and universal background model (GMM-
arXiv:2203.02680v1 [eess.AS] 5 Mar 2022

                                                   UBM), attention, and Generative adversarial network (GAN) based approaches. Both the
                                                   human and automatic LCD tasks infer that the performance of the LCD task improves by
                                                   incorporating more and more spectro-temporal duration.
                                                   ©2022 Acoustical Society of America.       [https://doi.org(DOI number)]

                                                   [XYZ]                                                                             Pages: 1–12

                                          I. INTRODUCTION                                               2020). Therefore a change point detection based ap-
                                                                                                        proach for SLD is an interesting alternative compared
                                               Spoken language diarization (SLD) is a task to au-       to the phonotactic approach. Thus this study focuses
                                          tomatically segment and label the monolingual segments        on the development of spoken language change detection
                                          in a given multilingual speech signal. The existing works     (LCD) through a comparative analysis between LCD and
                                          towards SLD are very few (Sitaram et al., 2019). Ma-          speaker change detection (SCD). Even though the frame-
                                          jority of them use phonotactic (i.e. the distribution of      work seems simple to adopt, there are challenges in do-
                                          sound units) based approaches (Chan et al., 2004; Lyu         ing so. Around the speaker change, there are significant
                                          et al., 2013; Spoorthy et al., 2018). The development of      changes in terms of excitation source, vocal tract system
                                          SLD using a phonotactic-based approach requires tran-         and suprasegmental information. However, around the
                                          scribed speech utterances. The same is difficult to obtain    language, there are only minimal changes due only to in-
                                          as most of the languages present in the code-switched         formation available at suprasegmental levels. Thus it will
                                          multilignual utterances are resource-scare in nature (Li      be more challenging to do LCD compared to SCD.
                                          et al., 2013; Spoorthy et al., 2018). Hence there is a need        Fig. 1 (a) and (b), show the time domain speech
                                          for exploring alternative approaches for SLD. For this the    signals corresponding to the utterance having speaker
                                          speaker diarization (SD) work may come handy. SD is a         change and language change, respectively. The manual
                                          task to automatically segment and label the speaker iden-     identified change points are marked. From the time do-
                                          tity for a given multispeaker utterance. Further, most of     main signal, it is very difficult to locate both the speaker
                                          the approaches used for spoken language recognition are       and language change points. Fig. 1 (c) and (d) show the
                                          the modified and time-delayed versions of the approaches      spectrogram of both the utterances. Around the speaker
                                          used to perform the speaker recognition task (Richard-        change, there exist changes in the excitation source, vo-
                                          son et al., 2015; Snyder et al., 2018). This motivates for    cal tract and suprasegmental information which may pro-
                                          a close association between SLD and SD tasks and may          vide enough evidence to detect the speaker change. On
                                          be exploited to come up with approaches for SLD.              the other hand, as a single speaker is speaking both the
                                               The SD field has evolved mainly in two ways: (1)         languages, these changes are not visible. Hence the chal-
                                          change point detection followed by clustering and bound-      lenge in LCD compared to SCD.
                                          ary refinement, and (2) fixed duration segmentation fol-           It is interesting to note that humans discriminate be-
                                          lowed by i-vector/ embedding vector extraction, clus-         tween spoken languages without knowing the lexical rules
                                          tering and boundary refinement (Moattar and Homay-            and phonemic distribution of the respective languages.
                                          ounpour, 2012; Park et al., 2022; Tranter and Reynolds,       Of course humans need to have some prior exposure to
                                          2006). It has been observed from the literature that the      the languages (Li et al., 2013). Humans may exploit the
                                          initial change point detection is an important stage to im-   long term spectro-temporal relations to discriminate be-
                                          prove the overall SD performance (Dawalatabad et al.,         tween languages. Motivating from the same, SLD system
                                                                                                        can also be developed using acoustic-phonetic informa-
                                                                                                        tion exploited at suprasegmental levels (Liu et al., 2021;
                                          a jagabandhu.mishra.18@iitdh.ac.in
                                          b prasanna@iitdh.ac.in
                                                                                                        Zhang, 2013). The advantage of the acoustic-phonetic

                                          J. Acoust. Soc. Am. / 8 March 2022                                                              JASA-Article/LCDvsSCD   1
terms of the number of voiced frames taken around the
                                                              true/false change point.
                                                                   The dataset used for this study consists of 15 utter-
                                                              ances having language change and 15 utterances having
                                                              speaker change. The language change utterance from
                                                              the Multilingual and code-switched (MUCS2021) Hindi-
                                                              English corpus (Diwan et al., 2021) and the speaker
                                                              change utterances are selected from IITG-MV phase 3
                                                              and DIHARD dataset (Haris et al., 2012; Ryant et al.,
                                                              2018). The selected two-language and two-speaker utter-
                                                              ances are split around the change point to generate 30
                                                              mono utterances in each case. Out of 30, after listening,
                                                              best 15 for each case have been chosen for this study.
                                                              For two- language or speaker utterances actual change
                                                              points are termed as true change point and for mono
FIG. 1. (a) and (c) Two speaker time domain speech signal     language or speaker utterance, the starting point of the
and its spectrogram, respectively. (b) and (d) Two language   middle voiced frame is termed as false change point. Af-
(Bilingual) time domain speech signal and its spectrogram,    ter that, each utterance S(n) are masked by considering
respectively.                                                 x number of voiced frames (NVF-x) from the left and
                                                              right of the true/false change point. To detect the voiced
                                                              frames, a short time energy (STE) based approach has
based approach is, it does not require transcribed speech     been used with a frame size of 20 msec and a frame shift
data.                                                         of 10 msec (Rabiner, 1978). According to the value of
     Based on the need to exploit the long term spectro-      x, the masked utterances are grouped into five different
temporal evidence, it is hypothesized that the LCD re-        groups, termed as NVF-10, NVF-20, NVF-30, NVF-50
quires more neighborhood information around the change        and NVF-75. To avoid abrupt masking, a Gaussian mask
point than the SCD. To validate the same, a human sub-        G(n) with appropriate parameters is multiplied with the
jective study will be performed to detect the language        utterances to obtain the masked utterance Sm (n) =
and speaker changes. Further, automatic change point          S(n) × G(n). the masked signal is passed through a en-
detection methods based on distance based approaches          ergy based endpoint detection algorithm to obtain the
and model based approaches are carried out. The model         final masked utterance (Rabiner, 1978). The detailed
based approaches include Gaussian mixture model - uni-        procedure of masked segment generation is attached
versal background model (GMM-UBM), attention and              in supplementary1 , and also generated segments are
GAN based approaches (Chen et al., 2020; Raffel and           available at https://github.com/jagabandhumishra/
Ellis, 2015; Reynolds, 1995). All these modeling ap-          Speaker-and-Language-change-detection-by-human
proaches working principles are different and hence ex-            The listening experiment has been conducted with
ploit the long term information in different ways to model    10 subjects. The subjects are chosen such that they have
the change points.                                            previous exposure to the languages present in the chosen
     The rest of the article is organized as follows: Sec-    utterances. For the listening study each listener has to
tion II describes human change point detection studies        listen to 300 segments (i.e 150 each for language change
performed. The unsupervised distance based approach           and speaker change). Taking care of the comfortability of
explored for LCD are described in Section III. The model      listeners, the listening study has been conducted in two
based approaches are explained in Section IV. The exper-      sessions, one session for language change study and an-
imental setup results and discussion are given in Section     other for speaker change study. To avoid any perceptual
V. The work summarized and concluded in Section VI.           discomfort, the subjects are advised to maintain at least
                                                              3 to 4 hours of gap between the sessions. A graphical
                                                              user interface (GUI) has been designed to perform the
II. LANGUAGE AND SPEAKER CHANGE DETECTION BY                  listening study. For a specific language/speaker change
HUMANS                                                        study, all the 150 masked utterances are presented to the
                                                              listener in a random order, irrespective of their segment
     The subjective study is to show that humans may re-
                                                              duration. If the listener is unable to provide the response
quire more neighborhood duration around change point
                                                              for one time playing, s/he is allowed to play the utter-
to discriminate between languages than speakers. An ex-
                                                              ance multiple times. Motivated from the study reported
perimental procedure where the human subjects are ex-
                                                              in (Sharma et al., 2019), three kinds of responses have
posed to the pool of utterances that may or may not have
                                                              been recorded. These are (1) language / speaker change
language / speaker change. The subjects are asked to
                                                              detected or not (2) number of time replayed (NR) and
mark, if there exists a language / speaker change or not.
                                                              (3) response time (RT). RT is the time duration taken by
The utterances are classified into five groups. Each group
                                                              a subject to provide his/her response, after listening to
is represented with approximate duration considered in
                                                              the full utterance. The duration taken by a subject (i.e.

2    J. Acoust. Soc. Am. / 8 March 2022                                                            JASA-Article/LCDvsSCD
41.67                                                                        Speaker
        40                                                                                         Language
  (a)
                                       20.33
        20
              11.33                                           15                  11.67
                                7.67                  6.33                   5                 4.33     8
          0
                NVF-10           NVF-20                NVF-30                NVF-50             NVF-75

                      1.02
          1
  (b)                                  0.67                  0.64
        0.5    0.46
                                0.33                                              0.35
                                                      0.25                 0.23               0.18 0.24
          0
                NVF-10           NVF-20                NVF-30               NVF-50             NVF-75

          4
                       3.2             3.14                  2.97
          3    2.47
  (c) 2                         2.07                                              2.07
                                                      1.7                  1.74                       1.62
                                                                                               1.25
          1
          0
                NVF-10           NVF-20                NVF-30                NVF-50             NVF-75

                        21.33
        20
  (d)
        10
                3.67                           5.33                                                 3.67
                                                                           3.33
                                        1.33                        1.33                    0.67
         0
              NVF-10:NVF-20        NVF-20:NVF-30                NVF-30:NVF-50             NVF-50:NVF-75
                                                                                                                    FIG. 3. Distance computation around the true and false
                                                                                                                    change point of an utterance, (a) true change point and (b),
                                                                                                                    (c) false change points, fl d and tr d are Fd and Td respec-
FIG. 2. Subjective study performance: (a) %DER, (b) N R,
                                                                                                                    tively.
(c) RT and (d) %absolute deviation DER.

                                                                                                                    served that, irrespective of the group, human subjects
from pressing play button to pressing yes/no button) to                                                             are able to better perceive the speaker change than the
provide his/her response (termed as total duration (TD))                                                            language change. Fig 2(b) and (c) shows irrespective of
is recorded through GUI. The RT is computed by sub-                                                                 the group, human subjects are less confused to provide
tracting the respective utterance duration (UD) from the                                                            their response for speaker change study than the lan-
TD (i.e. RT = T D − U D).                                                                                           guage change study (as the N R and RT values are less
                                        Ns                                                                          in speaker than the language change study). Fig 2(d)
                                        X  (F As + F Rs ) × 100                                                     shows the absolute deviation in the DER with respect to
                         DER =                                                                                (1)
                                        s=1
                                                              Ns × N                                                the groups for both speaker and language change stud-
     There are three kinds of performance measures used                                                             ies. The absolute deviation in the DER saturates beyond
in this study: (1) average detection error rate (DER)                                                               NVF-30 for speaker change study and at NVF-50 for lan-
(2) average number of times replayed (N R) and (3) av-                                                              guage change study. This indicates, beyond 30 voiced
erage response time (RT ). The DER is defined in Eq. 1,                                                             frames for speaker change and 50 voiced frames for lan-
where Ns is the number of subjects participated in this                                                             guage change, the perceptual ability to detect speaker
study, N is the total number of trails, F A is the number                                                           and language change increases with increase in number
of false language/ speaker change segments, marked as                                                               of voiced frames, but not that significant. Taking these
true by the listener and F R is the number of true lan-                                                             observations, we can conclude human cognition requires
guage / speaker change segments, marked as false by the                                                             a larger duration around the change point to perform
listener. The DER measure defines the inability of the                                                              LCD than SCD.
listeners to detect language / speaker change. The N R,
provides an estimation of the average number of replay’s                                                            III. LANGUAGE AND SPEAKER CHANGE DETECTION
required to the subjects to mark his response comfort-                                                              BY DISTANCE BASED APPROACH
ably. Similarly the RT provides an estimation of average
duration required for the subjects to perceive the lan-                                                                  Motivated by the subjective study described earlier,
guage / speaker change, after listening to the respective                                                           this section describes a cepstral distance based automatic
utterances. Higher value of the performance measures                                                                framework for performing LCD and SCD. The hypoth-
indicates inability of the human subject to perceive the                                                            esis is that the with language / speaker change may be
language / speaker and vice versa.                                                                                  attributed to difference in the cepstral distance having
     The obtained performance measures from the human                                                               higher values than the no change cases. Further, increase
subjective study for different groups of masked utter-                                                              in voiced frames may lead to increase in the positive sepa-
ances are depicted in Fig. 2. The values of all three per-                                                          ration between the distance distribution obtained around
formance measures decrease with increase in the num-                                                                the true change (Td ) than the false change (Fd ).
ber of voiced frames (i.e. from NVF-10 to NVF-75)                                                                        The same set of utterances used in subjective study
around the true/false change point. This hints that the                                                             are considered here. With respect to the number of
ability of human subjects to perceive the language and                                                              voiced frames x around the change point, the analy-
speaker change increases with increase in the number of                                                             sis is performed in five groups (i.e {N V F − x : x =
voiced frames. With respect to DER, it can be ob-                                                                   {10, 20, 30, 50, 75}}). Given an utterance and the value

J. Acoust. Soc. Am. / 8 March 2022                                                                                                                  JASA-Article/LCDvsSCD     3
FIG. 4. Distance distribution around true and false language            FIG. 5. Distance distribution around true and false speaker
change point: (a) Symmetric KL divergence, (b) GLR, (c)                 change point: (a) Symmetric KL divergence, (b) GLR, (c)
BIC (λ = 0.1) and (d) CD values, fl d and tr d are Fd and Td            BIC (λ = 0.1) and (d) CD values, fl d and tr d are Fd and Td
respectively.                                                           respectively.

of x, the detailed procedure of Td and Fd computation                   to measure the positive separation between the distribu-
is depicted in Fig. 3. An utterance having a true change                tion of Td and Fd scores. The objective is to compute the
at point (a) has been shown in Fig. 3. Splitting the ut-                positive separation, so square root of the LDA objective
terance around the point (a) generates two mono seg-                    function is taken as CD measure. The CD measure is
ments. The starting point of the mid-voiced frame of                    defined in Eq. 2, where µt , µf , σt2 and σf2 are the mean
the mono segments is used as the false change points (i.e               and variance of the Td and Fd scores, respectively. The
(b) and (c)). For a specific analysis group (i.e. NVF-x),               measure is expected to provide positive confidence value,
the MFCC−∆ − ∆∆ feature vectors of the x number of                      if the mean of Td distribution is higher than the mean of
voiced frames from the left and right of the true/ false                Fd , and increases with increase in the positive separation.
change point has been taken and termed as A and B seg-
ment, respectively. Then A and B can be represented as                                            µt − µf
                                                                                            CD = q                              (2)
A = {f−1 , f−2 , . . . , f−x } and B = {f1 , f2 , . . . , fx }. After                              σt2 + σf2
that, for a given true/false change point, distance be-
tween segment A and B are computed and termed as                             The obtained distributions of Td and Fd for both
Td /Fd .                                                                LCD and SCD study are depicted with box plots in Fig. 4
     Three kinds of distance measures that generally used               and 5. For LCD task, irrespective of the number of voiced
in the SCD literature, namely, (1) symmetric KL diver-                  frames, the mean of the Fd is higher than the mean of Td
gence (Siegler et al., 1997), (2) generalized likelihood ra-            distribution (from Fig 4(a), (b), (c), and (d)). This may
tio (GLR) (Gish et al., 1991) and (3) Bayesian infor-                   be due to the cepstral features with a single Gaussian
mation criteria (BIC) (Chen et al., 1998) are used here.                are not able approximate the language specific phonemic
All three measures use Gaussian approximation of the                    information. As a single speaker has spoken both the lan-
feature vectors present in a segment. That is the fea-                  guages, so there exist no change in speaker specific vocal
ture vectors in segment A and B can be approximated as                  tract system. Again with increase in number of voiced
A ∼ N (µA , ΣA ) and B ∼ N (µB , ΣB ). As the number of                 frames, the overlap between the Td and Fd increases (i.e.
feature vectors (i.e. between 10 to 75) are too small to                the CD values approaching to zero), that may be due to
estimate the full covariance matrix, this study estimates               the cepstral feature with single Gaussian approximating
the diagonal covariance matrix (Reynolds, 1995). A mea-                 the speaker characteristic. As both around true and false
sure called confidence in discrimination (CD) (inspiring                change point, there exist no change in speaker, thus the
from the objective function of linear discriminate analy-               distribution of Td and Fd approaching towards near iden-
sis (LDA) (Hart et al., 2000)) has been introduced here                 tical. Similarly for SCD task, irrespective of the distance

4    J. Acoust. Soc. Am. / 8 March 2022                                                                       JASA-Article/LCDvsSCD
Spk 1 Lang 1
1
Spk 2
1
Lang 2 exposure to the respective languages. Therefore to cap-
CP CP
ture the prior language specific distribution model based
0.5 0.5
approaches may be desirable.
Magnitude
0 0 Initially Gaussian mixture model universal back-
-0.5 -0.5 ground model (GMM-UBM) based approach is used and
the details are discussed in section IV A. GMM-UBM
0 2 4 6 8 10 0 2 4 6
(a)
Time (seconds) (c)
along with MFCC-∆ − ∆∆ features can only capture
1 1
the phonemic variation pattern present in the approx-
0.5 0.5
imately 100 msec (for NDL=2 (Ambikairajah et al.,
0 0
2011)) voiced speech segment. But, the speech produc-
-0.5 -0.5 tion literature tells, humans can produce four to five syl-
-1
-1 -0.5 0 0.5 1
-1
-1 -0.5 0 0.5 1
lables per second (Cruttenden, 2014). That means to
(b) (d)
capture the phonemic variation for at least a syllable level
requires 200 to 250 msec duration. Hence to further im-
FIG. 6. (a),(b) Two speaker utterance and its MFCC features prove the performance, we may require a modeling tech-
Tsne distribution and (c), (d) Two language utterance and its nique, which is able to capture the temporal sequence in-
MFCC features Tsne distribution formation. Out of many sequence learning architectures
proposed in literature (recurrent neural network (RNN)
and its variants), a comparatively simple attention based
measure, the positive separation between the Td and Fd architecture (Raffel and Ellis, 2015) has been used in this
distribution increases with increase in number of voiced study and the details are discussed in section IV B.
frames around the change point(from Fig 5(a), (b), (c), Humans generally remember the language specific
and (d)). This observation can be better remarked from pattern and try to discriminate between languages by
bar plot of the CD measure depicted in Fig. 5(d). The CD recall. On the other hand, the attention based archi-
value increases with increase in number of voiced frame tecture used here, is learned to discriminate between the
around the change point. This happens due to the change language specific phonemic variation patterns of different
in vocal tract system, which may lead to the change the languages, instead of implicitly learning the distribution
speaker specific pattern of vocal tract resonances. With of language specific phonemic variation patterns. To fur-
small number of voiced frames, the Gaussian distribu- ther improve the ability of language detection, out of
tion approximates to the phonemic variation may be a many generative learning strategies, a generative adver-
reason for negative CD value of NVF−10. With increase sarial network (GAN) based framework has been used in
in number of voiced frames, the Gaussian distribution this study and the details are discussed in section IV C.
start approximating the speaker characteristics, may be Another motivation of choosing GAN is, it uses an im-
a reason for increase in the CD values. This suggests, it plicit framework to capture the data distribution through
is difficult to locate the language change point using the the generator (Goodfellow, 2016).
cepstral distance based approaches. The model based study has been conducted with a
limited amount of vocabulary of each language. 327 ut-
terances has been chosen from the MUCS2021 Hindi-
IV. LANGUAGE AND SPEAKER CHANGE DETECTION English dataset which has only one language change
BY MODEL BASED APPROACH point and has at least 3 − 4 syllables from each language.
The subjective study confirms the ability of human The language change point and language labels are man-
subjects to discriminate between the languages. At the ually annotated. The utterances are randomly split with
same time, the objective analysis with MFCC-∆ − ∆∆ 70% − 30% to generate the train and test set. For all
features showing their ineptness to discriminate between the studies MFCC-∆ − ∆∆ features are used. The man-
the languages. This may be due to the phonemic varia- ually annotated utterances and its corresponding change
tion captured by MFCC-∆ − ∆∆ feature vectors are not point annotations are available at https://github.com/
that significant to discriminate between languages. Fur- jagabandhumishra/Annotated_files_MUCS_HE.
ther to verify the fact, a two-dimensional projection of
the feature vectors of both language and speaker change A. GMM-UBM based approach
segment is depicted in Fig. 6. The feature vector’s t-SNE
plot shows a clear separation between the two speakers, An UBM model of cluster size 256 is trained using
whereas there is significant overlap in language change the utterances present in the training set. After that, the
case. Thus when a single speaker speaks both the lan- utterances are split into Hindi and English subset, us-
guages, the feature vectors are failing to capture the lan- ing the information of corresponding utterance’s change
guage specific phonemic variations. That may be due point and language annotations. Then, the Hindi and
to the pronunciation based phonemic variations of the English subset is used for modeling the language specific
secondary language are mostly biased towards the varia- adaptation models (Wong and Sridharan, 2002). As, the
tions of the primary language. Humans may be able to chosen code-switched utterances are consist of two lan-
discriminate between the languages by invoking previous guages (i.e. Hindi and English), during testing, the frame
J. Acoust. Soc. Am. / 8 March 2022 JASA-Article/LCDvsSCD 5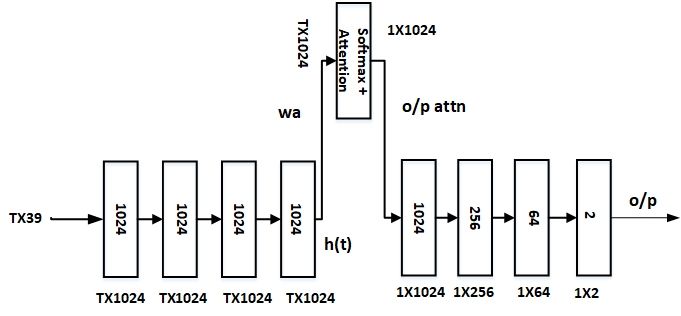
FIG. 8. Attention based network architecture

FIG. 7. Procedure to compute distance from the obtained                       both dstt and ldvt is higher than the median of dstf and
likelihood contour of an utterance, dist t and dist f are dstt                ldvf distribution. Also can be observed that, irrespective
and dstf respectively.
                                                                              of the measure, with increase in number of voiced frames,
                                                                              the positive separation between the true to false distri-
                                                                              bution increases. This leads to an increase in the CD and
                                                                              demonstrates the ability of the GMM-UBM approach to
wise likelihood contour (llkh (xi ) and llke (xi )) is com-                   perform LCD task.
puted, where i indicates the frame index.
     The study use two approaches: (a) distance based
(dst) and (b) likelihood deviation based (ldv) to show                        B. Attention based approach
the ability of GMM-UBM approach to perform LCD task.                               This study uses an attention based architecture con-
For a given test utterance, the true and false segments                       sisting of 7 hidden layers and one attention layer. The
have been generated as shown in Fig. 3. In distance                           network has 39 input layer neurons and 2 output layer
based approach, For a given true/ false segment, the vecA                     neurons. First four layers consist of 1024 neurons each
and vecB is computed as, vecA = {llkh (A), llke (A)} and                      and designed to operate at frame level. The output of the
vecB = {llkh (B), llke (B)}. After that the distance be-                      forth hidden layer has passed through the attention layer
tween the vectors is computed as dst = ||vecA − vecB ||22 .                   to capture the temporal dynamic information in segment
Ideally, during the change, the likelihood contour should                     level (Siddhartha et al., 2020). The attention architec-
exhibit a cross over (as shown in Fig. 7), hence assumed                      ture and the flow of feature vectors through the different
that dstt distribution has higher values than the dstf                        layers of the architecture is shown in Fig. 8. As men-
distribution. Similarly, in likelihood deviation based ap-                    tioned in our previous work, the network has been trained
proach, for a given analysis group (i.e. NVF-x), the ldv                      to capture the temporal segment information present in
is computed as per Eq. 3. Where fi are the feature vec-                       50 voiced frames (i.e. approximately 500 msec) (Mishra
tors around the change point. Ideally, around the change                      et al., 2021). The network has been trained for 50 epochs
point, there exist a sudden change (either drop/ increase)                    with an Adam optimizer and a learning rate of 0.001. Af-
in the cumulative likelihood evidence for a specific lan-                     ter observing the training and validation loss and accu-
guage. Therefore it is hypothesized that, the ldvt distri-                    racy, the model corresponding to the 12th epoch is chosen
bution has higher values than the ldvf distribution. With                     for further study.
increase in x around the change point, the CD measure                              The distance distribution (dstt and dstf ), has been
for both the measure should increase, as with increase in                     computed from the output contour extracted from the at-
number of voiced frames. The obtained true and false dis-                     tention network. The outputs are the linear outputs from
tribution for both the measures and their corresponding                       the attention network’s output layer. As the network is
CD values are shown in Fig. 11(a),(d) and Fig. 12(a),(d),                     trained with 50 voiced frames, so during testing, the out-
respectively.                                                                 put contour is extracted for frame shift by considering
                                                                              50 frame context. The center frame index of the context
                x                     x                                       segment is used as the frame index. The extracted out-
            1   X                     X
                                                                              put contour for an utterance along with its corresponding
    ldv =             llkh (f−i ) −         llkh (fi )
            2   i=1                   i=1
                                                                              ground truth change point is shown in Fig 10(b).
                          x                     x
                                                                    !   (3)
                          X                     X
                      +         llke (f−i ) −          llke (fi )
                          i=1                    i=1
                                                                                                                                          !
    The figure shows that, irrespective of the number of                             1               F (A|λh )                   F (A|λe )
                                                                               ldv =       log                       + log                        (4)
voiced frames around the change point, the median of                                 2               F (B|λh )                   F (B|λe )

6    J. Acoust. Soc. Am. / 8 March 2022                                                                                  JASA-Article/LCDvsSCD
The ldv measure is computed from the output of the
attention network as mentioned in Eq. 4, where F (A|λh )
denotes the softmax output of the Hindi node for an
input segment A. For a specific value of x (NVF-x),
A = {f−x , . . . , f−1 }). Ideally similar to the GMM-UBM
approach, the ldvt distribution has higher values than
the ldvf distribution. And also with increase in x value,
the positive deviation between the two distributions in-
creases. This leads to the increment of CD values with
increase in x. The obtained true and false distribution for
both the measures and their corresponding CD values are
shown in Fig 11(b),(d) and Fig 12(b),(d), respectively.
From the plot it can be observed that, irrespective
of the analysis group and measures, the CD values are
positive. This signifies the ability of the approach to de-
tect the language change. It can also be observed that,
with an increase in the number of voiced frames around
the change point the CD value increases which signifies
FIG. 9. GAN based network architecture
that the true distribution has higher positive deviation
from the false distribution. Compared to the GMM-UBM
based approach, it can be observed by comparing the CD
values depicted in Fig. 11(d) and Fig. 12(d), that the pixel shuffler up scale the temporal frames to reconstruct
attention based approach has higher positive deviation the input feature (Chen et al., 2020).
between the true and false distributions. This is better The generator and discriminator are trained using
evident from the Fig. 10(a) and (b). The confidence in three kinds of loss functions: (1) Least square GAN loss,
detecting a language is higher in case of attention based (2) Huber loss and (3) cross entropy loss. The least
approach than the GMM-UBM based approach. Only square GAN and Huber loss are used here to stabilize the
at the NVF-10 analysis group, the CD value for both training and for better contextual reconstruction (Chen
the measures are smaller than the GMM-UBM based ap- et al., 2020). The cross entropy loss is used to condition
proach. This may be due to the attention network trained the network to learn the class specific information. The
with 10 voiced frames may not be able to capture ap- discriminator provides two kinds of outputs, one belongs
propriate language specific information. This shows the to real/fake detection and the other belongs to classifi-
importance of temporal modeling towards detecting lan- cation. The parameters of the discriminator are updated
guage change points. using the sum of both least square GAN loss and cross en-
tropy loss. Similarly, the parameters of the generator are
updated using the sum of all three loss functions. The ar-
C. GAN based approach chitecture of both the generator and discriminator along
There are many variants of GAN architectures pro- with their layer wise input output flow, have been de-
posed in the speech processing literature (Goodfellow, picted in Fig. 9. During training, the network is trained
2016). Out of them, the auxiliary classifier conditional for 1300 epochs with Adam optimizer. The learning rate
GAN (ACGAN) has been extensively used for classifica- of 0.0002 is used for both generator and discriminator
tion tasks (Shen et al., 2017). The ACGAN framework training. For improving the stability, label smoothing is
that is used in this work is depicted in Fig. 9. For com- employed to the ground truth labels of real/fake sam-
parison, the feature extraction and the discriminator ar- ples (Chen et al., 2020). The real and fake sample’s label
chitecture have been kept the same with the attention is replaced with random numbers between 0.7 − 1 and
based study, except the discriminator has an extra sin- 0 − 0.3, respectively. After training using the loss and ac-
gle neuron output. The single neuron output along with curacy of training and validation, the model parameters
sigmoid activation is responsible for real/fake classifica- belonging to the 1167th epoch are chosen for the further
tion. The generator architecture has been decided by study. After training, the generator is detached from the
keeping in mind that the generator is able to capture network, and the discriminator is used for further anal-
the class specific feature distribution with less amount of ysis. For dst measure, the test utterances are passed
training data. Hence, instead of randomly exciting the through the discriminator with each frame shift having a
generator, the feature vectors used to train the discrimi- context of 48 frames. The linear output has been taken
nator are used to excite the generator (Chen et al., 2020). from the classifier node of the discriminator and used to
The generator architecture is an encoder-decoder archi- generate dstt and dstf as like earlier sections. The ob-
tecture, which uses gated convolutional units and pixel tained linear output is depicted in Fig. 10(c). Similarly
shufflers. The gated convolutional units (GCNN) better the discriminator’s softmax output of the classification
encodes the temporal dependency information and the node has been used to generate the ldvt and ldvf dis-
tribution for different neighborhood duration (i.e NVF-
J. Acoust. Soc. Am. / 8 March 2022 JASA-Article/LCDvsSCD 7hnd
4
eng
Log Likelihood
2 CFI
0
-2
-4
50 100 150 200 250 300
(a)
10
Linear output
0
-10
50 100 150 200 250 300
(b)
10
Linear output
5
0
-5
-10
50 100 150 200 250 300
Frame index
(c)
FIG. 10. Obtained output contour of an utterance, (a) GMM-
UBM, (b) Attention, (c) GAN.
FIG. 11. Distance distribution around true and false change
point, (a) GMM-UBM, (b) Attention, (c) GAN, and (d) CD
x). The obtained true and false distribution for both the values.
measures along with their corresponding CD values are
shown in Fig. 11(c),(d) and Fig. 12(c),(d), respectively.
The figure shows, irrespective of the analysis group
and measures, the CD values are higher for GAN based 6
6
6 6 4
models. From the box plots of true and false distribu- 4 4
4 4
tion, it can be clearly observed that, as compared to (a)
2 2 2
2
2
GMM and attention model, the positive separation be- 0 0 0
0 0
tween true and false distribution is higher in case of GAN ldv_t ldv_f ldv_t ldv_f ldv_t ldv_f ldv_t ldv_f ldv_t ldv_f
model. Therefore the use of generative strategy helps 20 20 20 20 20
to better capture the language specific information. At (b) 10 10 10 10 10
the same time the CD value increases with increase in
neighborhood duration around change point ensures bet- 0
ldv_t ldv_f
0 0 0 0
ldv_t ldv_f ldv_t ldv_f ldv_t ldv_f ldv_t ldv_f
ter change point locating ability of the model. Further 20 20
20 20 20
from Fig. 10(b) and (c), the output contours show the
significance of generative strategy to locate the language (c) 10 10 10 10 10
change point as compared to the attention based discrim- 0 0 0 0 0
ldv_t ldv_f ldv_t ldv_f ldv_t ldv_f
inative strategy. 25
ldv_t ldv_f ldv_t ldv_f
GMM-UBM 20.3
20 Attention
GAN 13.94
(d) 15
V. EXPERIMENTAL RESULTS AND DISCUSSION 10 7.24
4.45 4.43
5
1.36 1.98 1.74 3.15 2.06
This section provides a description of the conducted 0
0.85 0.58 0.91 1.14 1.31
NVF-10 NVF-20 NVF-30 NVF-50 NVF-75
LCD and SCD experiments. Followed by this, the results
will be interpreted and discussed.
FIG. 12. Distribution of likelihood deviation around true and
A. Database details false change point, (a) GMM-UBM, (b) Attention, (c) GAN
,and (d) CD values
To perform the LCD task, manually annotated a sub-
set of MUCS2021 Hindi-English dataset (SMUCS-HE)
and Microsoft code-switched challenge task-B dataset
(MSCSTB) (Diwan et al., 2021). As the study con- Tamil-English (TAE) and Telugu-English (TEE) code-
sists of both unsupervised and supervised approaches to switched utterances. Similarly, to perform the SCD task,
perform LCD tasks, the dataset is divided into training a subset of utterances from the IITG-MV-P3 dataset is
and testing sets. For SMUCS-HE 70% and 30% of ran- used (Haris et al., 2012). As each code-switched utter-
dom split has been used to generate training and testing ance is spoken by a single speaker, the occurrence of an
sets. Similarly, MSCSTB dataset consist of training and overlapped segment is highly unlikely. Therefore, the
development data partitions of Gujarati-English (GU), standard speaker diarization (SD) dataset like DIHARD,
AMI, cannot be used in this study, as the dataset con-
8 J. Acoust. Soc. Am. / 8 March 2022 JASA-Article/LCDvsSCDsists of overlapped speaker segments around the change
TABLE I. Performance of SLD and LCD task using KL di-
point. Selected subset of IITG-MV phase 3 (SIITG-MV-
vergence based approach. NOC: number of GMM clusters.
P3) data consists of two session recordings of approxi-
mately 10 − 15 minutes conversation of 4 speaker pairs.
During conversation, there exist a total 659 number of Task Database NOC IDR MR FAR IDA
speaker change points.
SMUCS-HE 1 33.7 0 66.3 0.292
MSCSTB-GE 1 33.96 9.49 56.55 0.175
B. Experimental setup for LCD and SCD task LCD
MSCSTB-TAE 1 29.89 7.81 62.3 0.174
Inspired from the literature of SCD task, initially MSCSTB-TEE 1 31.73 9.0 59.2 0.177
both LCD and SCD tasks are performed using an unsu-
pervised symmetric KL divergence based approach. Af- SCD SIITG-MV-P3 4 45.21 22.20 32.54 0.499
ter that Model based approaches, namely, (1) GMM-
UBM, (2) attention, and (3) GAN are used. All the the peaks and corresponding locations. For reducing the
studies use 39 dimensional MFCC-∆ − ∆∆ features. The false change points a threshold contour is derived from
Features are extracted from the voiced frames and have the distance contour using Eq. 6, where N is the number
frame size and frame shift of 20 msec and 10 msec, re- of previous successive distances used for predicting the
spectively. To decide upon the voiced frame, average threshold and α is the amplification factor set to 1 for
short time energy based threshold is used, whereas for this study (Lu and Zhang, 2002).
MSCSTB dataset ground truth labels for the non silence
frames are used. N
The training set is reserved for the training of su- 1 X
T h(i) = α. D(i − n − 1, i − n) (6)
pervised models. Though the unsupervised approach N n=0
does not require training data, to show fair compari-
son, only the test set of the database is used to per- After that, the detected peaks and the threshold con-
form the LCD and SCD tasks. Using the predicted and tour are compared for predicting the language / speaker
ground truth change point information, a performance change points. For LCD task, the performance is com-
measure that is generally used for event detection tasks puted in both SMUCS-HE and MSCSTB datasets. The
is used here (Murty and Yegnanarayana, 2008). The per- obtained optimal analysis window and hop length for
formance measures Identification rate (IDR), false accep- SMUCS-HE is 120 and 10, and for MSCSTB is 70 and
tance rate (FAR), miss rate (MR) and identification accu- 10 frames, respectively. Similarly, For SCD task, the per-
racy (IDA) are used to calibrate the system performance. formance is optimized with different analysis window and
In case of model based approaches, the procedure hop length. The obtained optimal analysis window and
that was followed in our previous work (Mishra et al., hop length is 120 and 10 frames, respectively. The per-
2021) is used here to predict the change points from the formance for both LCD and SCD task are reported in
output contour. A Gaussian smoothing with appropri- Table I.
ate optimal window duration is used to smooth the out- From Table I, it can be observed that the perfor-
put contour of the given test utterance. After that the mance of SCD task is better than the performance of
smoothed contour is used to predict the change point. LCD task. As discussed in section III, the unsuper-
vised approach fails to appropriately detect the language
1. Unsupervised distance based approach change points due to the unavailability of short term
spectro-temporal cues. This suggests the requirement of
As mentioned in (Moattar and Homayounpour, 2012; higher level of information for capturing language specific
Park et al., 2022; Tranter and Reynolds, 2006), similar phonemic variation, to appropriately detect the language
framework is used here to derive the evidence contour for change points.
both LCD and SCD tasks. For a fixed duration of analy-
sis window, the feature vectors from the two consecutive 2. GMM-UBM based approach
analysis windows are modeled using two different GMMs
(gi and gj ), and the divergence distance (D) between the The UBM model is trained for each language
two Gaussian is computed using Eq. 5, where i and j are pair, using the training set. The ground truth la-
the analysis window index, ranging from 1 ≤ i ≤ L − 1 bels are used to separate the frames belonging to L1
and 2 ≤ j ≤ L and L is the number of possible analysis (Hindi/Gujarati/Tamil/Telugu) language and L2 (En-
window for an utterance. glish). The MFCC feature vectors belonging to the sep-
arated L1 and L2 frames are used to train the adapta-
D(i, j) = KL(gi |gj ) + KL(gj |gi ), (5) tion models. To decide on the optimal cluster size of the
GMM model, a language identification (LID) task is per-
The entire scan of a test utterance through the con- formed. The MFCC features belonging to both L1 and
secutive analysis window will provide a distance based L2 frames of each test utterance are extracted using their
evidence contour (D). A peak picking algorithm (from ground truth label. Utterance wise all the frames belong-
MATLAB) is used on the distance contour to find out ing to L1 and L2 are concatenated to form L1-segment
J. Acoust. Soc. Am. / 8 March 2022 JASA-Article/LCDvsSCD 9and L2-segment respectively. The L1-segments and L2-
TABLE II. Performance of SLCD task using GMM-UBM
segments are used for LID testing. For SMUCS-HE
based approach, Win-dur: in number of frames, M1: GMM-
dataset, 256 cluster size is found to be optimal, whereas
for MSCSTB dataset, cluster size of 1024, 512 and 1024 UBM, M2: Attention and M3: GAN.
is found to be optimal for GU, TAE and TEE language
pairs, respectively. The UBM and adapted models with
Database Model Win-dur IDR MR FAR IDA
optimal clusters are used to extract the likelihood con-
tour for each test utterance. The likelihood contour of M1 73 87.9 0 12.1 0.093
each test utterance is used as output contour to predict SMUCS-HE M2 59 89.5 2.1 8.4 0.161
the change points. The predicted change points are then M3 69 92.6 0 7.37 0.103
compared with the ground truth change points and are
M1 80 39.70 32.8 27.7 0.269
tabulated in Table II.
MSCSTB-GE M2 119 46.23 38.94 14.83 0.360
3. Attention based approach M3 113 48.05 36.45 15.50 0.364
M2 100 33.60 44.24 22.16 0.286
As mentioned in section IV B, the same architecture
and procedures has been used here to train the atten- MSCSTB-TAE M2 133 48.03 36.0 15.97 0.402
tion based neural network. In the MSCSTB dataset, the M3 139 48.71 36.75 14.54 0.398
extracted L1 and L2 feature vectors are highly imbal- M2 95 40.77 37.8 21.43 0.294
anced (i.e. 80 − 20%). Hence to avoid overfitting to-
MSCSTB-TEE M2 125 46.57 37.83 15.59 0.396
wards a single class, a weighted cross-entropy loss and a
dropout of 0.2 have been used in layer 2, 3, 4 and 7. Other M3 141 47.38 40.38 12.24 0.404
training parameters are kept the same as mentioned in
section IV B. In the MSCSTB dataset, each pair of lan-
guages (i.e GE, TAE and TEE) are used to separately
train each model for 100 epochs. The l1-segment and
l2-segment of each utterance is used as a development
set. During training, along with validation loss, language
identification error is computed with each epoch. After
training, the optimal model is selected by comparing both
the validation loss and language identification error. For
the GE language pair, out of 100 models, the model be-
longing to the 7th epoch is selected. Similarly, for TAE
and TEE language pairs, the model belonging to 8th and
9th epoch is selected for language change study. The test
utterances are passed through the network and the lin-
ear output from the output node is extracted and used as
output contour. The output contour of each utterance is
used to predict the language change points. The ground
truth and predicted change points are compared and are
tabulated in Table II.
4. GAN based approach
The same architecture and training procedure as FIG. 13. Performance comparison with model based ap-
mentioned in section IV C is used here to train the net- proaches for SLCD task (a): IDR, (b): MR, (c): FAR, (d):
work. For MSCSTB dataset, as the training data is IDA
highly imbalanced, to avoid overfitting, weighted cross
entropy loss and with dropout of 0.2 for layer 2, 3, 4 and
7 is used to train the discriminator. To train the gen- selected for language change study. For each test utter-
erator of GAN, for stabilizing the training, initially the ance, the output contour is extracted from the linear out-
generator is warmed up with Huber loss for 50 epochs. put layer of the discriminator, and then used to predict
After that the generator and discriminator have been si- the language change points. After that, the predicted
multaneously trained for 100 epochs. The optimal model and ground truth change points are compared and the
is selected by observing both the validation loss and lan- performance is tabulated in Table II
guage identification error. For the GE language pair,
out of 100 models, the discriminator model belonging to
C. Discussion
8th epoch is selected for language change study. Simi-
larly, for TAE and TEE language pairs, the discrimina- The experimental results are tabulated in Table II
tor models belonging to 49th and 48th epoch have been and depicted in Fig. 13. From the Table and Fig. 13(a-
10 J. Acoust. Soc. Am. / 8 March 2022 JASA-Article/LCDvsSCDSimilarly, the language change point prediction de-
TABLE III. Performance in terms of frame error rate (FER)
pends on the window length parameter. Whereas there
is no constraint on the monolingual segment duration of
a code-switched utterance. The depicted performances
Database GMM-UBM Attention GAN
are for the optimal window length. The optimal window
SMUCS-HE 25.6 8.4 6.8 length is chosen greedily, by varying the window duration
MSCSTB-GE 39.7 38.72 36.45 from 3 to 150 frames. For model based approaches, irre-
MSCSTB-TAE 42.38 38.61 33.46 spective of the dataset and approach, the optimal window
duration is more than 80 leads to smoothing the output
MSCSTB-TEE 41.39 39.2 32.31 contour. Thus the small monolingual segment (which are
less than 80 voiced frames) switching has been missed
c), it can be observed that incorporating more and more during change point prediction. This we can observe in
evidence that human use for language discrimination to the Fig. 13(b). This shows, though there exists an im-
the computational model, the IDR value increases by de- provement in IDR, the MR has not been reduced com-
creasing the MR and FAR values, irrespective of the paratively. Mostly the improvement in IDR is due to the
database. We can also observe that, for SMUCS-HE reduction of FAR values (Fig 13(c)). Also due to the high
dataset, there exist a significant improvement (i.e. from value of window duration, the detected change point will
33.7% to 87.9%) in the IDR value. This shows the effec- occur with a high delay with respect to the ground truth
tiveness incorporating prior language specific knowledge change point). From Fig 13(d) it can be observed that
in terms of GMM-UBM model. After that incorporating the IDA values increase with increase in optimal window
temporal learning strategy in terms of attention, a far- duration. In the future, our aim is to explore the change
ther level of improvement has been achieved (i.e. from point detection approach, which is independent of win-
87.9% to 89.5%). As like human, the generative patterns dow duration.
have been stored and during language change, the same
information is used to detect the change. Invoking the VI. CONCLUSION
same, GAN strategy has been used, where the generator
helps to the discriminator to better learn the language In this work, we performed a comparative analysis on
specific temporal evidence. From the figure it can also speaker and language change detection. From the sub-
be observed that, incorporating GAN strategy the per- jective study it has been observed that humans require
formance in terms IDR increase from 89.5% to 92.6%. comparatively larger neighborhood information around
For MSCSTB dataset, though there exists a trend the change point to detect language than speaker. From
of performance improvement, as per our initial hypoth- the objective study, it has been observed that it is diffi-
esis, but the achieved performance is faraway from the cult to locate the language change even after considering
performance achieved in SMUCS-HE dataset. This is approximately 2.25 seconds of information around the
happening may be due to two reasons: (1) unbalanced change point, using an unsupervised distance based ap-
train data, (2) window based smoothing approach. The proach. After that the model based approaches namely,
SMUCS-HE dataset is manually annotated and the se- GMM-UBM, attention and GAN based approach have
lected segment used for this study has approximately been explored. It is observed that using supervised model
equal number of syllables on either side of the change based approaches, it is feasible to locate the language
point. This may be the reason for achieving expected change. Also, the performance of LCD task improves by
results in the SMUCS-HE dataset, whereas MSCSTB is including temporal information through attention based
a more practical dataset. The MSCSTB dataset has ap- framework and capturing language specific generative in-
proximately 80% frames belonging to L1 language and formation through GAN framework.
the rest 20% to L2 language. This poses a challenge to- In future, we plan to explore and resolve the issues
wards training of neural network models. Though we related to relatively low performance in case of practi-
have used weighted loss and drop out to avoid overfit- cal dataset, by coming up with alternative strategies to
ting towards L1 language class, still the problem persists. train the supervised model with unbalanced data. Also
This can be better understood from the tabulated LID alternative approaches to predict change points which are
performance in terms of frame error rate. independent of window duration.
From Table III, it can be observed that there exists
a significant reduction in FER values (i.e. from 25.6% to
8.6%) from GMM-UBM approach to attention approach. 1 Supplementary materials for the data generation of language and
Whereas in all three language pairs of MSCSTB dataset, speaker change detection by human at [URL will be inserted by
AIP]
fails to achieve the same amount of reduction in FER
value. For a practical code-switching data, data imbal- Ambikairajah, E., Li, H., Wang, L., Yin, B., and Sethu, V. (2011).
ance seems to be a challenge to train the supervised mod- “Language identification: A tutorial,” IEEE Circuits and Sys-
els. Thus in our future exploration we will try to resolve tems Magazine 11(2), 82–108.
Chan, J. Y., Ching, P., Lee, T., and Meng, H. M. (2004). “De-
this issue. tection of language boundary in code-switching utterances by bi-
phone probabilities,” in 2004 International Symposium on Chi-
J. Acoust. Soc. Am. / 8 March 2022 JASA-Article/LCDvsSCD 11nese Spoken Language Processing, IEEE, pp. 293–296. Richardson, F., Reynolds, D., and Dehak, N. (2015). “Deep neural Chen, L., Liu, Y., Xiao, W., Wang, Y., and Xie, H. (2020). “Speak- network approaches to speaker and language recognition,” IEEE ergan: Speaker identification with conditional generative adver- signal processing letters 22(10), 1671–1675. sarial network,” Neurocomputing 418, 211–220. Ryant, N., Church, K., Cieri, C., Cristia, A., Du, J., Ganapathy, Chen, S., Gopalakrishnan, P. et al. (1998). “Speaker, environment S., and Liberman, M. (2018). “First dihard challenge evaluation and channel change detection and clustering via the bayesian plan,” 2018, tech. Rep. . information criterion,” in Proc. DARPA broadcast news tran- Sharma, N. K., Ganesh, S., Ganapathy, S., and Holt, L. L. (2019). scription and understanding workshop, Virginia, USA, Vol. 8, “Talker change detection: A comparison of human and machine pp. 127–132. performance,” The Journal of the Acoustical Society of America Cruttenden, A. (2014). Gimson’s Pronunciation of English 145(1), 131–142. (Taylor & Francis), https://books.google.co.in/books?id= Shen, P., Lu, X., Li, S., and Kawai, H. (2017). “Conditional gen- M2nMAgAAQBAJ. erative adversarial nets classifier for spoken language identifica- Dawalatabad, N., Madikeri, S., Sekhar, C. C., and Murthy, H. A. tion.,” in Interspeech, pp. 2814–2818. (2020). “Novel architectures for unsupervised information bot- Siddhartha, S., Mishra, J., and Prasanna, S. R. M. (2020). “Lan- tleneck based speaker diarization of meetings,” IEEE/ACM guage specific information from LP residual signal using linear Transactions on Audio, Speech, and Language Processing 29, sub band filters,” in 2020 National Conference on Communica- 14–27. tions (NCC), IEEE, pp. 1–5. Diwan, A., Vaideeswaran, R., Shah, S., Singh, A., Raghavan, S., Siegler, M. A., Jain, U., Raj, B., and Stern, R. M. (1997). “Au- Khare, S., Unni, V., Vyas, S., Rajpuria, A., Yarra, C., Mittal, tomatic segmentation, classification and clustering of broadcast A., Ghosh, P. K., Jyothi, P., Bali, K., Seshadri, V., Sitaram, S., news audio,” in Proc. DARPA speech recognition workshop, Vol. Bharadwaj, S., Nanavati, J., Nanavati, R., Sankaranarayanan, 1997. K., Seeram, T., and Abraham, B. (2021). “Multilingual and Sitaram, S., Chandu, K. R., Rallabandi, S. K., and Black, A. W. code-switching asr challenges for low resource indian languages,” (2019). “A survey of code switching speech and language pro- Proceedings of Interspeech . cessing,” arXiv:1904.00784 [cs.CL] . Gish, H., Siu, M.-H., and Rohlicek, J. R. (1991). “Segregation of Snyder, D., Garcia-Romero, D., McCree, A., Sell, G., Povey, D., speakers for speech recognition and speaker identification.,” in and Khudanpur, S. (2018). “Spoken language recognition using icassp, Vol. 91, pp. 873–876. x-vectors.,” in Odyssey, pp. 105–111. Goodfellow, I. (2016). “Nips 2016 tutorial: Generative adversarial Spoorthy, V., Thenkanidiyoor, V., and Dinesh, D. A. (2018). networks,” arXiv preprint arXiv:1701.00160 . “SVM Based Language Diarization for Code-Switched Bilingual Haris, B. C., Pradhan, G., Misra, A., Prasanna, S., Das, R. K., and Indian Speech Using Bottleneck Features,” in Proc. The 6th Sinha, R. (2012). “Multivariability speaker recognition database Intl. Workshop on Spoken Language Technologies for Under- in indian scenario,” International Journal of Speech Technology Resourced Languages, pp. 132–136, http://dx.doi.org/10. 15(4), 441–453. 21437/SLTU.2018-28, doi: 10.21437/SLTU.2018-28. Hart, P. E., Stork, D. G., and Duda, R. O. (2000). Pattern classi- Tranter, S. E., and Reynolds, D. A. (2006). “An overview of auto- fication (Wiley Hoboken). matic speaker diarization systems,” IEEE Transactions on audio, Li, H., Ma, B., and Lee, K. A. (2013). “Spoken language recogni- speech, and language processing 14(5), 1557–1565. tion: from fundamentals to practice,” Proceedings of the IEEE Wong, E., and Sridharan, S. (2002). “Methods to improve gaussian 101(5), 1136–1159. mixture model based language identification system,” in Seventh Liu, H., Perera, L. P. G., Zhang, X., Dauwels, J., Khong, A. W., International Conference on Spoken Language Processing. Khudanpur, S., and Styles, S. J. (2021). “End-to-end language Zhang, H. J. (2013). “Code-switching speech detection method by diarization for bilingual code-switching speech,” in 22nd Annual combination of language and acoustic information,” in Advanced Conference of the International Speech Communication Associ- Materials Research, Trans Tech Publ, Vol. 756, pp. 3622–3627. ation, INTERSPEECH 2021, International Speech Communica- tion Association, Vol. 2. Lu, L., and Zhang, H.-J. (2002). “Speaker change detection and tracking in real-time news broadcasting analysis,” in Proceedings of the tenth ACM international conference on Multimedia, pp. 602–610. Lyu, D. C., Chng, E. S., and Li, H. (2013). “Language diarization for conversational code-switch speech with pronunciation dictio- nary adaptation,” in Signal and Information Processing (Chi- naSIP), 2013 IEEE China Summit and International Confer- ence on, IEEE, pp. 147–150. Mishra, J., Agarwal, A., and Prasanna, S. M. (2021). “Spoken language diarization using an attention based neural network,” in 2021 National Conference on Communications (NCC), IEEE, pp. 1–6. Moattar, M. H., and Homayounpour, M. M. (2012). “A review on speaker diarization systems and approaches,” Speech Communi- cation 54(10), 1065–1103. Murty, K. S. R., and Yegnanarayana, B. (2008). “Epoch extraction from speech signals,” IEEE Transactions on Audio, Speech, and Language Processing 16(8), 1602–1613. Park, T. J., Kanda, N., Dimitriadis, D., Han, K. J., Watanabe, S., and Narayanan, S. (2022). “A review of speaker diarization: Recent advances with deep learning,” Computer Speech & Lan- guage 72, 101317. Rabiner, L. R. (1978). Digital processing of speech signals (Pearson Education India). Raffel, C., and Ellis, D. P. (2015). “Feed-forward networks with attention can solve some long-term memory problems,” arXiv preprint arXiv:1512.08756 . Reynolds, D. A. (1995). “Speaker identification and verification using gaussian mixture speaker models,” Speech communication 17(1-2), 91–108. 12 J. Acoust. Soc. Am. / 8 March 2022 JASA-Article/LCDvsSCD
You can also read