Direct evidence of proximal tubular proliferation in early diabetic nephropathy
←
→
Page content transcription
If your browser does not render page correctly, please read the page content below
www.nature.com/scientificreports
OPEN Direct evidence of proximal tubular
proliferation in early diabetic
nephropathy
Noriko Uehara‑Watanabe1, Natsuko Okuno‑Ozeki1, Atsushi Minamida1, Itaru Nakamura1,
Tomohiro Nakata1, Kunihiro Nakai1, Aya Yagi‑Tomita1, Tomoharu Ida1, Kisho Ikeda1,
Takashi Kitani1, Noriyuki Yamashita1, Michitsugu Kamezaki1, Yuhei Kirita1, Satoaki Matoba2,
Keiichi Tamagaki1 & Tetsuro Kusaba1*
Kidney hypertrophy is a common clinical feature in patients with diabetes and is associated with
poor renal outcomes. Initial cell proliferation followed by cellular hypertrophy are considered the
responsible mechanisms for diabetic kidney hypertrophy. However, whether similar responses
against hyperglycemia continue in the chronic phase in diabetes is unclear. We performed lineage
tracing analysis of proximal tubular epithelia using novel type 2 diabetic mice with a tamoxifen-
inducible proximal tubule-specific fluorescent reporter. Clonal analysis of proximal tubular epithelia
demonstrated that the labeled epithelia proliferated in type 2 diabetic mice. Based on the histological
analysis and protein/DNA ratio of sorted labeled tubular epithelia, there was no evidence of cellular
hypertrophy in type 2 diabetic mice. Lineage tracing and histological analyses of streptozocin-induced
type 1 diabetes also revealed that cellular proliferation occurs in the chronic phase of type 1 diabetes
induction. According to our study, epithelial proliferation accompanied by SGLT2 upregulation, rather
than cellular hypertrophy, predominantly occurs in the hypertrophic kidney in both type 1 and type
2 diabetes. An increased number of SGLT2+ tubular epithelia may be an adaptive response against
hyperglycemia, and linked to the hyper-reabsorption of sodium and glucose observed in type 2
diabetes patients.
Kidney hypertrophy is a common clinical feature in patients with diabetes. Kidney size has been linked to the
poor outcomes of diabetic nephropathy in both type 1 and type 2 d iabetes1–3. Renal hypertrophy primarily
occurs in the cortex of a diabetic k idney4, and is thought to increase the expression of tubular transporter and
subsequent hyper-reabsorption5,6.
The mechanisms of kidney growth have been investigated using an experimental streptozocin(STZ)-induced
type 1 diabetes model6. The growth of proximal tubular epithelia in response to hyperglycemic stimulus is a
multistep process, i.e. initial proliferation and subsequent cellular h ypertrophy5–8. Many molecular mechanisms
are involved in this process, including hyperglycemia-induced oxidative stress, increases in growth factors, such
as insulin growth factor 1 (IGF-1) and epidermal growth factor (EGF), and activation of renin-angiotensin
systems4. Subsequently, cell cycle arrest in the G1 phase occurs through p27Kip1 induction, leading to cellular
hypertrophy7. In the experimental STZ-induced type 1 diabetes model, this process occurs within several days
after the onset of h yperglycemia7. However, due to a lack of studies, whether these processes occur in type 2
diabetes is unclear.
Regarding the STZ-induced diabetes model, which has been mostly used in the previous experiments for
kidney growth, the cytotoxic effects of STZ are one of the major concerns surrounding the assessment of tubular
epithelial behavior in vivo9. In rodent experiments, STZ is usually used for generating type 1 diabetes rodent
models through its cytotoxic effects on the pancreatic beta c ells10. STZ also induces proximal tubular epithelial
injury in vivo in a dose-dependent manner and reduces membrane transporter expression, which occurs inde-
pendent of blood glucose v alues9,11. As cell cycle arrest is one of the major phenotypes of injured renal tubular
epithelia12, it is possible that the cell cycle arrest in tubular epithelia after STZ administration is induced by its
cytotoxic effects.
1
Department of Nephrology, Graduate School of Medical Science, Kyoto Prefectural University of Medicine, 465
Kajii‑cho, Kamigyo‑ku, Kyoto 602‑8566, Japan. 2Department of Cardiovascular Medicine, Graduate School of
Medical Science, Kyoto Prefectural University of Medicine, Kyoto, Japan. *email: kusaba@koto.kpu-m.ac.jp
Scientific Reports | (2022) 12:778 | https://doi.org/10.1038/s41598-022-04880-1 1
Vol.:(0123456789)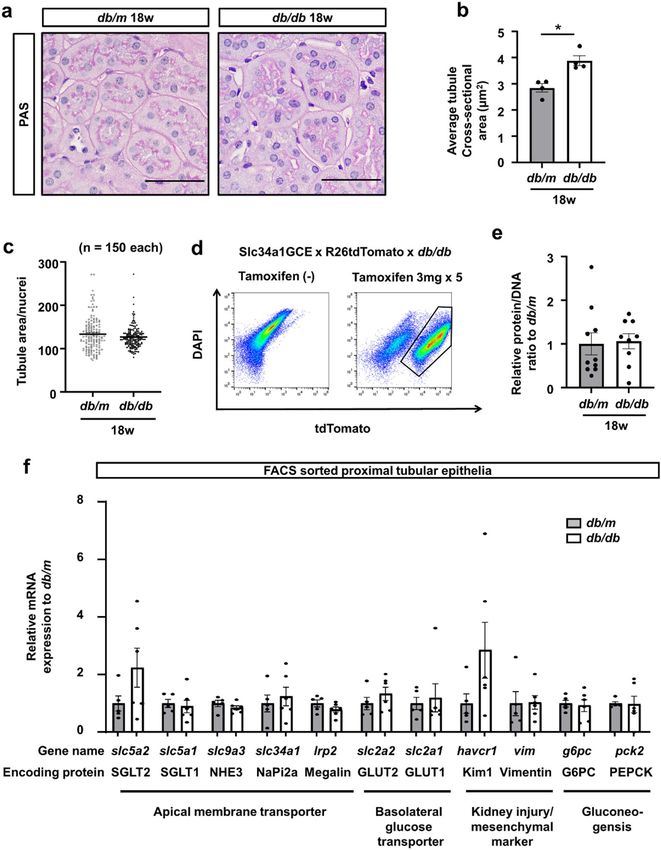
www.nature.com/scientificreports/
For evaluating or visualizing cell division, especially in acute kidney injury, immunostaining of markers or
labeling of proliferating cells by thymidine analogs are common experimental methods. However, these strate-
gies are not sufficient for clearly demonstrating cell division in cells with a slower turnover, which is a major
problem for visualizing the effects of cell proliferation on kidney growth in type 2 diabetes. Instead, to elucidate
the molecular response against hyperglycemic stimuli, in vitro experiments using tubular epithelial cell lines have
been applied. However, the phenotypes of tubular epithelia, including cell polarity and expression of membrane
transporters, which are essential for determining cellular responses against stimuli in vivo, are lost in culture
conditions13. In addition, unlike physiological conditions in the normal kidney, cultured tubular epithelia actively
proliferate, making it difficult to mimic the diabetic condition in vitro.
In order to overcome these limitations and to directly address the roles of cellular proliferation and hypertro-
phy in the diabetic kidney in vivo, we performed lineage tracing analysis of terminally differentiated proximal
tubular epithelia. Genetic lineage tracing is a powerful experimental method to understand the cell fate under
different disease conditions and enables tracking of the progeny of labeled cell populations14,15. We generated
type 2 diabetic model mice with a tamoxifen-inducible tdTomato reporter in terminally differentiated proximal
tubular epithelial cells, and analyzed the behavior of this population under hyperglycemic conditions. In addition,
we examined the molecular changes in sorted tubular epithelia in diabetic mice by flow cytometry.
Results
Generation of type 2 diabetic mice with a proximal tubule reporter. In order to investigate the
proximal tubule-specific phenotypes in diabetic mice, we generated type 2 diabetic mice with a proximal tubule-
specific reporter. We crossed db/m mice with mice carrying a proximal tubule-specific tamoxifen-inducible Cre
(SLC34a1GCE) and the tdTomato reporter (R26tdTomato). In this transgenic mouse line, proximal tubules were
exclusively labeled by tdTomato after tamoxifen injection16. After multiple injections of tamoxifen to label the
proximal tubular epithelia at 6 weeks, the male mice were used for experiments (Fig. 1a). The body weights
increased in both db/m and db/db mice during the observation period, but those in db/db mice significantly
increased at 18 weeks (Fig. 1b). The blood glucose levels started to increase at 8 weeks in db/db mice, whereas
those in db/m mice remained stable at around 100 mg/dl during the experimental period (Fig. 1c). Urinary
albumin excretion was significantly higher in db/db mice (Fig. 1d). Kidney weight adjusted by tibia length was
significantly higher in 18-week-old db/db mice (Fig. 1e).
Regarding kidney histology, the cross-sectional kidney area was significantly larger in db/db mice (Fig. 1f,g),
which was due to expansion of the cortical area (Fig. 1h), not the medullary area (Fig. 1i). We also evaluated the
glomerular area and found that glomeruli were much larger in db/db mice (Supplemental Fig. 1a,b), reflecting
glomerular hyperfiltration.
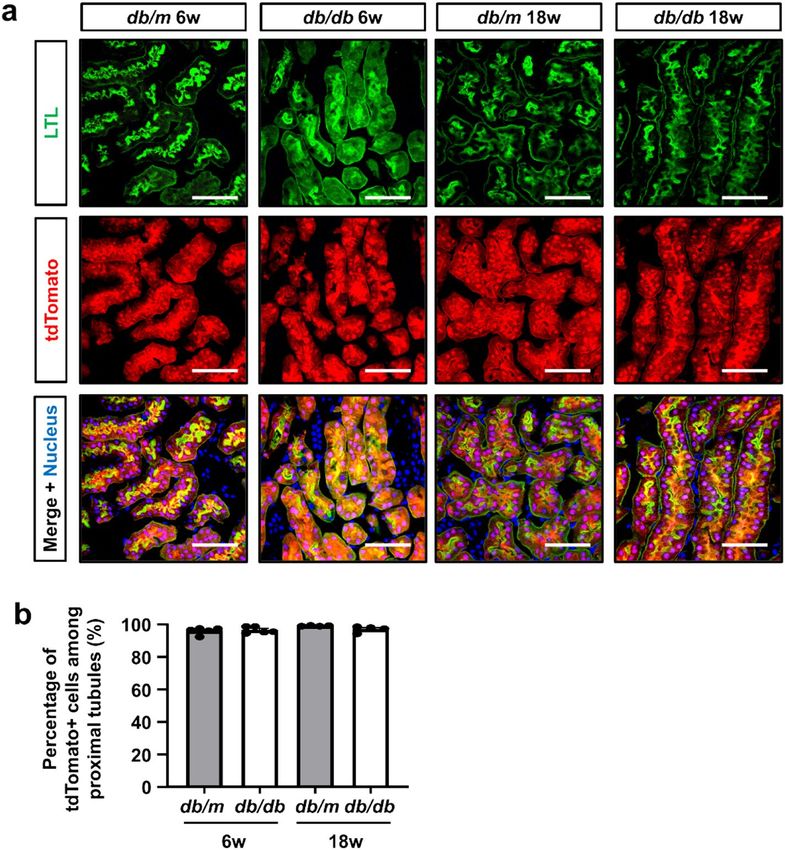
We next assessed the Cre-mediated recombination efficiency in newly generated diabetic mice with the
proximal tubular epithelial reporter. In all mice groups, tdTomato+ cells were never found outside the proximal
tubules. At 6 weeks of age, approximately 90% of cortical proximal tubular epithelial cells were labeled by tdTo-
mato in both db/m and db/db mice (Fig. 2a). At 18 weeks of age, the percentages of labeled cells among proximal
tubular epithelia were similar in both db/m and db/db mice, and there was no dilution of labeling frequency
in 18-week-old db/db mice (Fig. 2b). Thus, cells from outside the tubules played no role in hypertrophy in the
diabetic kidney.
No evidence of epithelial cellular hypertrophy in db/db mice. We further calculated the average
cross-sectional area of circular shaped proximal tubules (arbitrarily defined as minor/major axis > 0.8, Supple-
mental Fig. 2a,b) and found that the proximal tubules were enlarged in db/db mice (Fig. 3a,b). We measured
the size of a single cell by calculating the ratio of the tubular area to the number of nuclei in circular proximal
tubules on PAS staining, reflecting the occupied tubular area in each cell. The tubular area/nucleus ratio was not
different between db/m and db/db mice (Fig. 3c). In order to further confirm that there was no cellular hypertro-
phy in proximal tubular epithelia in the diabetic kidney and to specifically analyze the phenotypes of proximal
tubular epithelia, we collected the tdTomato+ tubular epithelia by fluorescence-activated cell sorting (FACS),
and RNA and protein were extracted for further analysis (Fig. 3d). The protein/DNA ratio of isolated tdTomato+
epithelia, a marker of cellular hypertrophy, was not different between db/m and db/db (Fig. 3e). qPCR of isolated
tubular epithelia demonstrated the RNA expression of slc5a2, encoding SGLT2, to be slightly higher in db/db
mice, whereas that of proximal tubule-specific apical membrane transporters, such as slc34a1 and lrp2, was not
upregulated in db/db mice (Fig. 3f). Regarding slc2a2 and slc2a1, basolateral glucose transporters, there were
no differences between db/m and db/db mice (Fig. 3f). Havcr1, a kidney injury marker, was slightly upregulated
in db/db mice; however, vim, a mesenchymal marker indicating the epithelial mesenchymal transition, was not
upregulated in db/db mice (Fig. 3f). Western blot analysis using isolated tubular epithelia by FACS demonstrated
the SGLT2 protein expression to be slightly higher in db/db mice (Supplementary Fig. S3a,b).
Clonal analysis of proximal tubular epithelial cells in db/db mice. In order to directly demonstrate
epithelial proliferation in the diabetic kidney, we next performed in vivo clonal analysis of terminally differen-
tiated proximal tubular epithelial cells. We performed sparse labeling by low-dose tamoxifen (0.05 mg) injec-
tion to generate single cell clones and sacrificed the male mice 12 weeks later (Fig. 4a). Approximately 80% of
tdTomato+ cells were SGLT2+ in both db/m and db/db mice (Fig. 4b,c). tdTomato+ clones expanded in db/db
mice, confirming active epithelial cell proliferation during the experimental period (Fig. 4b). The clone size was
slightly larger in db/db mice (Fig. 4b,d). The average cell number per clone in each kidney was also greater in db/
db mice (Fig. 4e). We further analyzed the clone size with/without SGLT2 expression separately. The clone size
and average clone size of SGLT2+ epithelia were larger in db/db mice (Supplementary Fig. S4a,b); however, those
Scientific Reports | (2022) 12:778 | https://doi.org/10.1038/s41598-022-04880-1 2
Vol:.(1234567890)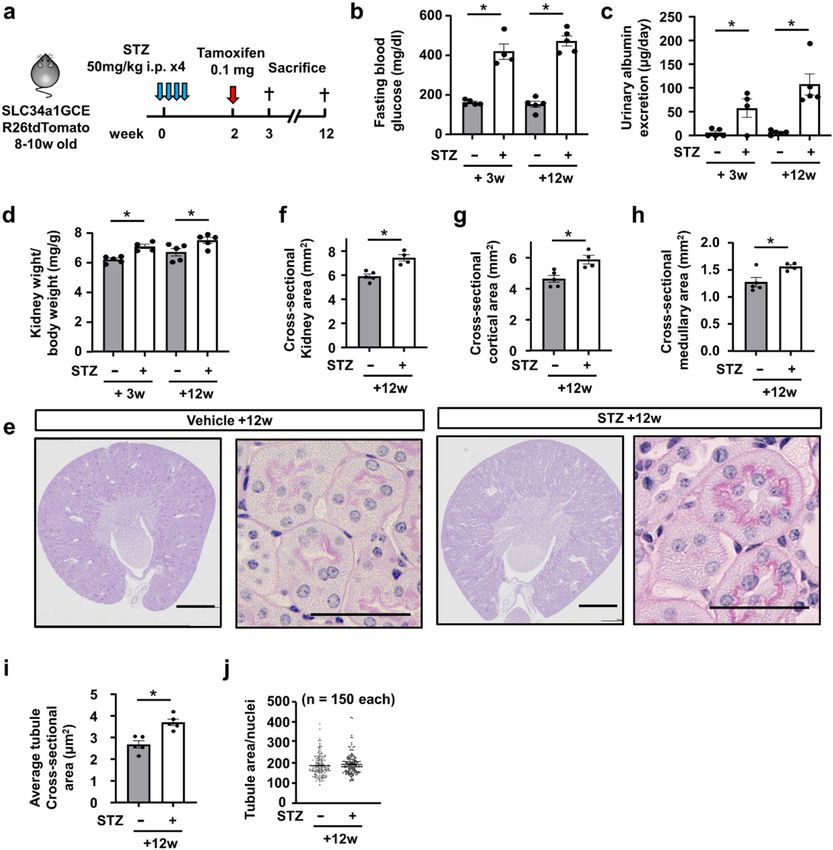
www.nature.com/scientificreports/

                                 Figure 1.  Kidney growth in db/db mice. (a) Experimental protocol. High-dose tamoxifen was injected 5 times
                                 into 6-week-old trigenic SLC34a1GFPCreERT2 (SLC34a1GCE), Rosa26-tdTomato (R26tdTomato), and db/db
                                 mice. Trigenic mice with SLC34a1GCE, R26tdTomato, and db/m were used as the non-diabetic control. (b,c)
                                 Fasting blood glucose and body weight were higher in db/db mice than in db/m mice at 18 weeks. (d) Urinary
                                 albumin excretion was higher in db/db mice than in db/m mice at 18 weeks. (e) Kidney weight/tibia length
                                 significantly increased in db/db mice at 18 weeks. (f) Representative PAS staining of kidney sections. (g–i) The
                                 cross-sectional kidney area (g) was larger in db/db mice at 18 weeks, especially in the cortex (h), but not in the
                                 medulla (i). N = 4–5 mice in each group. For all groups, data are means ± SEM, *p < 0.05, Bar = 1 mm in (f).

                                 of SGLT2- epithelia were not different between db/m and db/db mice (Supplementary Fig. S4c,d). To confirm
                                 the molecular response of cell proliferation in tubular epithelia, we evaluated the RNA expression of cell cycle
                                 regulatory molecules associated with the G1/S phase, including pcna and fen1, and the G2/M phase, including
                                 cdk1 and top2a17,18, using tdTomato+ epithelia isolated by FACS, as shown in Fig. 2. The expression of these cell
                                 cycle related molecules was slightly higher in db/db mice, especially top2a (Fig. 4f). We next examined the tissue
                                 ATP content as a consequence of hyper-reabsorption of glucose and sodium through the increase in the number
                                 of SGLT2-expressing cells under diabetic conditions, and found that ATP content significantly decreased in
                                 db/db mice (Fig. 4g). Overall, our lineage tracing analyses demonstrated that cellular proliferation, not cellular
                                 hypertrophy, is responsible for the development of diabetic kidney hypertrophy in the chronic phase.

Scientific Reports |   (2022) 12:778 |                https://doi.org/10.1038/s41598-022-04880-1                                                      3

                                                                                                                                              Vol.:(0123456789)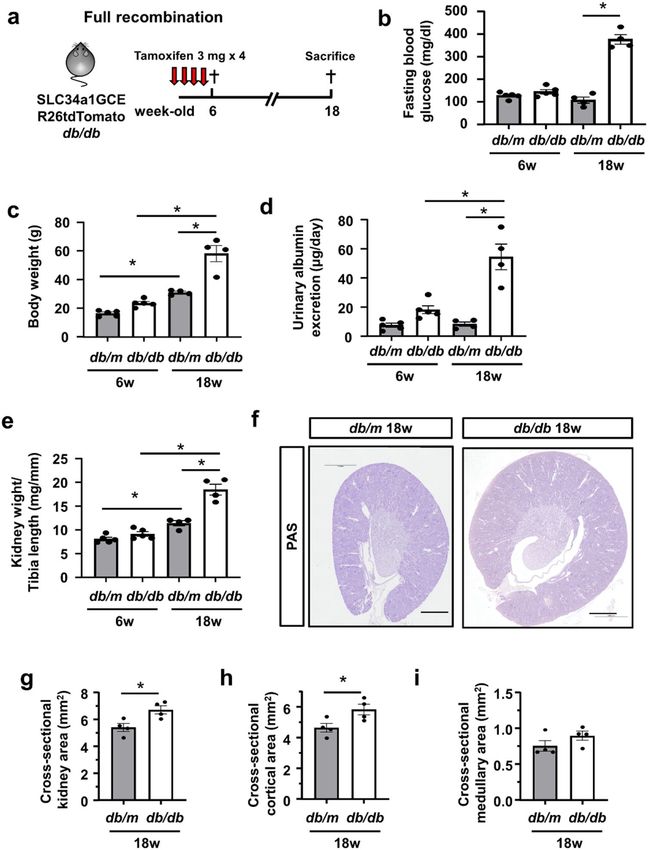
www.nature.com/scientificreports/
Figure 2. No participation of cells of extratubular origin in proximal tubules of db/db mice. (a) Representative
images of fluorescence of LTL and tdTomato in kidney sections. Bar = 50 μm. (b) Quantification of the
percentage of tdTomato+ cells among LTL + cells. There was no dilution of labeling of the tdTomato reporter in
proximal tubules of db/db mice.
Kidney growth in STZ‑induced type 1 diabetic mice. Based on the previous reports of a poor renal
prognosis in type 1 diabetic patients with renal hypertrophy1, we examined whether tubular epithelial prolifera-
tion also led to kidney enlargement in the STZ-induced type 1 diabetic model mice. We injected low-dose STZ
(40 mg/kg) or vehicle into bigenic male mice carrying SLC34a1GCE and R26tdTomato 5 times. After recovery
from STZ-induced acute kidney injury, we performed sparse labeling by low-dose tamoxifen injection to gener-
ate single-cell clones 2 weeks after the last STZ injection and sacrificed the mice 12 weeks later (Fig. 5a). Fasting
blood glucose significantly increased in STZ-treated mice (Fig. 5b). The amount of urinary albumin excretion
and kidney weight adjusted by body weight were significantly higher in STZ-treated mice (Fig. 5c,d). Regarding
kidney histology, the cross-sectional kidney area was significantly larger in STZ-treated mice (Fig. 5e,f), which
was due to expansion of the cortical area (Fig. 5g) and medullary area (Fig. 5h). We further calculated the aver-
age cross-sectional area of proximal tubules and found that the proximal tubules increased in size in STZ-treated
mice (Fig. 5e, 5i). The tubular area/nucleus ratio was not different between the groups (Fig. 5j). We also evaluated
the glomerular area and found that glomeruli were larger in STZ-treated mice (Supplemental Fig. S5a,b).
Clonal analysis of proximal tubular epithelial cells in STZ‑induced type 1 diabetic mice. In
vivo clonal analysis of terminally differentiated proximal tubular epithelial cells revealed that tdTomato+ clones
expanded in STZ-treated mice, reflecting active epithelial cell proliferation during the experimental period
(Fig. 6a). In STZ-treated mice, the percentage of single-cell clones was lower and that of multiple-cell clones was
larger than in vehicle-treated mice (Fig. 6b). The average cell number per clone in each kidney was also larger
in STZ-treated mice than in vehicle-treated mice, whereas there was no difference in the initial phase (Fig. 6c).
Thus, cell proliferation rather than cellular hypertrophy plays a major role in kidney enlargement in type 1 dia-
betes.
Scientific Reports | (2022) 12:778 | https://doi.org/10.1038/s41598-022-04880-1 4
Vol:.(1234567890)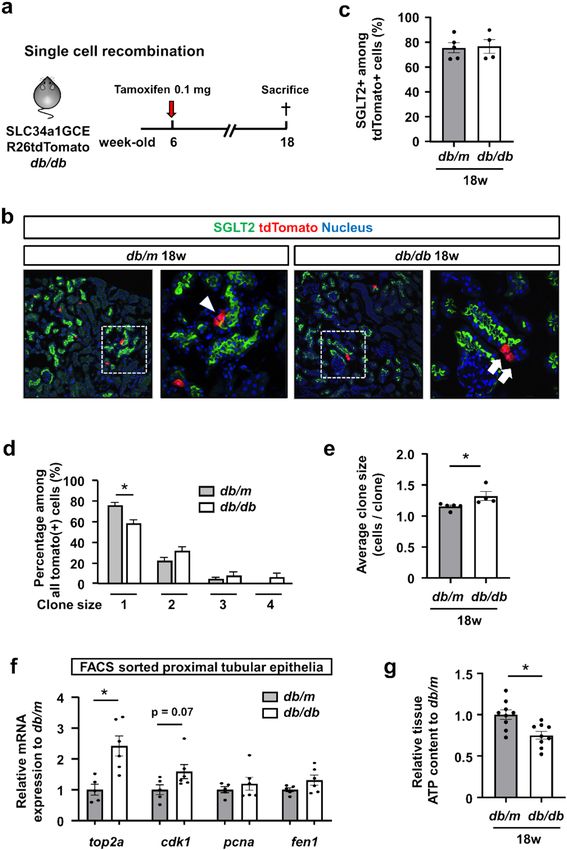
www.nature.com/scientificreports/

                                 Figure 3.  No evidence of cellular hypertrophy in proximal tubules of db/db mice. (a) Representative PAS
                                 staining of proximal tubules. (b) The average cross-sectional area of proximal tubules was larger in db/db mice at
                                 18 weeks. (c) The ratio of tubular area to nuclei number in circular proximal tubules was calculated as a marker
                                 of single-cell size. There was no difference in cell size of proximal tubular epithelia between db/db and db/m
                                 mice. (d) Isolation of tdTomato+ tubular epithelial cells using FACS as described in the experimental scheme
                                 in Fig. 1a. (e) Protein DNA ratio of isolated tubular epithelia. There was no difference between db/db and db/m
                                 mice at 18 weeks. (f) qPCR of RNA from isolated tubular epithelia for the representative markers of apical
                                 membrane transporters (slc5a2, slc5a1, slc9a3, slc34a1, and lrp2), basolateral glucose transporters (slc2a2 and
                                 slc2a1), tubular injury or mesenchymal markers (havcr1 for tubular injury and vim for epithelial-mesenchymal
                                 transition), and gluconeogenesis (g6pc and pck2). For all groups, data are means ± SEM, Bar = 50 μm in (a).

Scientific Reports |   (2022) 12:778 |                https://doi.org/10.1038/s41598-022-04880-1                                                 5

                                                                                                                                            Vol.:(0123456789)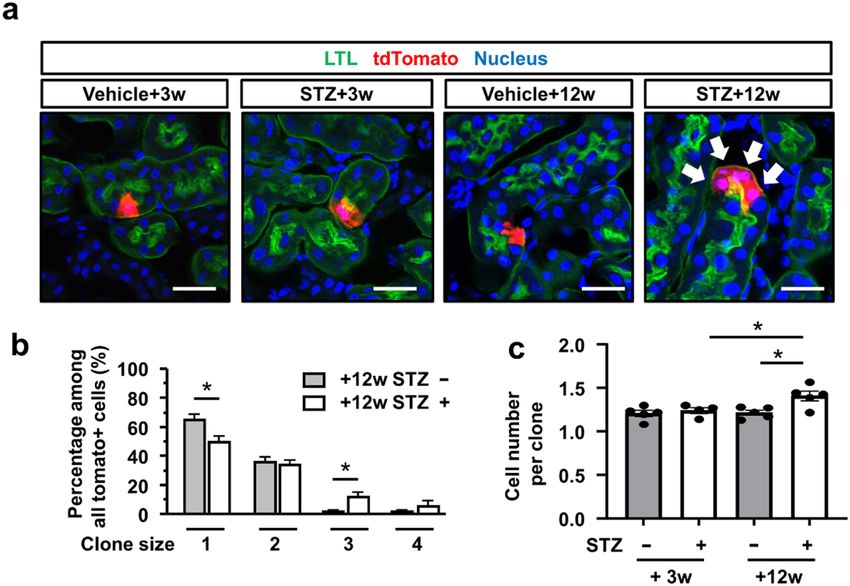
www.nature.com/scientificreports/

                                           Figure 4.  Clonal analysis of proximal tubular epithelial cells in db/db mice. (a) Experimental scheme. Single
                                           proximal tubular epithelial cells are labeled in SLC34a1GCE R26tdTomato db/db or db/m mice by low-dose
                                           tamoxifen injection at 6 weeks of age. (b) Representative images of immunostaining of SGLT2 (green) in db/m
                                           and db/db mice at 18 weeks. There was expansion of single tdTomato+ clones in db/db mice (arrows), whereas
                                           the majority of tdTomato+ cells remained as single-cell clones in db/m (arrowhead). (c) Rate of SGLT2 positivity
                                           among tdTomato+ epithelia. (d) Analysis of clone size and their frequency. Reduction of the frequency of single-
                                           cell clones and an increase in multicellular clones were observed in db/db mice. (e) The average clone size was
                                           larger in db/db mice. (f) qPCR of RNA from isolated tubular epithelia for the representative cell cycle markers.
                                           (g) Renal cortical tissue ATP level. For all groups, data are means ± SEM, *p < 0.05, Bar = 100 μm in (B).

          Scientific Reports |   (2022) 12:778 |               https://doi.org/10.1038/s41598-022-04880-1                                                6

Vol:.(1234567890)
www.nature.com/scientificreports/
Figure 5. Kidney growth in STZ-induced type 1 diabetic mice. (a) Experimental scheme. Single proximal
tubular epithelial cells were labeled by low-dose tamoxifen injection 2 weeks after 4 injections of 50 mg/kg of
STZ. (b,c) Blood glucose and urinary albumin excretion were higher in STZ mice. (d) The kidney weight/body
weight ratio significantly increased in STZ mice. (e) Representative PAS staining of kidney sections. (f–h) Cross-
sectional kidney area. The cortical and medullary areas were larger in STZ mice. (i) The average cross-sectional
area of proximal tubules was larger in STZ mice. (j) There was no difference in cell size of proximal tubular
epithelia between STZ- and vehicle-treated mice. For all groups, data are means ± SEM, *p < 0.05, Bar = 1 mm in
low power fields and 50 μm in high power fields of (e).
Discussion
This study addressed the cellular responses of proximal tubular epithelial cells in the early diabetic kidney using
lineage tracing analysis of terminally differentiated proximal tubular epithelia. Our clonal analysis of proximal
tubular epithelia labeled at the single-cell level demonstrated active cell proliferation in the kidney in both type
1 and type 2 diabetic mouse models. Analysis using FACS-sorted labeled proximal tubular epithelia revealed no
evidence of cellular hypertrophy in proximal tubular epithelia in type 2 diabetes. Therefore, proximal tubular
epithelial proliferation, rather than cellular hypertrophy, occurs during kidney growth under diabetic conditions.
As such, cellular proliferation accompanying an increase in SGLT2 expression is an adaptive response against
the increase in filtered glucose through the glomerulus, thereby increasing the reabsorption of urinary glucose.
The responsible cellular mechanism leading to kidney growth was heavily debated in the early 2000’s. In vivo
experiments using thymidine analogs and in vitro experiments revealed that the cellular response after hypergly-
cemic stimuli-induced cellular hypertrophy plays a major role in kidney g rowth7,19. Due to a lack of appropriate
methods for tracking the fates of proximal tubular epithelia long-term in diabetic mice, there have been no
Scientific Reports | (2022) 12:778 | https://doi.org/10.1038/s41598-022-04880-1 7
Vol.:(0123456789)www.nature.com/scientificreports/
Figure 6. Clonal analysis of proximal tubular epithelial cells in STZ-induced type 1 diabetic mice. (a)
Representative images of immunostaining of LTL (green) in STZ- or vehicle-injected mouse kidneys 3 or
12 weeks after STZ injection. There was expansion of tdTomato+ clones in STZ mice (arrowheads). (b)
Analysis of clone size and their frequency. Reduction of the frequency of single cell clones and an increase in
multicellular clones were observed in STZ injected mice. (c) The average clone size was larger 12 weeks after
STZ injection. N = 4 to 5 mice per group. For all groups, data are means ± SEM, *p < 0.05, Bar = 100 μm in (a).
updates in this field for almost 20 years. However, the direct evidence of the proliferation of proximal tubular
epithelial cells in the hypertrophic diabetic kidney provided in this study is not consistent with previous reports
arguing that cellular hypertrophy is a major player in this phenomenon. This discrepancy may be attributed to
the following.
First, the previous experiments focusing on the kidney growth in diabetes were mainly performed using STZ-
induced type 1 diabetes model mice because of the convenience of identifying the onset of diabetes7,19–22. STZ is
a member of a group of alkylating antineoplastic drugs and is widely used for the treatment of neuroendocrine
tumors due to its cytotoxic effects23. STZ is taken up by pancreatic beta-cells through GLUT2, resulting apoptosis
and type 1 diabetes10,24. However, as GLUT2 is abundantly expressed in the basolateral membrane of proximal
tubular epithelia, STZ can induce tubular epithelial injury, which is observed even though hyperglycemia is not
evident in STZ-injected m ice9,11,25. In the case of DNA damage in tubular epithelia, cell cycle arrest is introduced
to prevent further DNA damage, resulting in a higher protein/DNA ratio. As it is difficult to distinguish whether
cell cycle arrest was induced by hyperglycemic stimuli or by STZ-induced DNA d amage25, careful interpretation
of cell cycle arrest and subsequent cellular hypertrophy after STZ injection is required.
Second, turnover of tubular epithelia in the kidney is markedly slow and only 0.5 to 1.0% of tubular epithelia
were positive for Ki-67, a marker of cell division, under normal conditions16. As diabetes is a chronic disease con-
dition and a longer period is required for notable phenotypes, it is difficult to visualize differences in positivity of
cell proliferation markers in mice with or without diabetes. The observation period in most previous reports using
STZ-induced type 1 diabetic mice was within 2 weeks, which is not sufficient to reach the conclusion that cellular
proliferation did not contribute to kidney growth, especially in type 2 diabetes. Our lineage tracing analysis of
genetically labeled proximal tubular epithelia and fate tracking for a longer period can overcome this limitation.
We analyzed the gene expression of several transmembrane transporters using FACS-sorted proximal tubular
epithelia, and found that SGLT2 expression was slightly upregulated, whereas basolateral glucose transporters,
GLUT1 and GLUT2, were not. This is inconsistent with previous studies reporting the upregulation of both
SGLT2 and GLUT2 expression in the primary culture of urine-derived proximal tubular epithelia cells from
diabetic patients26. As proximal tubular epithelia are highly polarized cells under normal conditions in vivo,
the expression patterns and functions of membrane transporters are different between in vitro cultured condi-
tions and in vivo physiological conditions13,27, which may be problematic for the analysis of diabetic conditions
in vitro. For example, SGLT2 expression is observed at the apical membrane of tubular epithelia in vivo, but
glucose transport is reduced in in vitro cultured conditions even if SGLT2 mRNA is overexpressed in transfected
oocytes28. In addition, analysis using a two-chamber culture system clarified that only high basolateral glucose
exposure increased SGLT2 expression in a proximal tubular epithelia cell l ine13. Thus, cellular polarity is essen-
tial to maintain the expression of membrane transporters, including SGLT2, on the cellular apical surface, and
careful interpretation is required for analysis in vitro. Our analysis using freshly isolated proximal tubules by
Scientific Reports | (2022) 12:778 | https://doi.org/10.1038/s41598-022-04880-1 8
Vol:.(1234567890)www.nature.com/scientificreports/
FACS reflects the gene expression in vivo and demonstrated the upregulation of SGLT2 expression in individual
proximal tubular epithelial cells, albeit lower than that in previous r eports26.
In terms of active tubular proliferation and increased expression of SGLT2 in each proximal tubular epithelial
cell, these are factors underlying the increase in SGLT2 expression in kidney tissue, which may cause the higher
reabsorption of urinary glucose. Due to its anatomical structure and physiological function of high sodium
reabsorption, kidneys are borderline hypoxic at baseline and are therefore likely to respond to further decreases
in oxygen availability such as by releasing erythropoietin29. In response to hyperglycemic stimuli, increased
reabsorption of glucose and sodium through SGLT2 leads to a higher oxygen demand due to overactivation of
basolateral Na–K A TPase30. In previous reports, tissue hypoxia at the renal cortex was noted in mouse models
of both type 1 and type 2 diabetes, which was ameliorated by pharmacological SGLT2 i nhibition31. Considering
the hyper-reabsorption of sodium and glucose caused by the overexpression of SGLT2 in kidney tissue, kidney
growth may be related to higher oxygen consumption and subsequent tissue hypoxia, which synergistically cause
the acceleration of tissue damage in the diabetic kidney, resulting in its poor renal prognosis in diabetic patients.
In conclusion, we clarified the importance of cellular proliferation accompanying SGLT2 upregulation in the
development of early diabetic nephropathy. Control of blood glucose and blood pressure is essential for prevent-
ing diabetic nephropathy, and SGLT2 inhibitors markedly reduce the risk of developing renal events. Although
we demonstrated that the proliferation of SGLT2+ proximal tubular epithelial cells plays a major role in kidney
growth, the precise molecular mechanisms remain unknown, which is a potential limitation of our study. Consid-
ering the poor prognosis of enlarged kidneys in diabetic patients, the molecular mechanisms of this phenomenon
may be an attractive therapeutic target for preventing diabetic nephropathy, but further studies are required.
Methods
Animal experiments. We recently generated mice (SLC34a1GCE) with the CreERT2 cassette in the
SLC34a1 locus, which enables expression of the Cre recombinase in the proximal tubules after tamoxifen
injection16. SLC34a1GCE mice were crossed with the R26tdTomato reporter mice, in which tdTomato is
expressed after Cre-mediated recombination of the floxed stop cassette to obtain bigenic offspring. We fur-
ther crossed these bigenic mice with the non-diabetic C57BLKS/J Iar-m+/+Leprdb (db/m) mice purchased from
Oriental Bio Service Inc. (Kyoto, Japan), and obtained diabetic C57BLKS/J Iar—+Leprdb/+Leprdb (db/db) mice
carrying SLC34a1GCE and the R26tdTomato reporter (SLC34a1GCE/R26tdTomato/db/db). Mice were housed
under a 12-h light/dark cycle with free access to tap water and standard chow (CE-2, CLEA Japan, Inc., Tokyo,
Japan). For genetic labeling, tamoxifen (Sigma-Aldrich Co., LCC., St. Louis, MO) was dissolved in 3% (vol/vol)
ethanol containing corn oil (Sigma Aldrich) at a concentration of 10 mg/ml. Tamoxifen was injected intraperito-
neally at the indicated dose either once for single cell recombination or 5 times for full recombination. At the age
of 18 weeks, male mice were anesthetized with isoflurane and euthanized. After weighing the kidney, the kidneys
were cut into samples for further analysis.
For lineage tracing analysis of proximal tubular epithelial cells in the STZ-induced type 1 diabetic model
mice, we injected low-dose STZ (40 mg/kg, Cayman Chemical, MI, USA) or vehicle into bigenic male mice with
SLC34a1GCE and R26tdTomato 5 times. One week after the STZ injection, mice with blood glucose levels that
increased to higher than 350 mg/dl were used in experiments. After waiting for recovery from STZ-induced acute
kidney injury, 0.05 mg of tamoxifen was injected intraperitoneally for single-cell recombination.
Each experimental group contained at least 5 male mice. All experiments were approved by the Experimental
Animals Committee, Kyoto Prefectural University of Medicine, and were performed in accordance with the
institutional guidelines and Guidelines for Proper Conduct of Animal Experiments by the Science Council of
Japan and the ARRIVE guidelines.
Metabolic data. Body weights and blood glucose levels were measured at 17:00 every 2 weeks. Blood glu-
cose levels were measured by a glucometer (Glutest Every, Sanwa Kagaku Kenkyusho Co., Ltd., Aichi, Japan).
Regarding 24-h urine collection, mice were placed individually into metabolic cages (KN-645, Natsume
Seisakusho Co., Ltd., Tokyo, Japan) every 4 weeks. Urine albumin and creatinine levels were measured using
an immunoturbidimetric method (Oriental Yeast Co., Ltd., Tokyo, Japan) and enzyme-linked immunosorbent
assay (Nikken Seil Co., Ltd., Shizuoka, Japan), respectively.
Tissue preparation and histological analysis. For frozen sections, kidneys were fixed with 4% para-
formaldehyde in PBS for 1 h on ice, incubated in 30% (vol/vol) sucrose at 4 °C overnight, and embedded in Opti-
mum Cutting Temperature Compound (Sakura FineTek, Tokyo, Japan). Then, 7-μm sections were cut. For paraf-
fin sections, the kidneys were fixed with 4.0% paraformaldehyde and embedded in paraffin. Paraffin-embedded
tissues were cut into 4-μm-thick sections. Morphological evaluations of the kidneys were performed by periodic
acid-Schiff (PAS) staining under standard conditions. For the evaluation of kidney hypertrophy, the cortical
area of the short axis section, which was cut at the middle of the kidney, was measured. For the quantification
of glomerular size, the glomerular area in the same section, which contains approximately 100 glomeruli, was
measured and the average glomerular size was calculated.
For the quantification of proximal tubular hypertrophy, the total area of cortical proximal tubules (the remain-
ing cortical area after subtracting the area of glomeruli, of tubules without PAS+ brush border and of large ves-
sels) was measured. Thereafter, the average cross-sectional area of each proximal tubule was calculated using the
following formula: Cross-sectional area of proximal tubule = Total area of cortical proximal tubules / the total
number of cross-sections of proximal tubules (approximately 1500 tubules per mouse).
For the quantification of cellular hypertrophy, we measured the area of circular sections of 50 randomly
selected proximal tubules in each mouse in a blinded manner. Circular sections of proximal tubules were
Scientific Reports | (2022) 12:778 | https://doi.org/10.1038/s41598-022-04880-1 9
Vol.:(0123456789)www.nature.com/scientificreports/
arbitrarily defined as minor/major axis > 0.8 (Supplemental Fig. S2a). The size of a single proximal tubular epi-
thelial cell was calculated as the ratio of these areas to the number of nuclei (Supplemental Fig. S2b).
Histological quantification was performed using a BZ-X700/BZ-X710 microscope (Keyence Corporation,
Osaka, Japan) and ImageJ software (National Institutes of Health, Bethesda, MD).
Immunofluorescence analysis. For immunofluorescence, frozen sections were rehydrated and permea-
bilized with 0.5% Triton X-100 in PBS for 5 min. Samples were blocked with 10% normal goat serum in PBS
and sequentially incubated with the primary antibodies shown in Supplemental Table S1 for 1 h, followed by
incubation with Alexa Fluor 488-conjugated secondary antibodies (Supplemental Table S1) for 1 h. Nuclear
counterstaining was performed using DAPI or DRAQ5 (DR50050; BioStatus, Leicestershire, UK; 1:2000), fol-
lowed by mounting in Prolong-Gold (Thermo Fisher Scientific). Images were obtained by confocal microscopy
(FV1000; Olympus, Tokyo, Japan).
Lineage tracing analyses of terminally differentiated proximal tubular epithelial cells were performed as
described previously16. For dilution analysis, tdTomato+ cells among LTL + cells were quantified from 5 of 25
consecutive non-overlapping cortical fields in each kidney under high magnification (n = 5). These 5 fields were
randomly selected in a blinded manner. For clonal analysis, the number of consecutive tdTomato+ cells in more
than 10 HPF images of each kidney sections in randomly selected cortical fields was counted (n = 5).
Separation of tdTomato‑positive proximal tubular epithelia using FACS and protein / DNA
ratio measurement.. The kidney cortex was minced and a single-cell suspension was generated using
research grade Liberase TL (5401020001: Sigma-Aldrich) and 60 units/ml of DNAse Inhibitor (D5025: Sigma-
Aldrich) for 30 min at 37 °C. Cells were washed twice with MACS® Separation Buffer (Miltenyi Biotec GmbH
Bergisch Gladbach, Germany), filtered through 70- and 40-μm cell strainers, resuspended in autoMACS® Run-
ning buffer (Miltenyi Biotec GmbH) with 1000:1 DAPI (1 mg/mL), and subjected to FACS using SH800 (SONY,
Tokyo, Japan). Dead cells (DAPI+) were excluded during FACS. TdTomato+ DAPI- cells were collected in
DMEM and 10% FBS. RNA, DNA, and protein were extracted using NucleoSpin® TriPrep (TAKARA Bio Inc,
Shiga Japan). DNA concentrations in the extract were measured using NanoDrop 2000 (Thermo Fisher Scien-
tific, Waltham, MA, USA). The protein concentration in the extract was measured using the Protein Quantifica-
tion Assay (MACHEREY–NAGEL, Germany). The protein-to-DNA ratio was calculated and data are presented
as percentage increases relative to db/m.
RNA extraction and real‑time quantitative PCR.. Total RNA extraction and real-time quantitative
PCR were performed as described previously17. Total RNA was isolated from the kidneys or FACS-sorted cells
using TRIzol (Life Technologies, Inc., Carlsbad, CA) and Direct-zolTM RNA MiniPrep (Zymo Research Corpo-
ration., Irvine, CA) according to the manufacturer’s protocol. Subsequently, complementary DNA (cDNA) was
generated using a Prime Script reverse transcription (RT) reagent kit (RR0471A Takara Bio Inc., Shiga, Japan),
and real-time PCR was performed using KAPA SYBR Fast universal (KK4602: Kapa Biosystems, Wilmington,
MA) and a Thermal Cycler Dice Real Time System (Takara Bio Inc., Shiga, Japan). All reactions were performed
in duplicate. An initial denaturation step was performed for 10 min at 95 °C, which was followed by 45 cycles of
amplification at 95 °C for 10 s, 62 °C for 10 s, and 72°C for 30 s. Gene expression was quantified using gapdh as
an internal control. The primers used are listed in Supplemental Table 2.
Western blot analysis. Western blot analysis of FACS-sorted cells was performed as described previously17.
After extraction of total cell lysates by NucleoSpin® TriPrep, proteins were denatured by heating for 5 min at
95 °C and separated by SDS-PAGE. Subsequently, proteins were transferred onto polyvinylidene difluoride
(PVDF) membranes (Immobilon-P IPVH00010: Millipore, MA, USA). After blocking in 5% non-fat milk in
TBS/0.1% Tween20 for 1 h at room temperature, the membrane was incubated with the corresponding primary
antibody for SGLT2 (ab85626, abcam) overnight at 4 °C. After washing with TBS/0.1% Tween20, secondary per-
oxidase-conjugated anti-mouse or anti-rabbit antibodies were added (7074S; Cell Signaling Technology, Boston,
MA; 1:3000 at room temperature). Chemiluminescence was detected using an ECL select Western blot detection
reagent (RPN2235: GE Healthcare UK Ltd, Amersham Place, England) or Clarity Max western ECL substrate
(1,705,062: Bio-Rad Laboratories, Inc. Hercules, CA, USA). Signal intensities were evaluated using ImageJ soft-
ware (National Institutes of Health, Bethesda, MD).
Measurement of ATP levels in renal tissues. ATP concentrations in renal cortex samples were meas-
ured using an ATP-bioluminescent assay with the ’’Tissue’’ ATP assay Kit (TOYO B-Net Co. Ltd, Tokyo, Japan)
according to the manufacturer’s instructions. ATP concentrations are expressed as the ratio of ATP concentra-
tion to tissue volume.
Statistics. Results are expressed as the mean ± SEM. Each experiment was performed using at least five mice
per group. Statistical analysis was carried out using the unpaired t-test for comparison of two variables, and by
analysis of variance and Dunnett’s post hoc test for comparison of multiple variables. P-values < 0.05 were con-
sidered significant.
Scientific Reports | (2022) 12:778 | https://doi.org/10.1038/s41598-022-04880-1 10
Vol:.(1234567890)www.nature.com/scientificreports/
Received: 14 September 2021; Accepted: 28 December 2021
References
1. Zerbini, G. et al. Persistent renal hypertrophy and faster decline of glomerular filtration rate precede the development of micro-
albuminuria in type 1 diabetes. Diabetes 55, 2620–2625. https://doi.org/10.2337/db06-0592 (2006).
2. Rigalleau, V. et al. Large kidneys predict poor renal outcome in subjects with diabetes and chronic kidney disease. BMC Nephrol.
11, 3. https://doi.org/10.1186/1471-2369-11-3 (2010).
3. Baumgartl, H. J., Sigl, G., Banholzer, P., Haslbeck, M. & Standl, E. On the prognosis of IDDM patients with large kidneys. Nephrol.
Dialys. Transpl. 13, 630–634. https://doi.org/10.1093/ndt/13.3.630 (1998).
4. Wolf, G. & Ziyadeh, F. N. Molecular mechanisms of diabetic renal hypertrophy. Kidney Int. 56, 393–405. https://doi.org/10.1046/j.
1523-1755.1999.00590.x (1999).
5. Vallon, V. & Thomson, S. C. Renal function in diabetic disease models: the tubular system in the pathophysiology of the diabetic
kidney. Annu. Rev. Physiol. 74, 351–375. https://doi.org/10.1146/annurev-physiol-020911-153333 (2012).
6. Vallon, V. & Thomson, S. C. The tubular hypothesis of nephron filtration and diabetic kidney disease. Nat. Rev. Nephrol. 16,
317–336. https://doi.org/10.1038/s41581-020-0256-y (2020).
7. Huang, H. C. & Preisig, P. A. G1 kinases and transforming growth factor-beta signaling are associated with a growth pattern switch
in diabetes-induced renal growth. Kidney Int. 58, 162–172. https://doi.org/10.1046/j.1523-1755.2000.00151.x (2000).
8. Satriano, J. et al. Transition of kidney tubule cells to a senescent phenotype in early experimental diabetes. Am. J. Physiol. Cell
Physiol. 299, C374-380. https://doi.org/10.1152/ajpcell.00096.2010 (2010).
9. Tay, Y. C. et al. Can murine diabetic nephropathy be separated from superimposed acute renal failure?. Kidney Int. 68, 391–398.
https://doi.org/10.1111/j.1523-1755.2005.00405.x (2005).
10. Nahdi, A., John, A. & Raza, H. Elucidation of molecular mechanisms of streptozotocin-induced oxidative stress, apoptosis, and
mitochondrial dysfunction in Rin-5F pancreatic beta-cells. Oxid. Med. Cell. Longev. 2017, 7054272. https://doi.org/10.1155/2017/
7054272 (2017).
11. Brouwers, B. et al. Phlorizin pretreatment reduces acute renal toxicity in a mouse model for diabetic nephropathy. J. Biol. Chem.
288, 27200–27207. https://doi.org/10.1074/jbc.M113.469486 (2013).
12. Yang, L., Besschetnova, T. Y., Brooks, C. R., Shah, J. V. & Bonventre, J. V. Epithelial cell cycle arrest in G2/M mediates kidney fibrosis
after injury. Nat. Med. 16, 535–543. https://doi.org/10.1038/nm.2144 (2010).
13. Umino, H. et al. High basolateral glucose increases sodium-glucose cotransporter 2 and reduces sirtuin-1 in renal tubules through
glucose transporter-2 detection. Sci. Rep. 8, 6791. https://doi.org/10.1038/s41598-018-25054-y (2018).
14. Duffield, J. S. & Humphreys, B. D. Origin of new cells in the adult kidney: results from genetic labeling techniques. Kidney Int. 79,
494–501. https://doi.org/10.1038/ki.2010.338 (2011).
15. Humphreys, B. D. & DiRocco, D. P. Lineage-tracing methods and the kidney. Kidney Int. 86, 481–488. https://doi.org/10.1038/ki.
2013.368 (2014).
16. Kusaba, T., Lalli, M., Kramann, R., Kobayashi, A. & Humphreys, B. D. Differentiated kidney epithelial cells repair injured proximal
tubule. Proc. Natl. Acad. Sci. USA 111, 1527–1532. https://doi.org/10.1073/pnas.1310653110 (2014).
17. Uehara, M. et al. Pharmacological inhibition of ataxia-telangiectasia mutated exacerbates acute kidney injury by activating p53
signaling in mice. Sci. Rep. 10, 4441. https://doi.org/10.1038/s41598-020-61456-7 (2020).
18. Wu, H., Kirita, Y., Donnelly, E. L. & Humphreys, B. D. Advantages of single-nucleus over single-cell RNA sequencing of adult
kidney: Rare cell types and novel cell states revealed in fibrosis. J Am Soc Nephrol 30, 23–32. https://doi.org/10.1681/ASN.20180
90912 (2019).
19. Rasch, R. & Norgaard, J. O. Renal enlargement: Comparative autoradiographic studies of 3H-thymidine uptake in diabetic and
uninephrectomized rats. Diabetologia 25, 280–287. https://doi.org/10.1007/BF00279944 (1983).
20. Seyer-Hansen, K. Renal hypertrophy in experimental diabetes: a comparison to compensatory hypertrophy. Diabetologia 14,
325–328. https://doi.org/10.1007/BF01223024 (1978).
21. Seyer-Hansen, K., Hansen, J. & Gundersen, H. J. Renal hypertrophy in experimental diabetes. A morphometric study.. Diabetologia
18, 501–505. https://doi.org/10.1007/BF00261707 (1980).
22. Seyer-Hansen, K. Renal hypertrophy in experimental diabetes mellitus. Kidney Int. 23, 643–646. https://doi.org/10.1038/ki.1983.
71 (1983).
23. Pavel, M. et al. Gastroenteropancreatic neuroendocrine neoplasms: ESMO clinical practice guidelines for diagnosis, treatment
and follow-up. Ann. Oncol. 31, 844–860. https://doi.org/10.1016/j.annonc.2020.03.304 (2020).
24. Szkudelski, T. The mechanism of alloxan and streptozotocin action in B cells of the rat pancreas. Physiol. Res. 50, 537–546 (2001).
25. Breyer, M. D. et al. Mouse models of diabetic nephropathy. J. Am. Soc. Nephrol. 16, 27–45. https://doi.org/10.1681/ASN.20040
80648 (2005).
26. Rahmoune, H. et al. Glucose transporters in human renal proximal tubular cells isolated from the urine of patients with non-
insulin-dependent diabetes. Diabetes 54, 3427–3434 (2005).
27. Takesue, H., Hirota, T., Tachimura, M., Tokashiki, A. & Ieiri, I. Nucleosome positioning and gene regulation of the SGLT2 gene
in the renal proximal tubular epithelial cells. Mol. Pharmacol. 94, 953–962. https://doi.org/10.1124/mol.118.111807 (2018).
28. Coady, M. J. et al. MAP17 is a necessary activator of renal Na+/glucose cotransporter SGLT2. J. Am. Soc. Nephrol. 28, 85–93. https://
doi.org/10.1681/ASN.2015111282 (2017).
29. Safran, M. et al. Mouse model for noninvasive imaging of HIF prolyl hydroxylase activity: Assessment of an oral agent that stimu-
lates erythropoietin production. Proc. Natl. Acad. Sci. USA 103, 105–110. https://doi.org/10.1073/pnas.0509459103 (2006).
30. Korner, A., Eklof, A. C., Celsi, G. & Aperia, A. Increased renal metabolism in diabetes. Mechanism and functional implications.
Diabetes 43, 629–633 (1994).
31. Kamezaki, M. et al. Comprehensive renoprotective effects of ipragliflozin on early diabetic nephropathy in mice. Sci. Rep. 8, 4029.
https://doi.org/10.1038/s41598-018-22229-5 (2018).
Author contributions
N.W-U., A.Y.-T. A.M. and T.K. performed the experiments and analyzed the data, designed the study, and wrote
the manuscript. N.O.-O., I. N., T.N., K.N., T.I., K.I., T.K., N.Y., M.K. and Y.K. analyzed the data and contributed
to the discussion. K.T. and S.M. reviewed/edited the manuscript.
Funding
This study was supported in part by a grant from the Ministry of Education, Culture, Sports, Science and Tech-
nology of Japan (Grant number 20K08640).
Scientific Reports | (2022) 12:778 | https://doi.org/10.1038/s41598-022-04880-1 11
Vol.:(0123456789)www.nature.com/scientificreports/
Competing interests
The authors declare no competing interests.
Additional information
Supplementary Information The online version contains supplementary material available at https://doi.org/
10.1038/s41598-022-04880-1.
Correspondence and requests for materials should be addressed to T.K.
Reprints and permissions information is available at www.nature.com/reprints.
Publisher’s note Springer Nature remains neutral with regard to jurisdictional claims in published maps and
institutional affiliations.
Open Access This article is licensed under a Creative Commons Attribution 4.0 International
License, which permits use, sharing, adaptation, distribution and reproduction in any medium or
format, as long as you give appropriate credit to the original author(s) and the source, provide a link to the
Creative Commons licence, and indicate if changes were made. The images or other third party material in this
article are included in the article’s Creative Commons licence, unless indicated otherwise in a credit line to the
material. If material is not included in the article’s Creative Commons licence and your intended use is not
permitted by statutory regulation or exceeds the permitted use, you will need to obtain permission directly from
the copyright holder. To view a copy of this licence, visit http://creativecommons.org/licenses/by/4.0/.
© The Author(s) 2022
Scientific Reports | (2022) 12:778 | https://doi.org/10.1038/s41598-022-04880-1 12
Vol:.(1234567890)You can also read