Greenland bare-ice albedo from PROMICE automatic weather station measurements and Sentinel-3 satellite observations
←
→
Page content transcription
If your browser does not render page correctly, please read the page content below

RESEARCH ARTICLE
Greenland bare-ice albedo from PROMICE automatic weather
station measurements and Sentinel-3 satellite observations
Adrien Wehrlé*1 , Jason E. Box1 , Masashi Niwano2 , Alexandre M. Anesio3 , Robert S. Fausto1
Geological Survey of Denmark and Greenland (GEUS), Copenhagen, Denmark, 2Meteorological Research Institute, Japan Meteorological Agency,
1
Tsukuba, Japan, 3Department of Environmental Science, Aarhus University, Roskilde, Denmark
Abstract *Correspondence: adrien.wehrle@hotmail.fr
Received: 09 Jun 2020
The Programme for Monitoring of the Greenland Ice Sheet (PROMICE) Accepted: 12 Jan 2021
provides surface meteorological and glaciological measurements from wide- Published: 19 Apr 2021
spread on-ice automatic weather stations since mid-2007. In this study, we
Keywords: Greenland ice sheet, albedo, ice
use 105 PROMICE ice-ablation time series to identify the timing of seasonal ablation, PROMICE, Sentinel-3
bare-ice onset preceded by snow cover conditions. From this collection, we
find a bare-ice albedo at ice-ablation onset (here called bare-ice-onset albedo) Abbreviations:
AWS: Automatic Weather Station
of 0.565 ± 0.109 that has no apparent spatial d ependence among 20 sites PROMICE: Programme for Monitoring of
across Greenland. We then apply this snow-to-ice albedo transition value to the Greenland Ice Sheet
measure the variations in daily Greenland bare-ice area in Sentinel-3 optical OLCI: Ocean and Land Color Instrument
CPI: Cloud Cover Probability Index
satellite imagery covering the extremely low and high respective melt years
TOA: Top of Atmosphere
of 2018 and 2019. Daily Greenland bare-ice area peaked at 153 489 km² in SZA: Solar Zenith Angle
2019, 1.9 times larger than in 2018 (80 220 km²), equating to 9.0% (in 2019) SCDA: Simple Cloud Detection Algorithm
SLSTR: Sea and Land Surface Temperature
and 4.7% (in 2018) of the ice sheet area.
Radiometer
RMSE: Root-Mean-Square Error
MODIS: Moderate Resolution Imaging
1 Introduction Spectroradiometer
The recent net loss of Greenland land ice is among the largest contributors to
GEUS Bulletin is an open access, peer-
global sea-level rise (Box & Sharp 2017). While warm air advection produces
reviewed journal published by the
the highest daily ice-ablation observations (Fausto et al. 2016), absorbed sun- Geological Survey of Denmark and
light is the largest melt energy source over seasonal time scales (van den Greenland (GEUS). This article is distributed
Broeke et al. 2008; Box et al. 2012; Fausto et al. 2016). Absorbed sunlight under a CC-BY 4.0 licence, permitting free
redistribution, and reproduction for any
increases during the melt season as surface conditions shift from a highly purpose, even commercial, provided
reflective, dry snow cover, to lower albedo wet snow with larger grains proper citation of the original work.
(Wiscombe & Warren 1980; Brun 1989), and yet lower albedo across the abla- Author(s) retain copyright.
tion area. Bare ice darkened primarily by ice algae (Stibal et al. 2017; Ryan Edited by: Signe Hillerup Larsen (GEUS,
et al. 2018; Cook et al. 2020; Williamson et al. 2020) plays an important role in Denmark)
peak ice-sheet melt rates. Accurate definition of bare-ice albedo at ice-abla-
Reviewed by: Horst Machguth (Université
tion onset (hereafter bare-ice-onset albedo) has applications in (1) classifying de Fribourg, Switzerland), Xavier Fettweis
the bare-ice area over large areas of the ice sheet (Ryan et al. 2019; Fausto (University of Liege, Belgium)
et al. 2020); (2) constraining Polar regional climate models used to estimate Funding: See page 8
the surface mass balance of the Greenland ice sheet (Fettweis et al. 2020) and
Competing interests: None declared
(3) climate monitoring (e.g. Moon et al. 2020).
Here, we study the surface climate conditions spanning the melt season Additional files: See page 8
transition from dry snow to bare ice using PROMICE ground measurements.
Our main objective is to determine an albedo value useful in classifying the
boundary between seasonal snow cover and bare ice. We proceed to deter-
mine the spatial and temporal patterns of bare-ice albedo using spaceborne
Wehrlé et al. 2021: GEUS Bulletin 47. 5284. https://doi.org/10.34194/geusb.v47.5284 1 of 9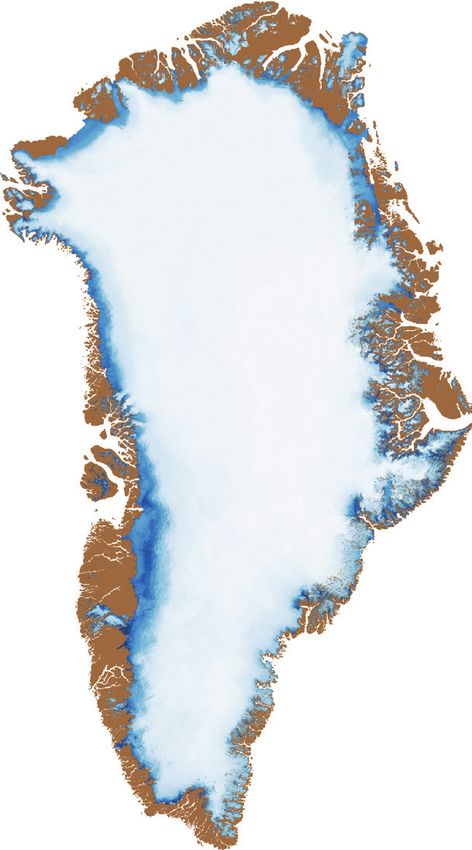
www.geusbulletin.org

observations from the EU Copernicus Sentinel-3 satel-                             ice ablation and albedo. Three stations situated in the
lite mission applied to a low (2018) and high (2019) melt                         accumulation area, where the underlying ice did not
year to measure the maximum relative differences in                               appear, were excluded from the analysis. The acquisi-
bare-ice area.                                                                    tion and/or computation of each variable is described in
                                                                                  the following sections.

2 Data and methods                                                                2.1.1 Air temperature
2.1 PROMICE surface measurements                                                  Air temperature is recorded at PROMICE AWSs using
Across the Greenland ice sheet, the sunlight reflectivity                         a platinum resistance thermometer in an aspirated
of snow and ice, hereafter albedo, and several other                              shield. The measurement height above the surface var-
surface meteorological and glaciological parameters are                           ies between 0 and 2.6 m due to snow accumulation,
measured by more than 20 Automatic Weather Stations                               compaction and ablation.
(AWSs), operated by The Programme for Monitoring
of the Greenland Ice Sheet (PROMICE) since mid-2007                               2.1.2 Seasonal snow layer thickness
(Ahlstrøm et al. 2008). PROMICE operates AWSs in nine                             Snow thickness above the ice surface is obtained from
regions around Greenland (Fig. 1) where most locations                            the AWS acoustic recordings of distance from a sonic
have a lower and upper AWS, denoted by _L and _U,                                 sensor to the snow or ice surface. The sensor height
respectively.                                                                     above bare ice is determined here for each station year
   In our analysis of daily average PROMICE AWS data,                             from a 20-day average of daily values. This average is
we used an initial dataset of 225 station years from 26                           computed 10 days after bare-ice onset determined from
station locations for air temperature, snow thickness,                            ice-ablation measurements (see section 2.2) to ensure

80°N         80°W            60°W                          20°W     0°W
                                                                                                                              4
                                                                                                            3
                                                                                                   2

                     00
                                                                                       1
                   10 0
                       0
                    15 0                                KPC                                                              5a
                         5
                      17         00
                             20
                                  22
                                      50                                                                            6
 THU              CEN
 75°N
                                               25

                                           EGP
                                                    00

                                              27
                                                   50
                                                                                                                7

                       UPE
                                                   3000
                                                                                                       8
                                                          SCO
 70°N                                                                             5b
                                                                                                                9
                       Greenland                                                                                              7
                    1250

                                                                                                 10
                           KAN
                                           20 50

                                                                                                                           11
                       50

                            50

                                             00
                                             22

 65°N
                      17

                            22

                                       TAS
                       NUK                         MIT
                                                                          1: solar and infrared radiation, 2: tilt sensor, 3: satellite
                       00
                            50
                       25
                            27

                                                                          antenna, 4: wind speed & direction, 5: snow/ice surface
                 15

                       QAS                                                height, 6: air temperature & humidity, 7: ice ablation
                                                          500 km
                  00

 60°N                                                                     ’hose’, 8: solar panel, 9: data logger, barometer and
            50°W                            40°W                   20°W   GPS, 10: battery, 11: ice temperature profile (8 levels)

Fig. 1 Locations and description of Programme for Monitoring of the Greenland Ice Sheet (PROMICE) automatic weather stations
(AWSs). A: PROMICE sites. Dashed lines indicate surface elevation in metres. Red circles indicate PROMICE AWSs used in this study
while blue circles indicate AWSs excluded from this study. B: PROMICE AWS instruments. Red circles indicate the instrumentation
used in this study.

Wehrlé et al. 2021: GEUS Bulletin 47. 5284. https://doi.org/10.34194/geusb.v47.5284                                                 2 of 9
www.geusbulletin.org
snow-free conditions. The sensor height is then sub- of ice-ablation onset but helped to better constrain its
tracted to obtain the snow thickness. identification before further refinements.
Following this first step, we excluded time series
2.1.3 Ice ablation with interruptions within the period of interest, instru-
PROMICE stations measure ice ablation using the pres- ment malfunctions and/or those for which the ice abla-
sure of the column of antifreeze over a pressure trans- tion onset could not be identified. Only data within ±
ducer (Fausto et al. 2012). The transducer is initially 45 days of bare-ice onset were thereafter considered,
drilled 10 to 14 m into the ice and re-installed to avoid corresponding to the average time span of the abla-
complete exhumation. At high ablation (>6 m ice per tion season. The resulting dataset contained 105 sta-
year) sites like QAS_L and KAN_L, instrument re-installa- tion years from 20 stations across the ice sheet (c. 47
tion occurs each year. At most other sites, the re-instal- and 77% of the initial dataset size, respectively) con-
lation frequency is two to three years. sisting of more than 9000 daily measurements for each
variable.
2.1.4 Surface albedo The raw ice-ablation measurements, consisting of
Daily average albedo is calculated from 10-minute tilt- cumulated values after each instrument re-installation,
corrected (Wang et al. 2015) upward and downward the average instrument recording within 45 days before
solar irradiance recordings in the 0.3 to 2.5 μm wave- the initial bare-ice onset were then subtracted from
length range. Hourly data are averaged for cases with the associated ice-ablation time series for each station
solar elevation angles above 20°. Daily averages are year. In this way, the ablation measurements forming
computed from hourly data between 0 and 1. The daily the final dataset consisted of values relative to the pre-
albedo values are further adjusted after the correction melt season and therefore, each station year had a zero
proposed by Aoki et al. (2011) for measurement plat- average prior to the ice-ablation season. The processing
form obstruction of the radiometer field of view. This steps are further documented in a Github repository
correction increases PROMICE AWS albedo measure- (Wehrlé & Box 2020a).
ments by 0.034 on average. The timing of bare-ice onset was then refined for
each station year by accounting for measurement
uncertainty. To this end, a threshold was determined
2.2 Determining Greenland bare-ice albedo at to estimate the first ‘significant’ ice-ablation value
ice-ablation onset after the manually selected ablation onset; a value
In order to study the ablation season albedo as it tran- for which we have high confidence that bare-ice con-
sitions from snow to bare ice, we use ice-ablation mea- ditions begin to prevail. A too conservative ice abla-
surements to determine the timing of bare-ice onset. tion threshold (i.e. above the actual precision of the
Seasonal snow layer thickness and air temperature fur- measurement), would lead to a delayed detection of
ther contributed to a better understanding of the evolu- the bare-ice onset date. Such a delay would cause a
tion of surface conditions. dark bias in the determination of the average bare-
Ice-ablation time series were manually compensated ice albedo as the ice may have already been affected
for signal shifts caused by station movement, sen- by algal darkening (Stibal et al. 2017; Ryan et al. 2018;
sor reinstallation and measurement failure. We then Cook et al. 2020; Williamson et al. 2020). On the other
attempted to automatically determine a theoretical can- hand, bare-ice onset would be defined prematurely if
didate date of ice-ablation onset for each station year. the threshold was too restrictive (i.e. below the actual
To this end, an automatic detection was conducted to precision of the measurement) leading to a bright bias
identify curve inflexions (Satopaa et al. 2011). However, in bare-ice albedo associated with residual patches of
signal variability as well as heterogeneous transition snow. Assessment of the temporal variation in surface
patterns precluded this approach. Instead, the ice-abla- conditions spanning the melt season snow-to-ice tran-
tion onset was first identified manually for each station sition was therefore needed to determine an optimal
year with supporting data of snow layer thickness and threshold. For this reason, we computed the average
air temperature time series when necessary. Despite bare-ice albedo from all station years at the date of
careful inspection, roughly 20% of the ice ablation onset ice-ablation onset for a range of ice-ablation thresh-
dates were flagged as ambiguous because of noisy or olds. The lower threshold boundary, set to 4 cm,
complex patterns. Also, distinguishing transient melting corresponds to the accuracy of the pressure signal
days before the ice melt onset from a short sequence in the ice-ablation setup for each measurement. On
of freezing days after the start of ice ablation remained the other hand, 8 cm which is the sum of the uncer-
challenging. Measurement uncertainty was not taken tainties of two pressure measurements, represents a
into account in this initial and theoretical estimation maximized theoretical uncertainty of the ice-ablation
Wehrlé et al. 2021: GEUS Bulletin 47. 5284. https://doi.org/10.34194/geusb.v47.5284 3 of 9www.geusbulletin.org
measurement. We added 10% of this value to obtain a with signal noise. Average rate of ice ablation is 3.5 ± 0.5
conservative upper limit threshold of 9 cm. We found cm per day after bare-ice onset (Fig. 2c).
a curve inflection in the resulting albedo at a threshold
of 6 cm with the slope of the linear regression being 3.4 Surface albedo
11 times steeper within the 4–6 cm range than within The daily average albedo composite is stable (0.794
the 6–9 cm range (–0.98 and –0.09, respectively). We ± 0.008) until c. 15 days prior to bare-ice onset. Then,
contend that this change in data behaviour illustrates average albedo declines by –0.008 ± 0.007 per day
a snow-to-ice transition. As the melt of remaining het- until 6 days prior to bare-ice onset (Fig. 2d). The albedo
erogeneous patches of snow rapidly decreases the decline rate then increases to –0.029 ± 0.009 per day
albedo, the underlying ice appears and further dark- until bare-ice onset. This steeper decline is partly
ens at a slower rate. To be certain of bare-ice preva- driven by emergence of darker bare-ice patches and
lence, we therefore defined the day of bare-ice onset snow metamorphism. At the onset of snow melt, wet
as the first day after the manually selected transition snow metamorphism (Brun 1989) causes rapid grain
with a cumulative ice ablation >6 cm. The 6 cm thresh- growth, resulting in the reduction of near-infrared
old equals the ice-ablation uncertainty determined snow albedo (Wiscombe & Warren 1980; Brun 1989).
in Fausto et al. (2016). The resulting start of signifi- The composite bare-ice-onset albedo is 0.565 ± 0.109,
cant ice ablation occurs 4 ± 3 days after the manually which is between the recommended values for super-
selected inflection determined in the first step. The imposed ice and clean ice in Cuffey & Paterson (2010).
time series of each climate variable was then com- Values remain stable for 8 days before albedo further
bined to build composites, that is, multi station-year declines at an average rate of –0.009 ± 0.004 per day
averages synchronised to the determined emergence for 10 days. Finally, a slight decrease (–0.002 ± 0.005
of bare ice. The average albedo value at the date of per day) brings the composite albedo to its minimum
bare-ice onset, our bare-ice-onset albedo, was finally daily average over the entire period (0.454 ± 0.140),
extracted. 36 days after bare-ice onset. The mean difference of
0.111 between bare-ice onset and minimum albedo
may be the result of ice algal growth (see Stibal et al.
3 Results
2017). The composite average albedo subsequently
In this section, we present and analyse surface condi-
increases due to a temperature decrease as the melt
tions ± 45 days around the onset of ice ablation with an
season comes to its end and seasonal snowfall begins
emphasis on the albedo transition from snow to ice.
to accumulate.
We further examined a Cloud Cover Probability Index
3.1 Air temperature (CPI) based on longwave downward irradiance and air
Eight days prior to average bare-ice onset, composite temperature (van As 2011) to assess the influence of
average air temperature increases on average by 0.18°C cloud cover on albedo. We find a daily standard devi-
per day before reaching the melting point (Fig. 2a). After ation of 0.013 on composite albedo, albedo depending
four days of relatively constant air temperatures under on the CPI threshold (from 0.1 to 0.9, in 0.01 steps). On
snow-melt conditions (0.21 ± 0.09°C), composite air the day of bare-ice onset, a standard deviation of 0.007
temperature increases with an average rate of 0.57°C suggests little influence of cloud cover.
per day until bare-ice onset. Composite air tempera- The significant variability associated with the com-
ture then stabilises at 2.75 ± 0.43°C, which we suggest is posite bare-ice-onset albedo (0.565 ± 0.109) is a result
associated with the sensible heat sink effect of the iso- of a combination of data acquisition factors, method
thermal melting surface. accuracies and regional variations. While the measure-
ment accuracies are estimated, we cannot assess the
method accuracy or the regional variations in bare-
3.2 Seasonal snow layer thickness
ice-onset albedo because of a lack of in situ measure-
Composite snow height decreases at a rate of 7 ± 8 mm
ments at field-verified dates of bare-ice onset and
per day over the first 31 days, then gradually increases
with a widespread spatial coverage. Thus, the relative
to 16 ± 7 mm per day until bare-ice onset (Fig. 2b). The
share of responsibility of each of these sources in the
high variability before bare-ice onset is associated with
total variability remains unknown. Nevertheless, in
differences in weather conditions between stations.
order to investigate the stability of this bare-ice-on-
set albedo value, we conducted 10 000 simulations
3.3 Ice ablation where half the station years (53) were excluded ran-
Before melt onset, average near-zero values of ice abla- domly. We found a standard deviation of 0.011 on
tion have a standard deviation of 3.4 cm, associated average bare-ice-onset albedo, which demonstrates
Wehrlé et al. 2021: GEUS Bulletin 47. 5284. https://doi.org/10.34194/geusb.v47.5284 4 of 9www.geusbulletin.org
a b 1.0 ± one standard deviation
5.0
2.5 0.8
Air temperature, °C
Snow height, m
0.0 0.6
–2.5
0.4
–5.0
–7.5 0.2
–10.0 0.0
–12.5
–0.2
–45 –35 –25 –15 –5 5 15 25 35 45 –45 –35 –25 –15 –5 5 15 25 35 45
Bare-ice day Bare-ice day
c 0.0 d 0.9 0.565 ± 0.109
0.8
–0.5
Albedo, unitless
Ice ablation, m
0.7
–1.0
0.6
–1.5 0.5
–2.0 0.4
0.3
–45 –35 –25 –15 –5 5 15 25 35 45 –45 –35 –25 –15 –5 5 15 25 35 45
Bare-ice day Bare-ice day
Fig. 2 Multi-site and multi-year composite surface conditions synchronised to bare-ice onset from ice ablation (black vertical
dashed lines). a: Air temperature. b: Snow height. c: Ice ablation. d: Albedo where the red horizontal dashed line indicates the
bare-ice-onset albedo. Grey shading corresponds to ± one standard deviation around daily averages.
a low sensitivity to sample size. We also found a low observations. Here, we focus on 2018 and 2019 which
variability within the range of ice-ablation thresholds are low and high melt years, respectively.
from 4 to 9 cm (daily albedo standard deviation of
0.005 for the period of interest), boundary thresholds
being associated with bare-ice-onset albedo values of
4.1 Albedo retrieval from Sentinel-3
0.585 and 0.560, respectively. While a relatively large
observations
The EU Copernicus Sentinel-3 satellite Ocean and Land
difference in bare-ice-onset albedo (0.02) is obtained
Color Instrument (OLCI) provides 21 spectral bands
for ice-ablation thresholds between only 4 and 6 cm,
from 400 nm in visible wavelengths to 1020 nm in the
a very small difference (0.002) is obtained for a larger
near-infrared, from October 2016 to present. Here,
difference of 3 cm between ice-ablation thresholds of
we computed snow albedo (ASnow) from OLCI observa-
6 and 9 cm. These results further support the change
tions using a fast atmospheric correction technique
in data behaviour observed at an ice-ablation thresh-
(Kokhanovsky et al. 2018, 2020). Because the extremely
old of 6 cm presented in section 2.2, where the evo-
heterogeneous bare-ice surface conditions violate
lution in bare-ice albedo switches from a quickly
assumptions in Kokhanovsky’s theory, we determined
decreasing to a slowly decreasing regime. Finally, low
bare-ice albedo from a simple empirical approach.
correlations between average bare-ice albedo and sta-
This approach consists of a fit between 4729 hourly
tion elevation, latitude and longitude (–0.07, 0.25 and
PROMICE albedo measurements and the nearest in
0.04, respectively) suggest no spatial dependence of
time and space OLCI Top of Atmosphere (TOA) reflec-
the bare-ice-onset albedo.
tances spanning three years (2017–2019). In order to
compute this fit, OLCI TOA radiances were first con-
4 Application to spaceborne verted to reflectances (R) normalised with the Solar
observations Zenith Angle (SZA) by:
The bare-ice-onset albedo determined in the previous
R = OLCI TOA radiance π / (cos(SZA) S0)(1)
section can be used as an upper bound for ice albedo
in order to monitor the evolution of the Greenland bare- Where S0 is the TOA solar irradiance measured aboard
ice area throughout the melt season using spaceborne Sentinel-3.
Wehrlé et al. 2021: GEUS Bulletin 47. 5284. https://doi.org/10.34194/geusb.v47.5284 5 of 9www.geusbulletin.org
We then defined the bare-ice albedo (AIce) from a fit to to be cloud free. The last valid pixel value covering a given
the average of four OLCI TOA reflectances: area then remains until a new valid value is determined.
The different processing and filtering steps are docu-
AIce = α (R400 nm+ R560 nm+ R865 nm + R1020 nm) / 4+ β (2) mented in a Github repository (Wehrlé & Box 2020b).
where α corresponds to the slope of the linear regres-
sion between OLCI TOA and PROMICE albedo measure- 4.2 Deriving Greenland bare-ice area
ments, and β is its intercept. Computing an orthogonal The bare-ice-onset albedo (0.565) was used to com-
distance regression, we found respective α and β coeffi- pute bare-ice area from ‘gapless’ daily albedo averages
cients of 1.003 and 0.058 associated with a high correla- in 2018 (low melt year) and 2019 (high melt year). The
tion of R = 0.899 and a standard error of 0.006. 0.565 threshold represents a compromise between the
We subsequently built daily mosaics for Greenland 105 station years of the dataset as it is associated with
albedo using ASnow combined with AIce for ASnow values variability in ice types linked to background impurity
below the average bare-ice-onset albedo (0.565) deter- concentration and resulting albedo. While the PROMICE
mined in this study. We found an average absolute dif- network provides unprecedented access to crucial
ference of 0.078 between AIce and ASnow, ±10% around the observations of conditions at the ice-sheet surface, the
bare-ice-onset albedo. apparent limitations of in situ monitoring at very high
Clouds were detected and thereafter masked in Sen- resolution still prevent a precise study of these spatial
tinel-3 imagery using the Simple Cloud Detection Algo- variations using ground measurements. The standard
rithm (SCDA) version 2.0 (Metsämäki et al. 2015; Wehrlé deviation of 0.109 on the bare-ice-onset albedo is there-
& Box 2021). This algorithm consists of up to six tests on fore associated with the spatial and temporal variabil-
Sea and Land Surface Temperature Radiometer (SLSTR) ity of the parameters measured at the different AWSs.
TOA reflectances (550 and 1600 nm) and brightness This standard deviation probably overestimates the true
temperatures (3.7, 11 and 12 μm). variability of bare-ice-onset albedo across the entire ice
We further applied a temporal filter based on out- sheet. The inevitable localised characteristics of field
lier detection modified after Box et al. (2017) to remove measurements often result in small sampling sizes rela-
remaining cloud artifacts, which would otherwise intro- tive to the area of the region of interest, which leads to
duce abrupt temporal variations in the albedo time a higher influence of outliers compared to larger data-
series. This processing consists of a 10-day rolling aver- sets. On the other hand, we estimate that sampling size
age applied to each pixel time series, for cases where the has little influence on the average bare-ice albedo itself
central value is within ± 15% of the window median. (see Section 3). Consequently, we decided not to use this
To validate the albedo retrievals, we compared standard deviation as a measure of uncertainty for our
the snow and ice OLCI-derived albedo with PROMICE thresholding to determine bare-ice area. Nevertheless,
ground measurements. We first used the CPI to exclude to assess the sensitivity of the bare-ice area determina-
albedo ground measurements acquired under cloudy tion, we applied bare-ice albedo values obtained with
conditions that we associated with a CPI >0.3. Despite theoretical ice-ablation thresholds of 4 and 9 cm (0.585
the ‘collocation problem’ of the large difference in foot- and 0.560, respectively) introduced in Section 2.
print size between the ground station (c. 2 m × 2 m foot-
print) and the 1 km × 1 km OLCI pixel (see Ryan et al. 4.3 Variations in Greenland bare-ice area
2017), we found a high correlation (R = 0.885, N = 549), The Sentinel-3 satellite-derived albedo maps upscale
a Root-Mean-Square Error (RMSE) of 0.079 and an insig- our analysis and compare the near record high melt
nificant mean bias (0.005) between OLCI-derived albedo year, 2019 (Tedesco & Fettweis 2020), to the low melt
and ground measurements. Further, we found a mean year, 2018, across Greenland (Fig. 3). Daily Greenland ice
absolute difference of 0.069 within ± one standard devi- albedo (including peripheral ice caps) was on average
ation around the bare-ice-onset albedo (0.565 ± 0.109). 0.030 (–3.7%) lower in 2019 for the melt season defined
We expect that some part of the RMSE is attributable as 1 May to 15 September, reaching a maximum differ-
to transient errors in the ground observations, such as ence of 0.053 (–6.7%) on 3 August (Fig. 3a). This maxi-
water droplets or ice on the radiometer domes, specular mum difference occurred after a 2019 high-melt event,
reflections from the station or equipment shadowing on which reduced the 2019 daily albedo to a minimum of
the surface or radiometer. The assessed albedo RMSE 0.738, lower by 0.044 (–5.6%) than the 2018 minimum
can also increase due to undetected clouds affecting the of 0.782. As estimated from the Moderate Resolution
spaceborne observations. Imaging Spectroradiometer (MODIS) after Box et al.
Finally, ‘gapless’ daily 1 km OLCI albedo grids were gen- (2017), albedo averaged over Greenland land-ice was
erated by updating pixel values when an area is considered 0.817 and 0.777 from June to August 2018 and 2019,
Wehrlé et al. 2021: GEUS Bulletin 47. 5284. https://doi.org/10.34194/geusb.v47.5284 6 of 9www.geusbulletin.org
July 2018 July 2019 0.84 a
0.82
Albedo, unitless
0.80
0.78
2018
0.76
2019
0.74 July
b
Bare-ice area, 103 km2
150
100
50
0
Albedo
125 c
bare-ice area, 103 km2
0.8
2019 minus 2018
100
0.7 75
50
0.6
25
0.5 0
05 1
07 1
5
06 1
5
5
08 1
5
09 1
5
/0
/1
/0
/0
/1
/1
/0
/1
/0
/1
0.4
05
06
07
08
09
Month/day
Fig. 3 Monthly averaged Greenland snow and ice albedo from Sentinel-3 OLCI data in July 2018 and 2019. Inset figures: Time series
of Greenland ice-sheet albedo and bare-ice area over 2018 and 2019 melt seasons (1 May and 15 September). a: Daily area-averaged
albedo. b: Daily bare-ice area. Blue shading corresponds to the range of bare-ice area computed from bare-ice albedo threshold
values of 0.585 and 0.560, according to ice-ablation thresholds of 4 and 9 cm, respectively. The asymmetry of the blue shading (lower
parts confounded with the main curve) is a result of the change in bare-ice albedo as a function of the ice-ablation threshold discussed
in section 2.2. c: Daily difference in bare-ice area between 2019 and 2018. Grey shading corresponds to the range of bare-ice area
deviations computed from the two bare-ice albedo threshold values used in c. Grey vertical shading highlights the month of July.
respectively. This is 0.013 and 0.006 higher than the ice-sheet surface area, their inclusion increases 2019
values determined in this study for the same time span and 2018 maximum daily bare-ice areas by 17.2% and
(0.804 and 0.771). 15.5%, respectively, increasing calculated bare-ice area
On average from 1 May to 15 September, daily bare- ratios to 10.4% and 5.3%.
ice area was 47 329 km² in 2019 (Fig. 3b), 4.5 times Despite the extremely low ice-ablation threshold of
larger than in 2018, and reached a maximum difference 4 cm, corresponding to the uncertainty of a single pres-
of 102 943 km² (3.1 times larger than the previous year) sure measurement, we found maximum daily bare-ice
on 3 August (Fig. 3c). This deviation in ratios of average areas equivalent to ± 11.4% (2018) and ± 7.0% (2019)
and maximum values between 2019 and 2018 is a result of the values determined with the selected threshold
of the early 2019 melt onset, while 2018 bare-ice area of 6 cm. By applying the high ice-ablation threshold of
remained near zero for the same period. A maximum 9 cm, we found differences equivalent to ± 2.0% and ±
daily bare-ice area of 153 489 km² occurred in 2019, 2.8% (for 2018 and 2019, respectively) further support-
73 269 km² or 1.9 times larger than the 2018 maximum ing a relatively low ice-ablation threshold sensitivity.
(80 220 km²). In 2019, the maximum daily bare-ice area
corresponded to 9.0% of the Greenland ice sheet, only 5 Conclusions
4.7% in 2018. Maximum daily bare-ice area occurred 14 PROMICE AWS time series of air temperature, snow
days earlier in 2019 than 2018 (3 and 17 August, respec- height, ice ablation and albedo provide insights into snow
tively), while minimum albedo occurred 9 days earlier in and meteorological processes at the ablation-driven
2019 than 2018 (4 and 13 August, respectively). transition from seasonal snow to bare-ice surface con-
Using a watershed algorithm (van der Walt et al. 2014) ditions. We identified 6 cm as the first significant mea-
to determine the outer boundaries of the ice sheet, we sured value of ice ablation through a sensitivity analysis,
identified ice caps as ice bodies separated from the which matches the ice ablation uncertainty determined
ice sheet. While ice caps represent only c. 3.6% of the by Fausto et al. (2016). By applying the 6 cm threshold to
Wehrlé et al. 2021: GEUS Bulletin 47. 5284. https://doi.org/10.34194/geusb.v47.5284 7 of 9www.geusbulletin.org
identify the date of bare-ice onset for each station year Aoki, T., Kuchiki, K., Niwano, M., Kodama, Y., Hosaka, M. & Tanaka, T.
2011: Physically based snow albedo model for calculating broadband
in a semi-automatic procedure, we determined a bare-
albedos and the solar heating profile in snowpack for general circu-
ice-onset albedo of 0.565 ± 0.109 for the Greenland ice lation models. Journal of Geophysical Research 116(D11). https://doi.
sheet. This value is between the recommended values org/10.1029/2010jd015507
Box, J.E., Fettweis, X., Stroeve, J.C., Tedesco, M., Hall, D.K. & Steffen, K.
for superimposed ice and clean ice reported by Cuffey
2012: Greenland ice sheet albedo feedback: thermodynamics and
& Paterson (2010). After bare-ice onset, we found a fur- atmospheric drivers. The Cryosphere 6(4), 821–839. https://doi.
ther albedo decrease of 0.111, which may be the result org/10.5194/tc-6-821-2012
of ice-algal growth. Average ice ablation was 3.5 ± 0.5 cm Box, J.E. & Sharp, M.A. 2017: Changes to Arctic land ice. In: Snow, Water,
Ice and Permafrost in the Arctic (SWIPA) 2017, 148–168. Oslo, Norway:
per day while average air temperature remained roughly Arctic Monitoring and Assessment Programme (AMAP).
constant, suggesting that stable air temperatures were Box, J.E., van As, D. & Steffen, K. 2017: Greenland, Canadian and Icelandic
associated with the sink of heat energy during surface land-ice albedo grids (2000–2016). Geological Survey of Denmark and
Greenland Bulletin 38, 53–56. https://doi.org/10.34194/geusb.v38.4414
melting. We found no dependence of bare-ice albedo
Brun, E. 1989: Investigation on wet-snow metamorphism in respect
on elevation, latitude or longitude, suggesting that the of liquid-water content. Annals of Glaciology 13, 22–26. https://doi.
bare-ice-onset albedo determined here is representa- org/10.3189/s0260305500007576
Cook, J.M. et al. 2020: Glacier algae accelerate melt rates on the
tive for locations in between PROMICE AWSs. We further
south-western Greenland ice sheet. The Cryosphere 14(1), 309–330.
combined snow albedo after Kokhanovsky et al. (2018, https://doi.org/10.5194/tc-14-309-2020
2020) with bare-ice albedo estimated from a fit between Cuffey, K.M. & Paterson, W.S.B. 2010: The physics of glaciers. Fourth edi-
Sentinel-3 OLCI TOA reflectances and PROMICE albedo tion. 704 pp. Amsterdam: Academic Press.
Fausto, R.S., van As, D., Box, J.E., Colgan, W., Langen, P.L. & Mottram, R.H.
data. In a cross-validation using 4729 daily PROMICE 2016: The implication of nonradiative energy fluxes dominating Green-
observations, we confirmed a high correlation coeffi- land ice sheet exceptional ablation area surface melt in 2012. Geophysical
cient (0.885), a RMSE of 0.079 and an insignificant aver- Research Letters 43(6), 2649–2658. https://doi.org/10.1002/2016gl067720
Fausto, R.S., van As, D., Ahlstrøm, A.P. & Citterio, M. 2012: Assessing the
age bias (0.005) with PROMICE ground measurements.
accuracy of Greenland ice sheet ice ablation measurements by pres-
Applying PROMICE-derived bare-ice-onset albedo to the sure transducer. Journal of Glaciology 58(212), 1144–1150. https://doi.
Sentinel-3 imagery we produced quantitative mapping of org/10.3189/2012jog12j075
Fausto, R.S., van As, D., Antoft, J.A., Box, J.E. & Colgan, W. 2020: Greenland
albedo and bare-ice area variations. The maximum daily
ice sheet melt area from MODIS (2000–2014). Geological Survey of
bare-ice area was 1.9 times larger in 2019 than in 2018 Denmark and Greenland Bulletin 33, 57–60. https://doi.org/10.34194/
(153 489 and 80 220 km², respectively), covering 9.0% geusb.v33.4498
and 4.7% of the ice sheet. Peripheral ice caps increase Fettweis, X. et al. 2020: GrSMBMIP: Intercomparison of the modelled
1980–2012 surface mass balance over the Greenland Ice sheet. The
bare-ice area estimates by 17.2% (2019) and 15.5% Cryosphere Discussions, 1–35. https://doi.org/10.5194/tc-2019-321
(2018). Thus, the combination of ground and spaceborne Kokhanovsky, A., Box, J.E., Vandecrux, B., Mankoff, K.D., Lamare, M.,
observations yields powerful quantitative constraint on Smirnov, A. & Kern, M. 2020: The determination of snow albedo from
satellite measurements using fast atmospheric correction technique.
snow-cover dynamics across Greenland ice.
Remote Sensing 12(2), 234. https://doi.org/10.3390/rs12020234
Kokhanovsky, A., Lamare, M., Mauro, B.D., Picard, G., Arnaud, L., Dumont,
Acknowledgements M., Tuzet, F., Brockmann, C. & Box, J.E. 2018: On the reflectance
Reviewers are thanked for constructive commentary. spectroscopy of snow. The Cryosphere 12(7), 2371–2382. https://doi.
org/10.5194/tc-12-2371-2018
Funding statement Metsämäki, S., Pulliainen, J., Salminen, M., Luojus, K., Wiesmann, A.,
PROMICE has been supported by the Danish Ministry of Climate, Solberg, R., Böttcher, K., Hiltunen, M. & Ripper, E. 2015: Introduction
Energy and Utilities. The work with Sentinel-3 is part of the Pre- to globSnow snow extent products with considerations for accuracy
operational Sentinel-3 snow and ice products (SICE) project supported assessment. Remote Sensing of Environment 156, 96–108. https://doi.
by European Space Agency (ESA) contract 4000125043-ESA/AO/1- org/10.1016/j.rse.2014.09.018
9101/17/I-NB EO Science for Society. Moon, T.A. et al. 2020: Greenland ice sheet. In: Blunden, J. & Arndt,
Competing interests D.S. (eds): State of the climate in 2019. Bulletin of the American
The authors declare no competing interests. Meteorological Society 101(8), S257–S260. https://doi.org/10.1175/
BAMS-D-20-0086.1
Author contributions
Ryan, J.C., Hubbard, A., Irvine-Fynn, T.D., Doyle, S.H., Cook, J.M., Stibal,
AW: writing – original draft preparation, methodology, software. JB:
M. & Box, J.E. 2017: How robust are in situ observations for validat-
conceptualization, methodology, visualization, writing – reviewing and
ing satellite-derived albedo over the dark zone of the Greenland Ice
editing. RF, MN, AA: writing – reviewing and editing.
Sheet? Geophysical Research Letters 44(12), 6218–6225. https://doi.
Additional files org/10.1002/2017gl073661
Additional files are available at https://doi.org/10.5281/zenodo.4244909, Ryan, J.C., Hubbard, A., Stibal, M., Irvine-Fynn, T.D., Cook, J., Smith, L.C.,
https://doi.org/10.5281/zenodo.4244905. Data produced in this study are Cameron, K. & Box, J. 2018: Dark zone of the Greenland Ice Sheet con-
available at https://doi.org/10.22008/FK2/SNX8L6. trolled by distributed biologically-active impurities. Nature Communi-
cations 9(1), 1065. https://doi.org/10.1038/s41467-018-03353-2
Ryan, J.C., Smith, L.C., van As, D., Cooley, S.W., Cooper, M.G., Pitcher, L.H.
References & Hubbard, A. 2019: Greenland Ice Sheet surface melt amplified by
Ahlstrøm, A.P. et al. 2008: A new programme for monitoring the mass snowline migration and bare ice exposure. Science Advances 5(3),
loss of the Greenland ice sheet. Geological Survey of Denmark eaav3738. https://doi.org/10.1126/sciadv.aav3738
and Greenland Bulletin 15, 61–64. https://doi.org/10.34194/geusb. Satopaa, V., Albrecht, J., Irwin, D. & Raghavan, B. 2011: Finding a ‘knee-
v15.5045 dle’ in a haystack: detecting knee points in system behavior. 2011
Wehrlé et al. 2021: GEUS Bulletin 47. 5284. https://doi.org/10.34194/geusb.v47.5284 8 of 9www.geusbulletin.org
31st International Conference on Distributed Computing Systems 2014: scikit-image: image processing in Python. PeerJ 2, e453. https://
Workshops, Minneapolis, MN, USA, 20–24 June 2011.https://doi. doi.org/10.7717/peerj.453
org/10.1109/icdcsw.2011.20 Wang, W., Zender, C.S., van As, D., Smeets, P. & van den Broeke, M.
Stibal, M. et al. 2017: Algae drive enhanced darkening of bare ice on the 2015: An iterative, geometric, tilt correction method for radiation and
Greenland ice sheet. Geophysical Research Letters 44(22), 11463– albedo observed by automatic weather stations on snow-covered
11471. https://doi.org/10.1002/2017gl075958 surfaces: application to Greenland. AGUFM 2015, C41B–0697.
Tedesco, M. & Fettweis, X. 2020: Unprecedented atmospheric condi- Wehrlé, A. & Box, J.E. 2020a: Greenland bare ice albedo v1.0, Zenodo.
tions (1948–2019) drive the 2019 exceptional melting season over the https://doi.org/10.5281/zenodo.4244909
Greenland ice sheet. The Cryosphere 14(4), 1209–1223. https://doi. Wehrlé, A. & Box, J.E. 2020b: SICE Tools v1.0, Zenodo. https://doi.
org/10.5194/tc-14-1209-2020 org/10.5281/zenodo.4244905
van As, D. 2011: Warming, glacier melt and surface energy budget from Wehrlé, A. & Box, J. 2021: SICE implementation of the Simple Cloud
weather station observations in the Melville Bay region of north- Detection Algorithm (SCDA) v2.0. GEUS Dataverse, V1. https://doi.
west Greenland. Journal of Glaciology 57(202), 208–220. https://doi. org/10.22008/FK2/N0XWSJ
og/10.3189/002214311796405898 Williamson, C.J. et al. 2020: Algal photophysiology drives darkening
van den Broeke, M., Smeets, P., Ettema, J., van der Veen, C., van and melt of the Greenland Ice Sheet. Proceedings of the National
de Wal, R. & Oerlemans, J. 2008: Partitioning of melt energy and Academy of Sciences 117(11), 5694–5705. https://doi.org/10.1073/
meltwater fluxes in the ablation zone of the west Greenland ice pnas.1918412117
sheet. The Cryosphere 2(2), 179–189. https://doi.org/10.5194/ Wiscombe, W.J. & Warren, S.G. 1980: A model for the spectral albedo
tc-2-179-2008 of snow. I: pure snow. Journal of the Atmospheric Sciences 37(12),
van der Walt, S., Schönberger, J.L., Nunez-Iglesias, J., Boulogne, F., War- 2712–2733. https://doi.org/2.0.co;2”>10.1175/1520-0469(1980)0372.0.co;2
Wehrlé et al. 2021: GEUS Bulletin 47. 5284. https://doi.org/10.34194/geusb.v47.5284 9 of 9You can also read